2390
Simultaneous detection of glucose and glutamate by CEST MRI: a preliminary study for experimental brain injury1Radiology and Imaging Sciences, National Institutes of Health, Bethesda, MD, United States, 2Radiology and Imaging Sciences, National Institutes of Health
Synopsis
The current study investigated the CEST sensitivity and specificity for simultaneous glucose (glucoCEST) and glutamate (gluCEST) detection on a phantom and a rodent brain injury. Using a median saturation power (2μT) and short saturation duration (2s), the MTRasym at 1.2, 2.1 and 2.9ppm could detect the glucose content, while the MTRasym at 3ppm could measure the glutamate in vivo. The glucoCEST results were compared in parallel to the 18F-FDG PET detecting the tissue uptake of glucose, while the gluCEST data were shown comparable to 18F-DPA PET radio-ligands binding to translocator protein (TSPO) for imaging microglial activation in the injured brain.
PURPOSE
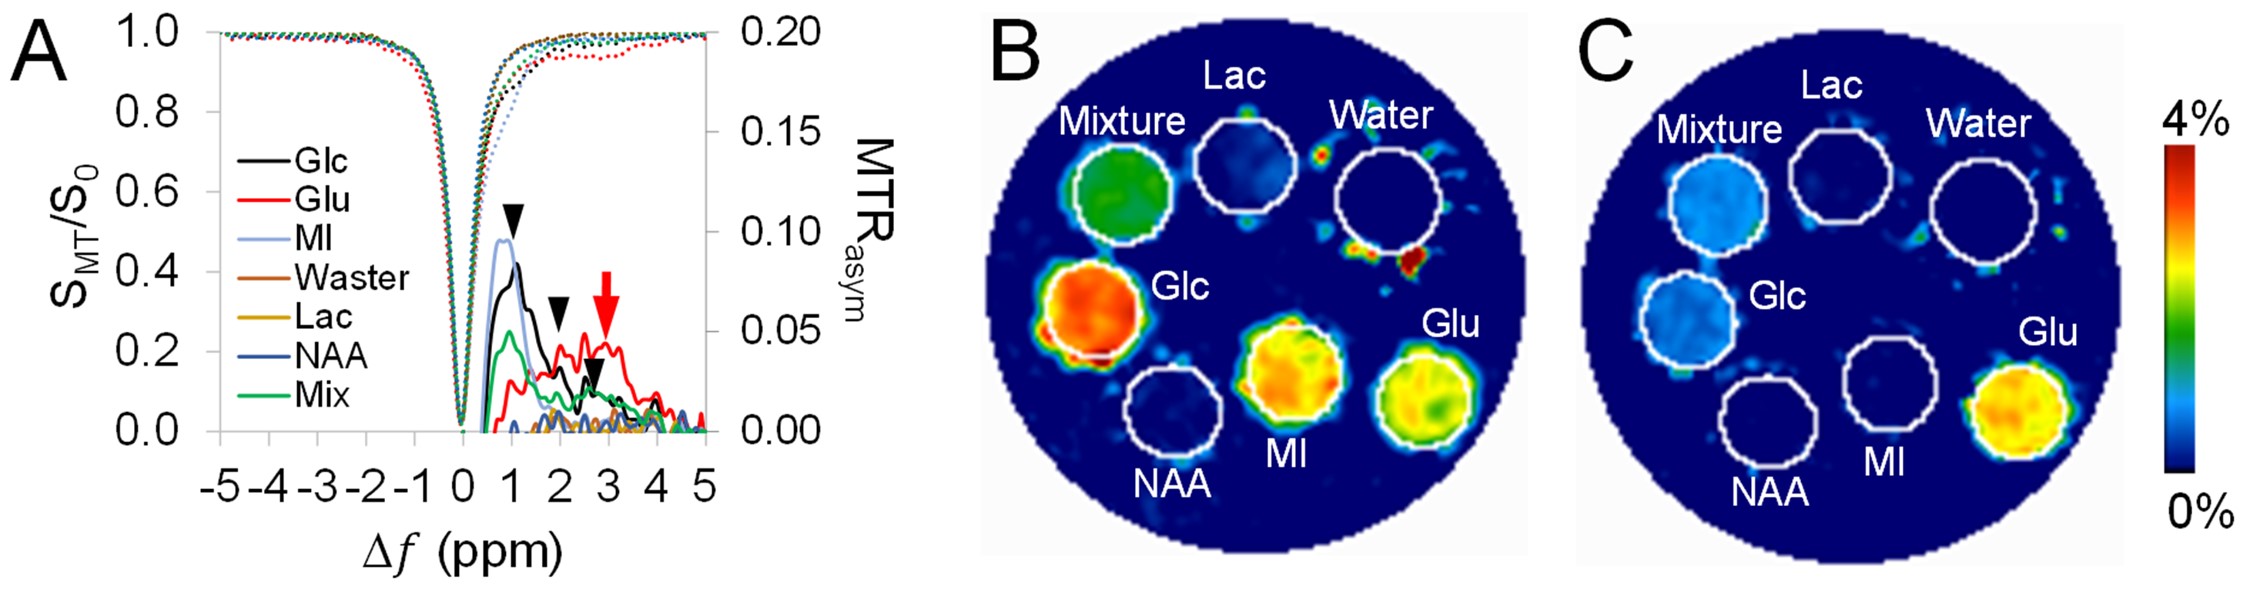
The molecular CEST imaging previously has been shown sensitive to the glucose and glutamate by measuring the exchangeable protons from the hydroxyl and amine group respectively for targeting glucose metabolism and inflammation1. The current study investigated the feasibility of CEST imaging for a simultaneous detection on the proton transfer for glucose (glucoCEST) and glutamate (gluCEST). The CEST imaging parameters were optimized on a test phantom consisting of glucose (Glc) and glutamate (Glu), together with other concentrated molecules in the brain: myo-inositol (MI), lactate (Lac), N-Acetylaspartic acid (NAA), and a mixture of them to test the sensitivity and specificity of glucose and glutamate detection by CEST. A preliminary in vivo experiment was performed on a rat brain with injury and compared to the 18F-FDG positron emission tomography (PET) detecting the glucose uptake and 18F-DPA for imaging microglial activation in vivo.METHODS
The phantom experiments were done using a Doty radiofrequency quadrature coil (Doty Scientific, Inc., SC) on a Bruker 9.4T scanner (Bruker Corp., MA). The CEST data were acquired by 2D Rapid Acquisition with Relaxation Enhancement (RARE) sequence with (SMT) and without (S0) magnetization transfer (MT) preparation pulses: TR 3.10s, TE 10.39ms; RARE factor 4; in plane resolution 200μm2, slice thickness 0.8mm. The effect of varying MT preparation pulses on the sensitivity and specificity for glucose detection were investigated by arraying the saturation power from 0.5μT to 7μT and saturation duration from 0.5s to 3s. The CEST Z-spectrum were acquired from the MT frequency offsets (Δω) from −2.0kHz to +2.0kHz with 50Hz frequency stepping, as a result, 81 points were sampled to delineate the entire Z-Spectrum from -5 part per million (ppm) to +5ppm. CEST data were corrected for B0/B1 field inhomogeneity using WASSR water referencing2: 0.2 μT for saturation power and 0.1s for saturation duration, Δω −0.4kHz to +0.4kHz with 10Hz frequency stepping. The asymmetry of magnetization transfer ratio (MTRasym) maps were derived for glucoCEST (1.2, 2.1, 2.9ppm) and gluCEST (3ppm) maps by calculating the area under the curve at the related chemical shifts. A focal injured rat brain was scanned using the same imaging parameters with the optimized MT saturation pulses (2μT, 2s). 18F-FDG and 18F-DPA PET were performed 24 and 48 hours after MRI scans, respectively, using Siemens micro-PET/CT scanner. Standardized uptake values were calculated for the PET data.RESULTS
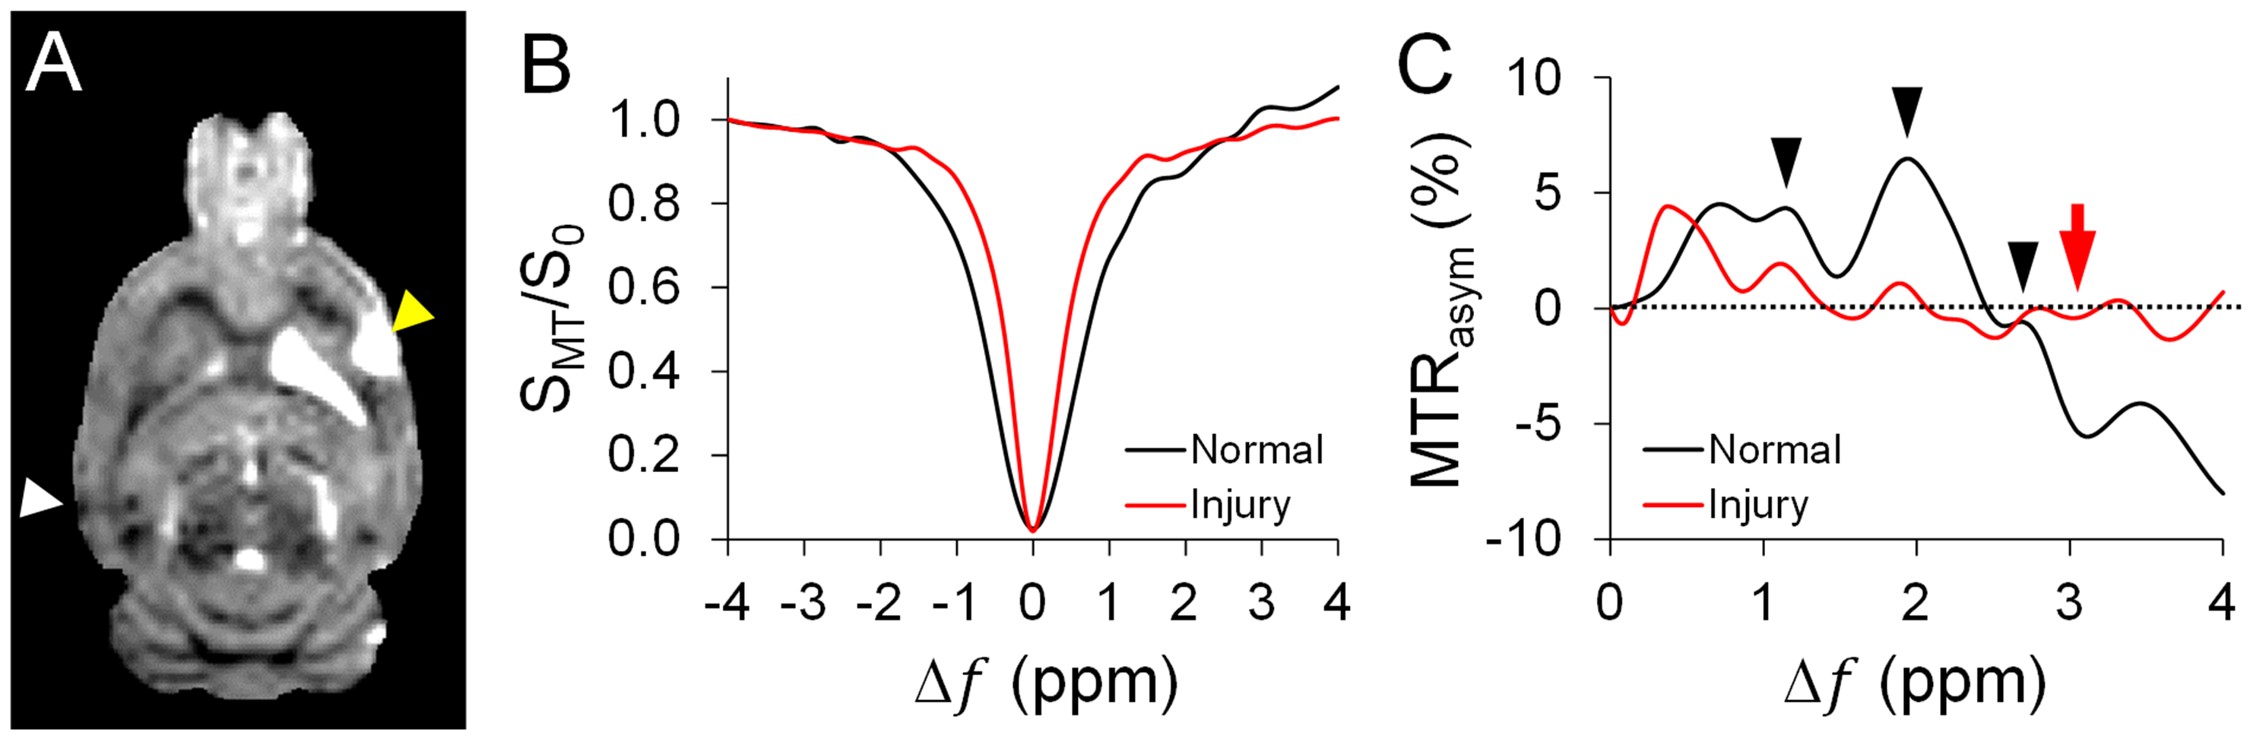
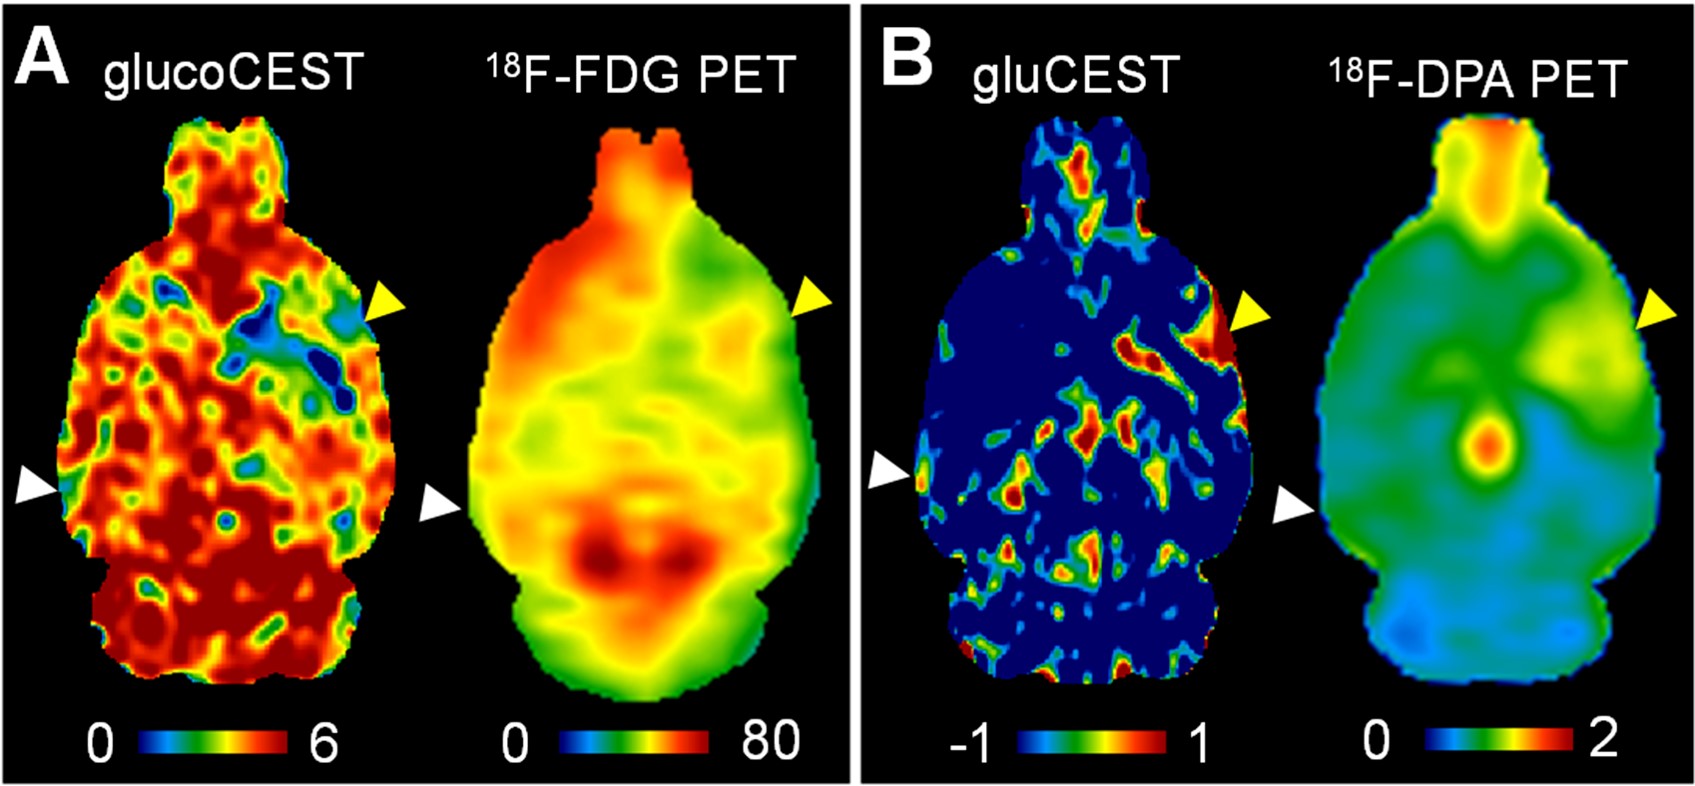
The MTRasym of the Glc phantom by saturation power 2μT, and duration 2s showed peaks at 1.2, 2.1, 2.9ppm, and that of Glu phantom exhibited a broad coverage of peaks from 1 to 3.5 ppm (Fig. 1). The glucoCEST map showed the most contrast to Glc, while the gluCEST displayed predominant contrast to the Glu. The CEST Z-spectrum and MTRasym of the rat brain showed different patterns between the normal and injured tissue (Fig. 2). The injured tissue comparing to the normal tissue exhibited decreased MTRasym at the hydroxyl chemical shifts, where the increased MTRasym was seen for the amine chemical shift range at 3ppm. Comparable results are seen in the assessment of glucose uptake between the glucoCEST and 18F-FDG PET (Fig. 3A), and for the inflammation markers between gluCEST and 18F-DPA PET (Fig. 3B).DISCUSSION
CEST imaging has been previously shown sensitive to detect glucose uptake in tumor3 and neuroinflammation in Alzheimer's disease4 by selectively mapping the chemical shifts of the hydroxyl and amine group. In the current study, we further demonstrated the possibility to simultaneously detecting the glucose and glutamate content by optimized CEST acquisition parameters to show the decreased glucose metabolism and increased inflammation at the same time. The current finding suggests that the CEST technique has strong potentials for the simultaneous detection of the glucose and glutamate, without using radioactive isotopes, for repetitively monitoring the metabolism and inflammation in the TBI.Acknowledgements
No acknowledgement found.References
[1] van Zijl, MRM, 2011;
[2] Kim, MRM, 2009;
[3] Walker-Samuel, Nat.Med, 2013;
[4] Haris, NMR Biomed, 2013
Figures