2382
Brain metabolism and temperature assessment in traumatic brain injury subjects using 3D Echo-planar Spectroscopic Imaging1Laboratory of Molecular Imaging, Singapore Bioimaging Consortium, Singapore, Singapore, 2Miller School of Medicine, University of Miami, Miami, FL, United States
Synopsis
Traumatic brain injury (TBI) results in a broad spectrum of symptoms and disabilities and has a high rate of mortality and morbidity. TBI is associated with elevated brain temperature due to inflammation. TBI has heterogeneous consequences of pathophysiology, changed intracranial dynamics and cerebral metabolism. In some cases there is an increase in ICP and cerebral perfusion which makes the management of the injury difficult . Therapeutic hypothermia is recommended as one of the acute management techniques as it increases neuroprotection, decreases cerebral metabolism and ICP. To induce hypothermia and monitor the brain temperature a noninvasive and accurate assessment of cerebral temperature is essential. MR based temperature measurement based on the water resonance frequency, relaxation times (T1, T2), spectroscopy, proton density, diffusion etc. have been widely used. Echo-planar spectroscopic imaging (EPSI) method has the advantage of simultaneous acquisition of water and spectrum in a single TR, by which we can acquire the whole brain spectrum in a short time . In this study we have explored changes in brain temperature due to cerebral metabolic changes in control, mild and moderate TBI subjects.
Purpose
Traumatic brain injury (TBI) results in a broad spectrum of symptoms and disabilities and has a high rate of mortality and morbidity. TBI is associated with elevated brain temperature due to inflammation. TBI has heterogeneous consequences of pathophysiology, changed intracranial dynamics and cerebral metabolism. In some cases there is an increase in ICP and cerebral perfusion which makes the management of the injury difficult 1, 2. Therapeutic hypothermia is recommended as one of the acute management techniques as it increases neuroprotection, decreases cerebral metabolism and ICP 3. To induce hypothermia and monitor the brain temperature a noninvasive and accurate assessment of cerebral temperature is essential. MR based temperature measurement based on the water resonance frequency, relaxation times (T1, T2), spectroscopy, proton density, diffusion etc.2 have been widely used. Echo-planar spectroscopic imaging (EPSI) method has the advantage of simultaneous acquisition of water and spectrum in a single TR, by which we can acquire the whole brain spectrum in a short time 4. In this study we have explored changes in brain temperature due to cerebral metabolic changes in control, mild and moderate TBI subjects.Materials and Methods
In this preliminary study we have included fifty-three subjects and grouped them as: 1) controls (N=18, mean age 32.4), 2) mild TBI (3 groups -- < 1 week, 1 to 3 weeks and 3 to 8 weeks, N=9/group, mean age ~35yrs) and 3) moderate TBI (2 groups—1 to 3 weeks, 3 to 8 weeks, N = 4/group, mean age ~35yrs). The Glasgow Coma Scale (GCS) at the time of admission was 13-15 for mild TBI and 9-12 for moderate cohorts respectively. CT scan was performed as a routine examination to confirm the injury. All studies were approved by IRB and patient consent was also taken. 3T Siemens Tim Trio was used to acquire EPSI, T1-MPRAGE, and T2 MRI, with 8-channel detection. Spin echo based 3D EPSI sequence had TE/TR1/TR2/TI/FA/FOV/ Voxel Size =70 ms/1710 ms/591 ms/198 ms/73º/ 280×280×180 mm3/5.6×5.6×10 mm3, 70 Hz water suppression bandwidth. Both metabolite and water spectral signals were acquired in a single TR in an interleaved fashion. High-resolution T1-weighted images were acquired using a 3D MPRAGE sequence with TR/TE/flip angle/slice thickness/#slice/FOV/matrix size/#average = 2200 ms/1.69 ms/20º/1 mm/160/256 mm × 176 mm/192 × 132/1; without inter-slice spacing and the total acquisition time was ~4 minutes. MIDAS was used to process the EPSI data 4. Brain temperature computation was done using the chemical sift between NAA and water and the equation derived during phantom based calibration5.Results
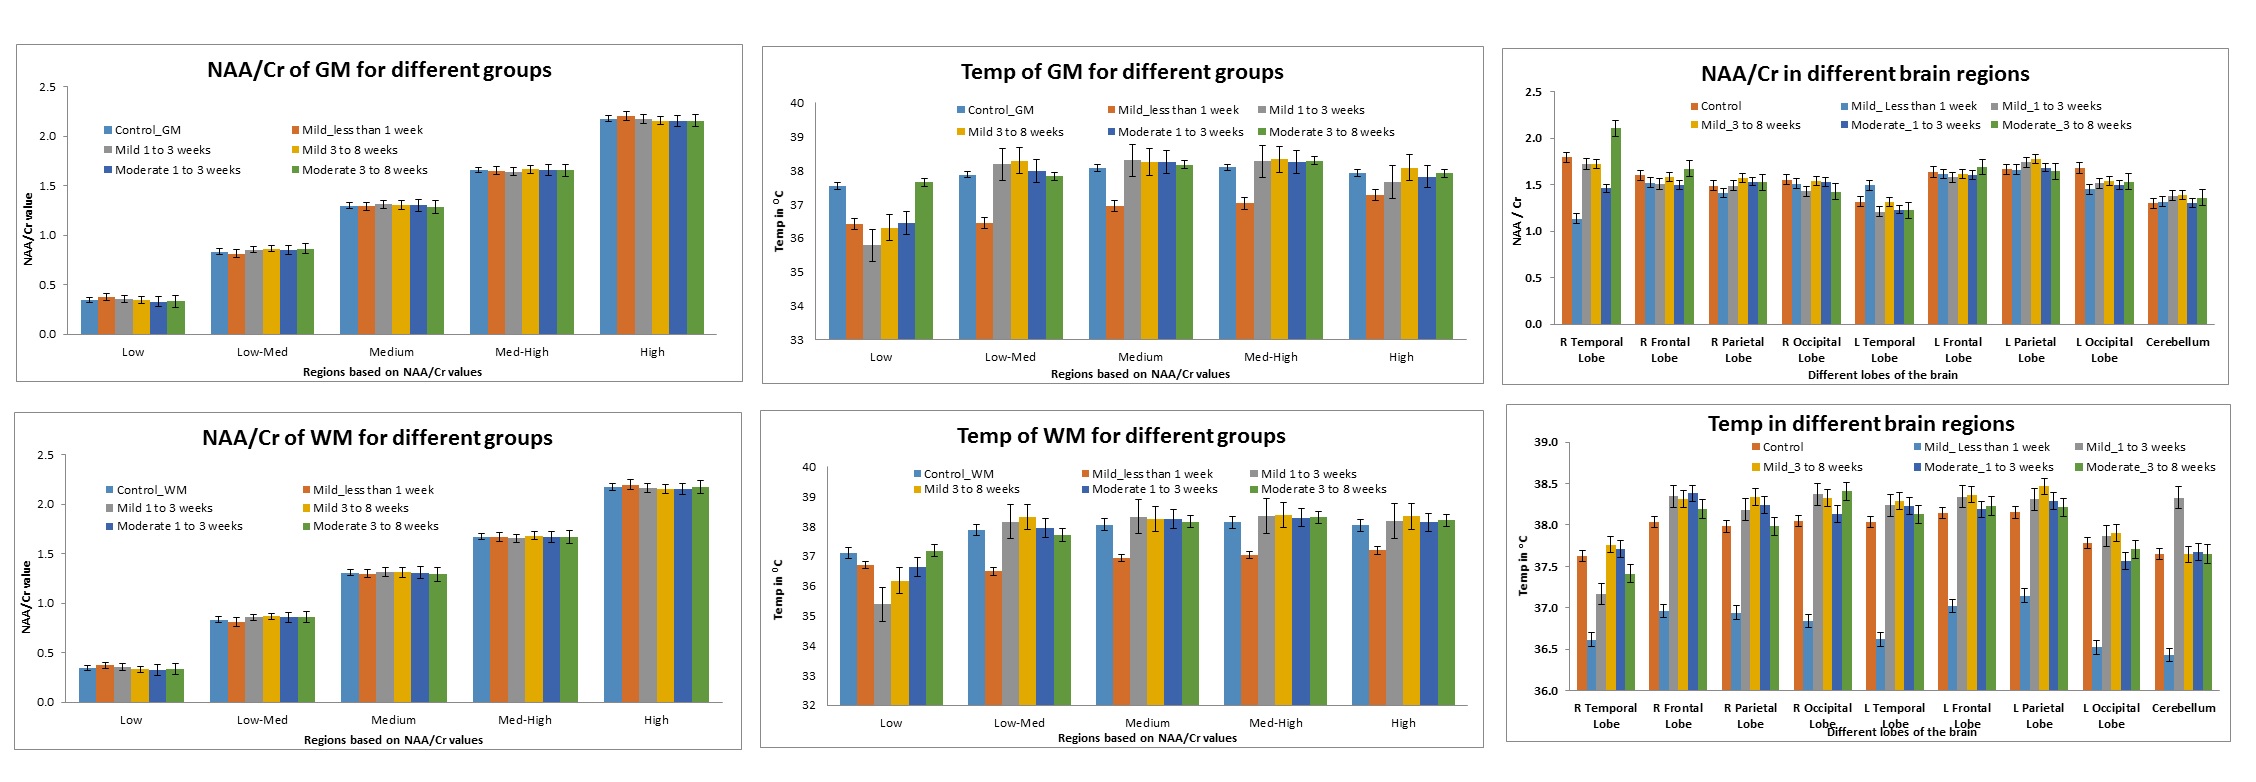
Based on the NAA/Cr values the brain regions were classified as Low (> 0 & <= 0.5), Low-Med (> 0.5 & <= 1), Medium (> 1 & <= 1.5), Med-High (> 1.5 & <=2) and High (> 2) for both Controls (N=18), mild (N=27) and moderate (N=8) TBI subjects. Using Metabolite maps in institutional units, CSF, GM, and WM maps as faction between 0 to 1 and temperature in GM and WM were computed in degrees centigrade. Figure shows (i) NAA/Cr ratios in GM and WM for Controls. Mild and Moderate TBI subjects, (ii) corresponding temperature values for different NAA/Cr regions and (iii) NAA/Cr and Temperature at different lobes.Conclusions
The preliminary study indicates that NAA/Cr ratios were similar for both Control and TBI subjects. The temperature in GM of control subjects was around 37 0C in all NAA/Cr regions whereas in WM it ranged from 36.5 – 38 0C. The temperature was lower in low NAA/Cr region of Control subjects than in other regions. GM and WM regions of mild TBI cohort (< 1 week) showed lower temperature irrespective of NAA/Cr values whereas mild TBI (1 – 3 weeks and 3-8 weeks) and moderate TBI cohorts had lower temperature only in low NAA/Cr regions for both GM and WM, but had similar temperature as control subjects in other NAA/Cr regions. The mild (< 1 week) cohort had lower brain temperature at all the lobes. This could also be due to paracetamol /analgesic which was administered as a pre-treatment in the mild cohort.Acknowledgements
1. A*STAR – MINDEF Grant (Project Number: 1018319668)
2. All data was acquired with grant support from the National Institutes of Health, R01 NS055107.
References
[1] Ségolène Mrozek et al. Anes Res and Prac, Vol. 2012, Article ID 989487.
[2] Viola R et al J Magn Reson Imaging. 2008 Feb; 27(2): 376–390.
[3] Shoji Yokobori et al. J Intensive Care. 2016; 4: 28.
[4] Andrew A. Maudsley et al. Magnetic Resonance in Medicine. 2001; 46(6):1072–78.
[5] Bhanu Prakash KN et al. ISMRM 2014.
Figures