2381
Progressive ventricles enlargement and CSF volume increases as a marker of neurodegeneration in SCI patients: A longitudinal MRI study1Spinal Cord Injury Center Balgrist, University of Zurich, Zurich, Switzerland, 2Institute of Cognitive Neurology and Dementia Research, Otto-von-Guericke-University Magdeburg, Magdeburg, Germany, 3German Center for Neurodegenerative Diseases (DZNE), Magdeburg, Germany, 4Department of Brain Repair and Rehabilitation, UCL Institute of Neurology, London, United Kingdom, 5Wellcome Trust Centre for Neuroimaging, UCL Institute of Neurology, London, United Kingdom, 6Department of Neurophysics, Max Planck Institute for Human Cognitive and Brain Sciences, Leipzig, Germany
Synopsis
Following Spinal Cord Injury the sensorimotor and limbic system immediately undergo progressive neurodegeneration (atrophy). Next to the focal grey and white matter atrophy, localized CSF and ventricular volume changes may provide additional biomarkers for brain atrophy. We therefore aimed to track brain atrophy by means of CSF volume changes and ventricular enlargements over two years following SCI. Our finding showed an increase of local CSF volume as well as ventricles enlargement in patients over time. The CSF volume which is normally used as a biomarker of general atrophy, showed also sensitivity to local degenerative changes in SCI.
Background
Acute spinal cord injury (SCI) immediately impairs sensorimotor and autonomic function. Consequently, after trauma the sensorimotor and limbic system undergo progressive neurodegeneration (atrophy)1,2. Next to the focal grey and white matter atrophy3, localized CSF and ventricular volume changes may provide additional biomarkers for brain atrophy as seen in neurodegenerative diseases4. We therefore aimed to track brain atrophy by means of CSF volume changes and ventricular enlargements over two years following SCI.Materials and Methods
Fifteen SCI patients (9 tetraplegic & 6 paraplegic patients, 47.13±20.12 years) and eighteen healthy controls (36.11±11.65 years) underwent a series of T1-weighted 3D-MPRAGE scans during five time-points over 2 years using a 3T Siemens scanner equipped with a 16-channel receive head/neck coil. The MPRAGE sequence composed of following parameters: FOV=224×256mm2, matrix=224×256, TR/TE=2420/4.18ms, BW=150Hz/p and 1mm3 resolution. The first scan (baseline) was acquired at 50 (±22) days post-injury, the second scan at 2, the third scan at 6, the fourth scan at 12, and the fifth scan at 24 months after injury. One patient was scanned only for the first two time points but still included in the analysis.
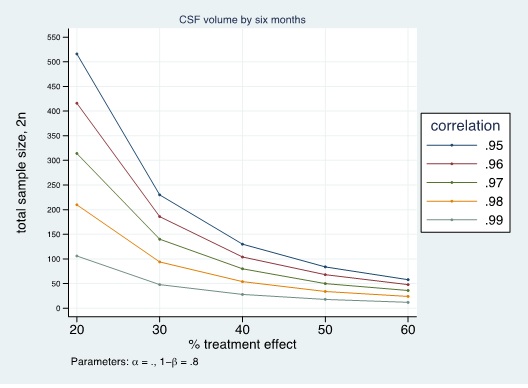
To obtain intracranial volume (ICV) at each time point, the MPRAGE scans were segmented into Grey matter (GM), white matter (WM), and CSF tissue segments using unified segmentation5. The CSF/ICV ratio was calculated and used as a global marker of atrophy6. To assess local change of CSF volume over time we used longitudinal Voxel-based Morphometry (VBM) within SPM12. Diffeomorphic registration was applied for longitudinal MRI and resulting midpoint images were segmented7. Nonlinear template generation and image normalization were performed using a geodesic shooting procedure8. The template was affine registered to MNI space for all subsequent modelling steps. Consecutively, normalized tissue segments from all subjects and time points were modulated by the Jacobian determinants encoding individual volume changes over time. To statistically assess cross-sectional and longitudinal changes of the CSF/ICV ratio we used pairwise comparisons for each time-point, linear mixed effects models with a group indicator and group × time interaction to assess changes over time using STATA. To assess group differences in trajectories of local CSF volume and ventricular enlargements we used random-effects analysis of the slope parameter following a two-stage summary statistics approach within SPM12. First, fixed-effects models including intercepts and time were estimated for all subjects. To generalize these effects to the population level, we applied two-sample t-tests for clinical group differences of slope parameters with covariates of age and sex. In particular, one tailed t-statistics were used to test for linear and non-linear (i.e. quadratic) changes. The associated p-values were corrected for multiple comparisons using family wise error correction and cluster significance was tested (after applying a cluster-forming-threshold of 0.001), using Gaussian random field theory. Sample size calculations used as 100% treatment effects of the difference between patient and control means, and the patient standard deviation at six months. Sample sizes were calculated to detect with 80% power and 5% significance a range of treatment effects for a two-armed trial, assuming a baseline adjusted8 comparison of means (ANCOVA). This also required the baseline vs six month Pearson correlation coefficient, which was estimated from the data.
Results
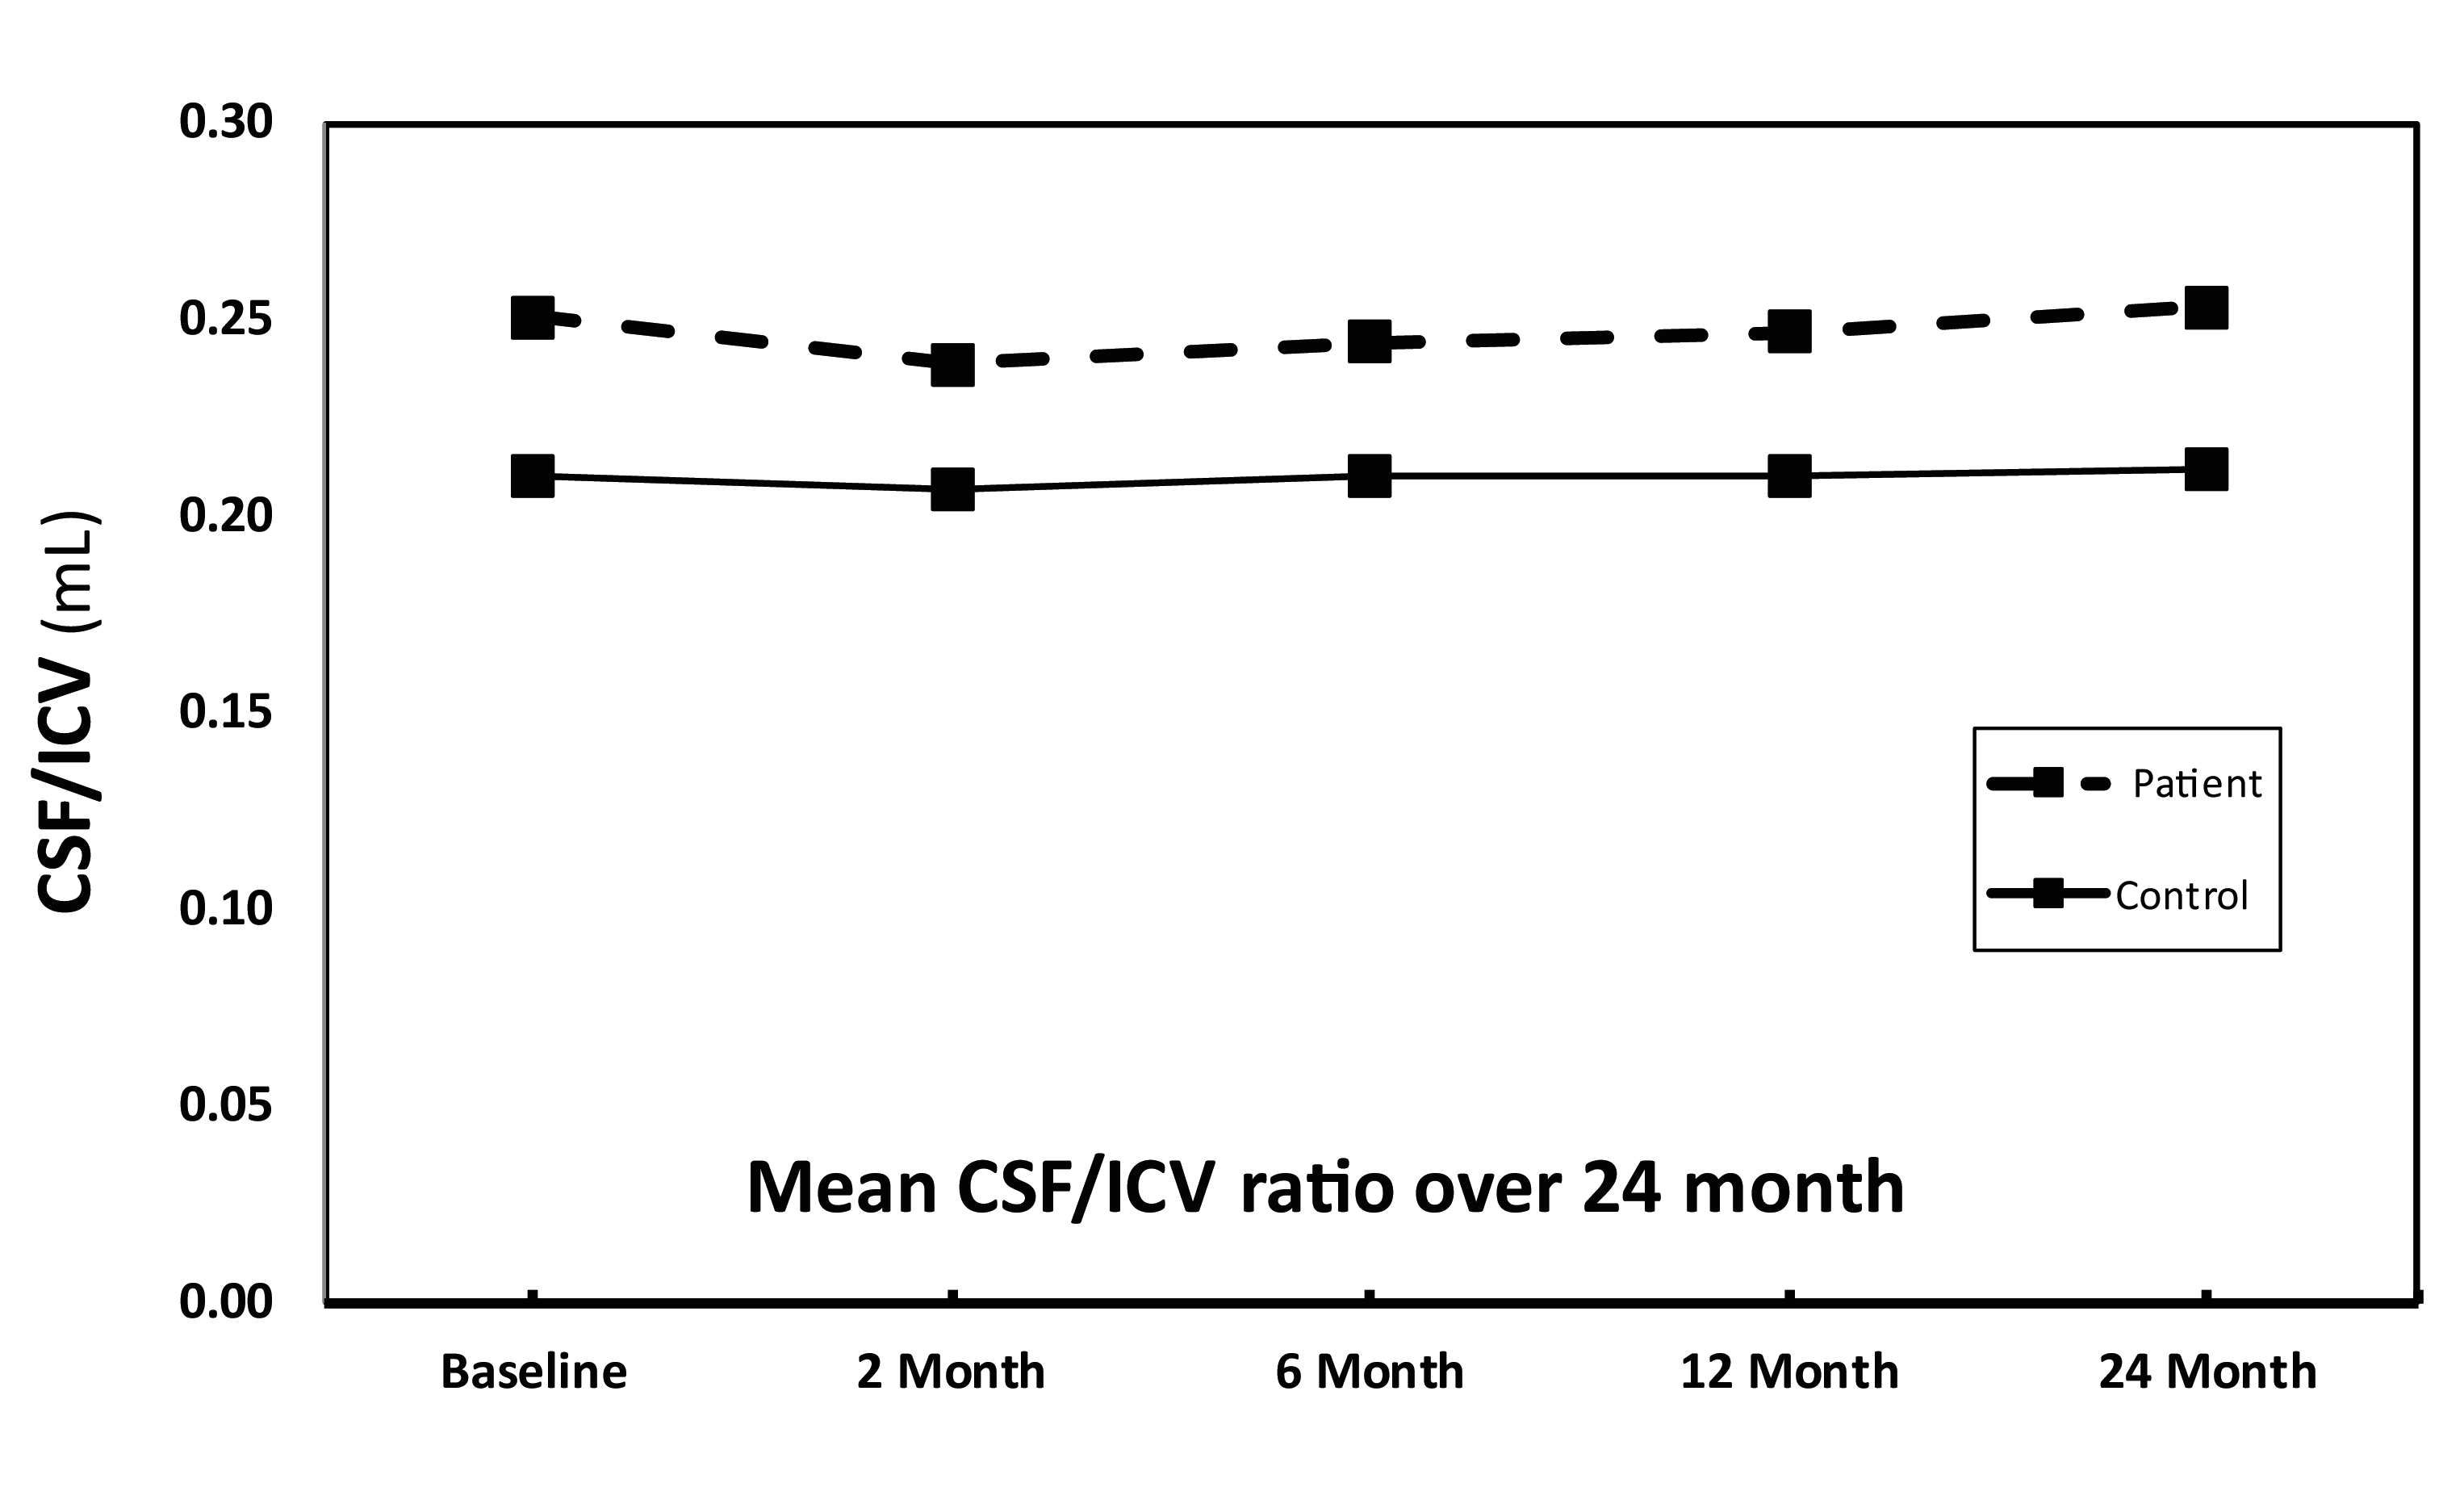
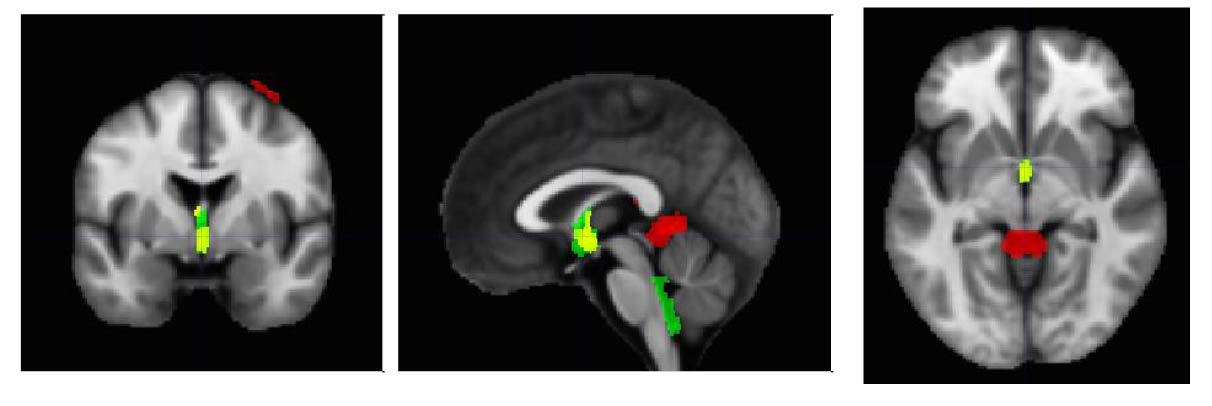
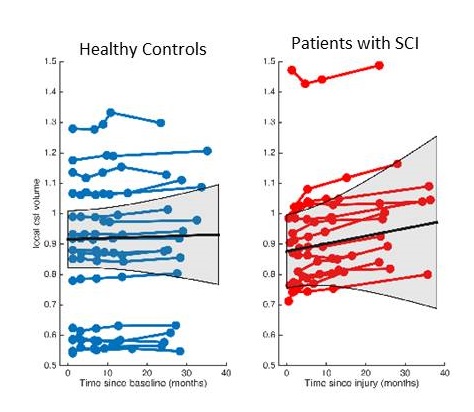
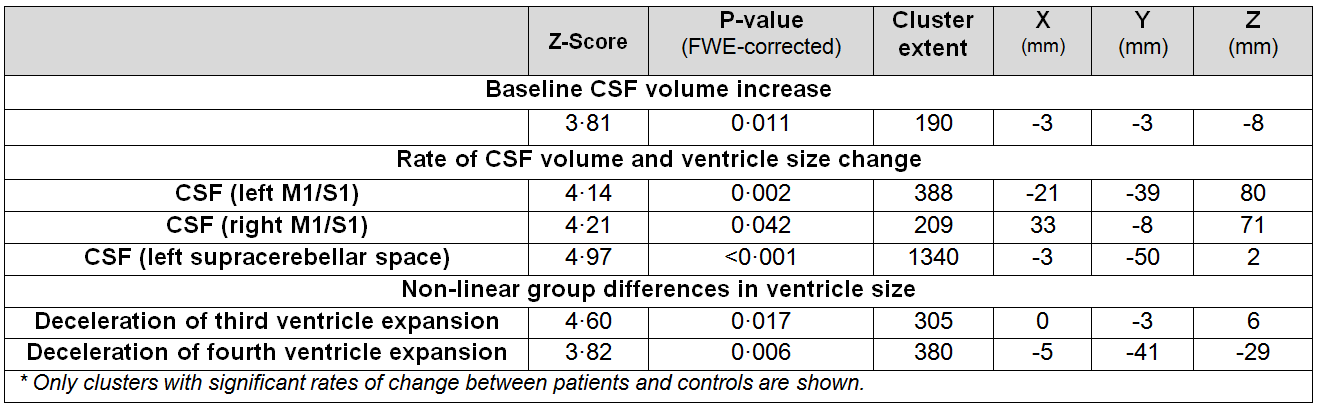
The CSF/ICV ratio (p<0.02) was increased in patients compared with controls at each time point. The changes rate was not significantly different between groups over time (Fig.1). At baseline the third ventricle was found to be enlarged (p=0.001). Over time, CSF volume increased linearly in the bilateral sensorimotor cortices (left: p=0.002, right: p=0.042) and within the supracerebellar space (p<0.001, Figure 2 &3 and Table 1). Testing for potential effects of recovery in terms of deceleration of the disease process, we found that the third (p=0.017) and fourth (p=0.006) ventricle enlargements levelled off (negative quadrature effect) in patients compared to controls. Figure 4 shows estimates of sample sizes for six-month trials with CSF volume which requires 25 patients per treatment arm to detect a 30% treatment effect.Discussion and Conclusion
This study showed that the CSF/ICV ratio and CSF volume increased (brain atrophy) and the third ventricle enlarged in patients at the earliest stages after injury. While the global measure of brain atrophy remained stable, focal CSF volume increases above the atrophying sensorimotor cortices9 and the supracerebellar space over time. Moreover, the rate of ventricular enlargements decelerated with increasing disease duration. In conclusion, CSF volume which is normally used as a biomarker of general atrophy is also sensitive to local degenerative changes in SCI. The sensitivity to scoring treatment effects speaks to its potential to serve as a sensitive biomarker in addition to local atrophy measures.Acknowledgements
This project has received funding from the European Union Horizon-2020 research #681094.References
1. Freund P, Friston K, Thompson AJ, et al. Embodied neurology: an integrative framework for neurological disorders. Brain 2016. doi:10.1093/brain/aww076.
2. Ghosh A, Haiss F, Sydekum E, et al. Rewiring of hindlimb corticospinal neurons after spinal cord injury. NatNeurosci 2010; 13: 97–104.
3. Freund P, Weiskopf N, Ashburner J, et al. MRI investigation of the sensorimotor cortex and the corticospinal tract after acute spinal cord injury: a prospective longitudinal study. Lancet Neurol 2013; 12: 873–81.
4. Schott JM, Price SL; Frost C; DipStat MA; Whitwell, JL; Rossor MN; and Fox NC Measuring atrophy in Alzheimer disease A serial MRI study over 6 and 12 months Neurology 2005;65:119–124
5. Weiskopf N1, Lutti A, Helms G, Novak M, Ashburner J, Hutton C. Unified segmentation based correction of R1 brain maps for RF transmit field inhomogeneities (UNICORT) Neuroimage. 2011 Feb 1;54(3):2116-24.
6. Bendel P1, Koivisto T, Aikiä M, Niskanen E, Könönen M, Hänninen T, Vanninen R. Atrophic enlargement of CSF volume after subarachnoid hemorrhage: correlation with neuropsychological outcome. AJNR Am J Neuroradiol. 2010 Feb;31(2):370-6
7. Ashburner J, Ridgway GR. Symmetric diffeomorphic modeling of longitudinal structural MRI. Front Neurosci 2012; 6: 197.
8. Ashburner J, Friston KJ. Diffeomorphic registration using geodesic shooting and Gauss-Newton optimisation. Neuroimage 2011; 55: 954–67.
9. Grabher P, Callaghan MF, Ashburner J, et al. Tracking sensory system atrophy and outcome prediction in spinal cord injury. Ann Neurol 2015. doi:10.1002/ana.24508.
Figures