2380
Neurodegeneration and its interaction with motor impairment in sub-acute SCI revealed by quantitative MRI1Spinal Cord Injury Center Balgrist, University of Zurich, Zurich, Switzerland, 2Department of Brain Repair and Rehabilitation, UCL Institute of Neurology, London, United Kingdom, 3Wellcome Trust Centre for Neuroimaging, UCL Institute of Neurology, London, United Kingdom, 4Department of Neurophysics, Max Planck Institute for Human Cognitive and Brain Sciences, Leipzig, Germany
Synopsis
Spinal cord injury (SCI)
leads to immediate sensorimotor and autonomic dysfunction and SCI patients
generally show little clinical recovery within the first year after injury.
Early structural changes at the spinal and brain level and their interactions
with recovery rate are not well understood. The aim of our study was to reveal
trauma-induced neurodegeneration and its interaction to impairment within early
stage after injury employing quantitative neuroimaging technique. Our finding
showed that significant atrophy and microstructural changes initiated in neural
sensorimotor system within already early stage after SCI and quantitative
neuroimaging methods hold potential to disclosing these neurodegeneration
mechanisms.
Background
Spinal cord injury (SCI) leads to immediate sensorimotor and autonomic dysfunction below the level of injury. Although neurorehabilitation can foster clinical recovery, neurodegeneration within the sensorimotor system is evident over the first year after SCI1,2. However, the onset and complex interplay between neurodegeneration and recovery are not well understood yet3,4. The aim of this cross-sectional study was to reveal trauma-induced neurodegeneration and its interaction to impairment within early stage after injury using quantitative MRI in cervical cord and brain.Materials and Methods
Twenty-four SCI patients (age=49.7±19.8 years) with mean post-SCI period of 45.6±20.7 days and twenty-three healthy controls (age=35.9±10.9 years) underwent a 3D-MPRAGE T1-weighted scan with following parameters: FOV=224×256mm2, matrix=224×256, TR/TE=2420/4.18ms, BW=150Hz/p, and 1mm3 resolution, using a 3T Siemens scanner combined with a 16-channel receive head/neck coil for assessing cord and brain atrophy. Patients also underwent the ISNCSCI5 examination. To assess microstructural changes associated with myelin and iron content, eighteen patients and twenty controls additionally underwent a multi-parameter mapping (MPM) MRI protocol6,7 which composed of three different 3D multi-echo FLASH sequences, designed to provide quantitative MR parameter of longitudinal relaxation rate (R1=1/T1), effective proton density (PD*), magnetization transfer saturation (MT) and effective transverse relaxation rate (R2*=1/T2*)8,9 with following parameters: TR=25ms, flip-angle=23° and 4° for T1-weighted images and PD-weighted images, respectively. TR=37ms, flip-angle=9° for MT-weighted images, six TE=2.46ms-14.78ms for MT-weighted acquisitions with two additional echoes at 17.22ms and 19.68ms for T1-weighted and PD-weighted acquisitions. We used Jim 7.0 for calculating cross-sectional spinal cord area (SCA) using a semi-automatic active surface model and in-house MATLAB scripts for ellipse fitting to calculate the anterior-posterior (APW) and left-right width (LRW)2. To assess cord microstructural changes, in-house MATLAB scripts based on nearest neighbour region growing followed by the ellipse fitting were used to define the cord ROI within the MT map procedure2. The ROI for the spinal cord was superimposed on the R1 maps and used to extract the mean quantitative parameters from the MT and R1 maps. Stata 13.0 was used to investigate cord changes between groups using two-sample t-tests. Vvoxel-based morphometry (VBM)10 and voxel-based cortical thickness (VBCT)11 were applied in whole brain to assess volumetric and cortical thickness changes, respectively and voxel-based quantification (VBQ)7,9 to assess changes to the myelin integrity (MT & R1) and iron content (R2*) using general linear models within the framework of SPM12. To account for multiple comparisons, we applied Gaussian Random Field theory12. To increase sensitivity for the analysis, a 10 mm sphere was centred at x=−6, y=−28, z=60 in the sensorimotor cortex leg area13,14. Finally, regression models were used to identify relationships between early structural changes and impairment (patients only).Results
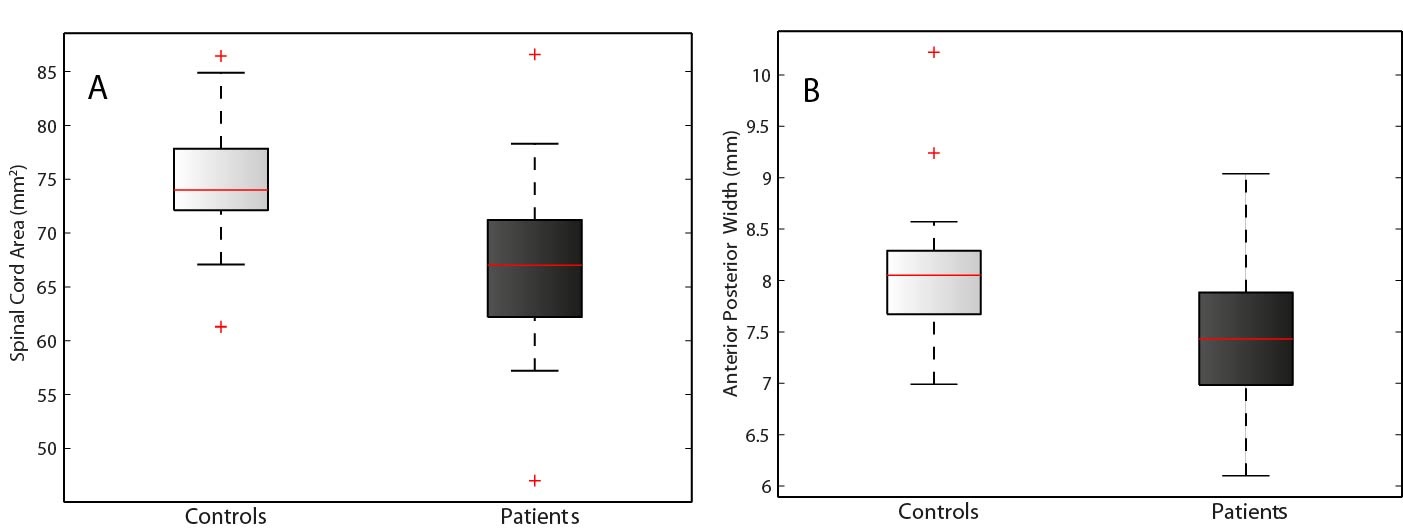
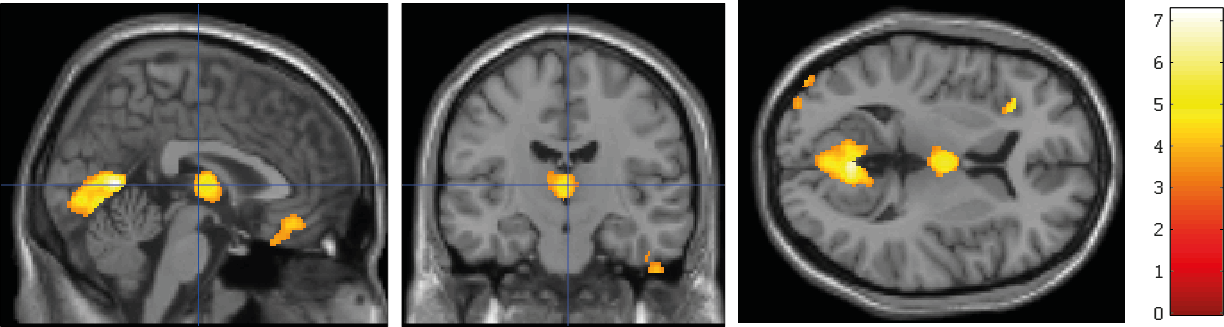
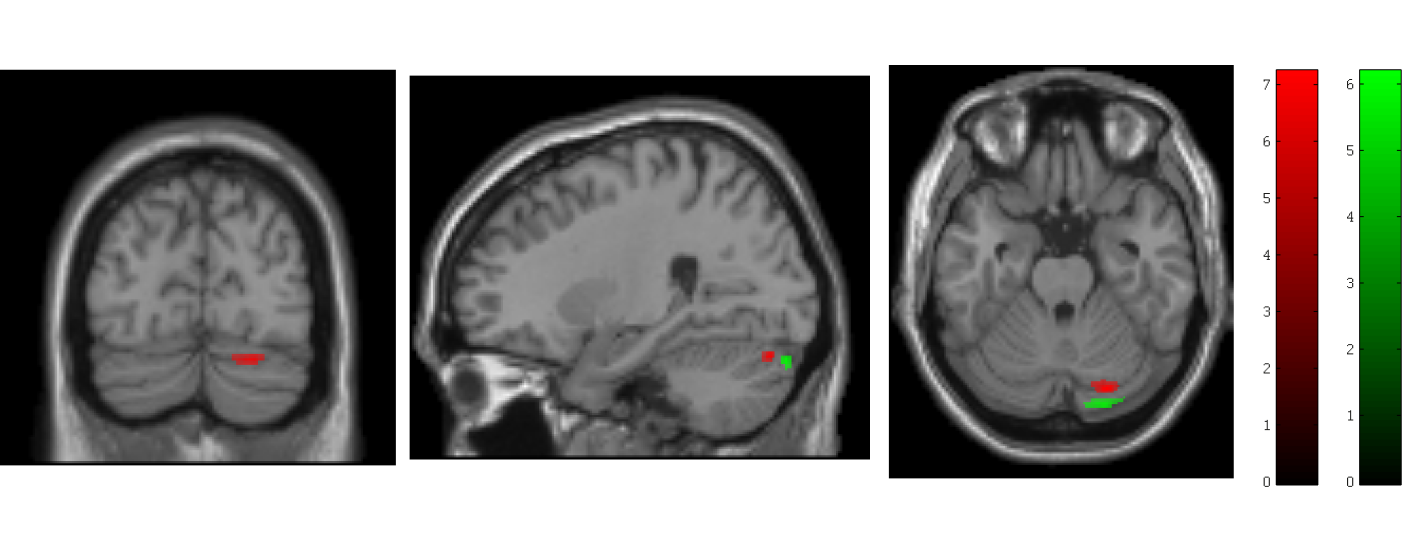
Cord area and APW were significantly lower in SCI patients compared to controls (p=0.004, p=0.005, respectively; Fig.1). However, the LRW was not significantly different compared to the control group. No microstructural cord changes were evident in patients compared to controls. At the brain level, VBM revealed significant GM reductions in the left anterior insula (Z=5.01, p=0.009), in the bilateral thalamus (Z=4.70, p=0.007), and in the bilateral lingual gyrus extending into the cerebellum (Z=5.83, p<0.001) (Fig.2). VBM of WM did not show significant changes in patients compared to controls. VBCT revealed thinner cortical thickness in the bilateral cerebellum and lingual gyrus (Z=4.53, p=0.009) as well as in the left precentral gyrus (Z=4.85, p=0.001). VBQ in the right cerebellum (in GM) revealed increased MT (Z=5.58, p=0.046) and increased R2* (Z=5.02, p=0.013) in patients compared to controls (Fig. 3). Using the ROI approach, we found a significant reduction in GM volume (p=0.007, Z=4.70) and a thinner cortical thickness (p=0.029, Z=3.53) in the sensorimotor cortices. No correlations were found between cord changes and clinical impairments. GM volume changes within the cerebellum correlated with lower motor score (p=0.001, Z=4.13). Reduced cortical thickness in the right leg motor area correlated with the lower motor score (p=0.029, Z=3.60).Discussion and Conclusion
Quantitative MRI techniques applied
at the early stage after SCI revealed atrophic changes within the cord and
brain. Crucially, in line with previous studies4, brain structural changes
related to sub-acute motor impairment. While microstructural changes were not
evident in the atrophied cord, the cerebellum showed early myelin increases and
iron accumulations in patients. The myelin elevation may be an indicator of
ongoing early atrophy and consequently increase of myelin concentration in the
early stage15.
In conclusion, this study showed that significant
atrophy and microstructural changes initiated in neural sensorimotor system already within
the early stage after SCI. Moreover, quantitative neuroimaging techniques
hold potential to disclosing these neurodegeneration mechanisms following
traumatic SCI.
Acknowledgements
This project has received funding from the European Union Horizon-2020 research #681094, the SRH Holding, Wings for Life, and the Clinical Research Priority Program “NeuroRehab” of the University of ZurichReferences
1. Freund P, Weiskopf N, Ashburner J, et al. MRI investigation of the sensorimotor cortex and the corticospinal tract after acute spinal cord injury: a prospective longitudinal study. Lancet Neurol 2013;12:873–881
2. Grabher P, Callaghan MF, Ashburner J, Weiskopf N, Thompson A J, Curt A, and Freund P, Tracking sensory system atrophy and outcome prediction in spinal cord injury.. Ann Neurol. 2015 Nov; 78(5): 751–761
3. Huber E, Curt A, Freund P. Tracking trauma-induced structural and functional changes above the level of spinal cord injury. Curr Opin Neurol 2015;28:365–372.
4. Brain sensorimotor system atrophy during the early stage of spinal cord injury in humans. Hou JM, Yan RB, Xiang ZM, Zhang H, Liu J, Wu YT, Zhao M, Pan QY, Song LH, Zhang W, Li HT, Liu HL, Sun TS. Neuroscience. 2014 Apr 25;266:208-15
5. Kirshblum SC, Waring W, Biering-Sorensen F, et al. Reference for the 2011 revision of the International Standards for Neurological Classification of Spinal Cord Injury. J Spinal Cord Med 2011;34:547–554
6. Helms G, Dathe H, Kallenberg K, Dechent P. High-resolution maps of magnetization transfer with inherent correction for RF inhomogeneity and T1 relaxation obtained from 3D FLASH MRI. Magn Reson Med 2008;60:1396–1407
7. Weiskopf N, Lutti A, Helms G, et al. Unified segmentation based correction of R1 brain maps for RF transmit field inhomogeneities (UNICORT). Neuroimage 2011;54:2116–2124.
8. Draganski B, Ashburner J, Hutton C, et al. Regional specificity of MRI contrast parameter changes in normal ageing revealed by voxel-based quantification (VBQ). Neuroimage 2011;55:1423–1434.
9. Weiskopf N1, Suckling J, Williams G, Correia MM, Inkster B, Tait R, Ooi C, Bullmore ET, Lutti A. Quantitative multi-parameter mapping of R1, PD(*), MT, and R2(*) at 3T: a multi-center validation. Front Neurosci. 2013 Jun 10;7:95
10. Ashburner J, Csernansky JG, Davatzikos C, Fox NC, Frisoni GB, Thompson PM. Computer-assisted imaging to assess brain structure in healthy and diseased brains. Lancet Neurol. 2003;2:79–88.
11. Hutton C, De VE, Ashburner J, Deichmann R, Turner R. Voxel-based cortical thickness measurements in MRI. Neuroimage. 2008;40:1701–10.
12. Friston KJ, Holmes AP, Worsley KJ, Poline JB, Frith CD, Frackowiak RSJ. Statistical parametric maps in functional imaging: a general linear approach. Hum Brain Mapp. 1995b;2:189–210
13. Ciccarelli O, Toosy AT, Marsden JF, Wheeler-Kingshott CM, Sahyoun C, Matthews PM, et al. Identifying brain regions for integrative sensorimotor processing with ankle movements. Exp Brain Res. 2005;166:31–42
14. Freund F, Weiskopf N, Ward N, Hutton C, Gall A, Ciccarelli O, Craggs M, Friston K, and Thompson AJ, Disability, atrophy and cortical reorganization following spinal cord injury, Brain. 2011 Jun; 134(6): 1610–1622
15. Buss A, Brook GA, Kakulas B, Martin D, Franzen R, Schoenen J, Noth J, Schmitt AB. Gradual loss of myelin and formation of an astrocytic scar during Wallerian degeneration in the human spinal cord. Brain. 2004 Jan;127(Pt 1):34-44. Epub 2003 Oct 8.
Figures