2379
Magnetic resonance spectroscopy demonstrates decreased glutamate in the anterior cingulate cortex in individuals with spinal cord injury1Department of Radiology, University of British Columbia, Vancouver, BC, Canada, 2International Collaboration on Repair Discoveries (ICORD), Vancouver, BC, Canada, 3Faculty of Medicine (Division of Neurology), University of British Columbia, Vancouver, BC, Canada, 4Faculty of Education (School of Kinesiology), University of British Columbia, Vancouver, BC, Canada, 5Department of Pathology & Laboratory Medicine, University of British Columbia
Synopsis
We investigated metabolites in the anterior cingulate cortex using magnetic resonance spectroscopy in individuals with spinal cord injury (SCI). Short-TE PRESS at 3T provided reliable fits for glutamate (Glu), N-Acetyl-aspartate (NAA), total creatine (tCr), myo-Inositol and total choline. SCI patients had 11.3 % less Glu. Given the role of Glu in synaptic transmission between neurons and also between neurons and oligodendrocytes, reduced Glu in SCI may reflect decreased synaptic density and activity due to a loss of sensory input in the anterior cingulate cortex. Further research investigating the effect of sensory input loss on metabolite concentrations in SCI is warranted.
Purpose:
To explore metabolic changes in the anterior cingulate cortex of people with spinal cord injury (SCI) compared to healthy controls using magnetic resonance spectroscopy (MRS).Background:
People with spinal cord injury show a variety of structural changes in the brain including a reduction in cortical thickness in the anterior cingulate cortex (ACC)1. The underlying mechanisms causing this cortical atrophy are still unclear, but are likely clinically relevant given that the ACC is vital to the regulation of physiological processes, such as blood pressure and heart rate, which are often compromised in people with SCI. MRS offers the possibility of investigating specific brain metabolites in the ACC including glutamate (Glu, the major excitatory neurotransmitter), N-Acetyl-aspartate (NAA, a marker for the interaction of neurons and oligodendrocytes2), total creatine (tCr = creatine + phosphocreatine, a source of energy), as well as myo-Inositol (Ins, marker of glial cells) and total choline (tCho, compounds containing choline, membrane building blocks), enabling examination of pathological changes in people living with SCI3.
Methods:
Subjects: Six people with spinal cord injury (3 males, 3 females, mean age=49 years, range: 33-64 years, injury severity according to American Spinal Injury Association (ASIA) guidelines: 4 complete (traumatic, ASIA A) and 2 incomplete (non-traumatic, ASIA D)) and eight age matched healthy controls (6 males, 2 females, mean age=43 years, range: 28-69 years) were recruited for our study.
MRI Experiments: MR data was acquired on a 3T Philips Achieva system (Best, The Netherlands) with a multi-channel SENSE head coil. T1 weighted images with isotropic resolution (1mm3) were acquired for tissue segmentation (TR/TE=7.8/3.5ms, FOV (ap/rl/fh)=256/200/170 mm). 1H-MRS was performed in the ACC (voxel dimensions = 3.0 × 2.5 × 1.5 cm³, Figure 1) with PRESS (TE/TR=30/4000ms, NSA=64) using second order shimming and chemical shift selective water suppression. An additional 16 non-water suppressed spectra were also acquired.
Data Analysis: Spectra were fit using LCModel4 (version 6.3), referencing metabolite concentrations to water. Tissue segmentation based on the T1-weighted scan was performed using FSL FAST5. The segmentation map for grey matter (GM), white matter (WM) and cerebrospinal fluid (CSF) was used for absolute quantification of metabolite concentrations, corrected for relaxation losses. Rejection of individual metabolite fits was based on the absolute error being greater than 30% of the median concentration6. The data was analysed using a Spearman’s rank correlation coefficient for correlations between tissue compartmentation and metabolite concentration (Spearman’s correlation is based on the ranked values for each variable rather than the raw data and does not make assumptions about the relationship being linear). Wilcoxon rank-sum tests were applied for comparison between the groups. Uncorrected p-values are reported.
Results:
Spectra with high signal/noise (median = 28, range = 20-34) and small linewidths (median = 4.2 Hz, range = 3.4-4.9 Hz) were acquired (Figure 2), resulting in reliable fits of Glu, NAA, tCr, Ins and tCho for the complete dataset. SCI subjects presented with significantly decreased grey matter fraction (fGM) (- 9.8 %, p = 0.013) and a trend for increased white matter fraction (fWM) (15.4%, p = 0.081) in the MRS voxel. SCI patients showed a 11.3% decrease in Glu (p = 0.008) relative to controls; no significant differences in NAA, tCr, Ins or tCho were observed between SCI subjects and controls (Figure 3). Patients and controls combined showed a significant correlation between fWM and Glu (ρ = -0.60, p = 0.03) as well as fWM and NAA (ρ = -0.60, p = 0.03). There was no significant correlation between fWM and tCr, Ins or tCho or fGM and any metabolites.
Discussion and Conclusion:
Our findings provide evidence of altered metabolism of the ACC in people with SCI. Previous studies have shown higher accumulations of Glu in GM compared to WM in the frontal cortex of healthy people7. This effect of voxel tissue composition can partially account for the decrease in Glu with increasing fWM, and aligns well with a smaller cortical thickness in individuals with SCI. However, other metabolites e.g. NAA and tCr, which also have higher concentrations in GM compared to WM, were not significantly different between individuals with SCI and controls in this study. Thus, underlying biochemical changes related to SCI likely also contribute to the observed reduction in Glu. Given the role of Glu in synaptic transmission between neurons and also between neurons and oligodendrocytes8, reduced Glu in individuals with SCI may reflect decreased synaptic density and activity in both WM and GM due to a loss of sensory input in the ACC. Further research investigating the effect of loss of sensory input on metabolite concentrations in SCI is warranted.
Acknowledgements
We would like to thank the University of British Columbia MRI Research Centre, the International Collaboration for Repair Discoveries (ICORD) as well as patients with spinal cord injury and volunteers who participated in the study.
This study was funded by an ICORD Seed Grant supported through the Rick Hansen Foundation.References
1. Jutzeler CR, Huber E, Callaghan MF, et al. Association of pain and CNS structural changes after spinal cord injury. Sci Rep. 2016;6:18534.
2. Nordengen K, Heuser C, Rinholm JE, et al. Localisation of N-acetylaspartate in oligodendrocytes/myelin. Brain Struct Funct. 2015;2(220):899-917.
3. de Graaf RA. In Vivo NMR Spectroscopy: Principles and Techniques. 2nd ed. Hoboken, NJ: John Wiley & Sons; 2007.
4. Provencher S. Estimation of metabolite concentrations from localized in vivo proton NMR spectra. Magn Reson Med. 1993;30(6):672-679.
5. Zhang Y, Brady M, Smith S. Segmentation of brain MR images through a hidden Markov random field model and the expectation-maximization algorithm. IEEE Trans Med Imaging. 2001;20(1):45-57.
6. Kreis R. The trouble with quality filtering based on relative Cramér-Rao lower bounds. Magn Reson Med. 2016;75(1):15-18.
7. Choi C, Coupland NJ, Bhardwaj PP, et al. T2 measurement and quantification of glutamate in human brain in vivo. Magn Reson Med. 2006;56(5):971-977.
8. Micu I, Plemel JR, Lachance C et al. The molecular physiology of the axo-myelinic synapse. Exp Neurol. 2016;276:41-50.
Figures
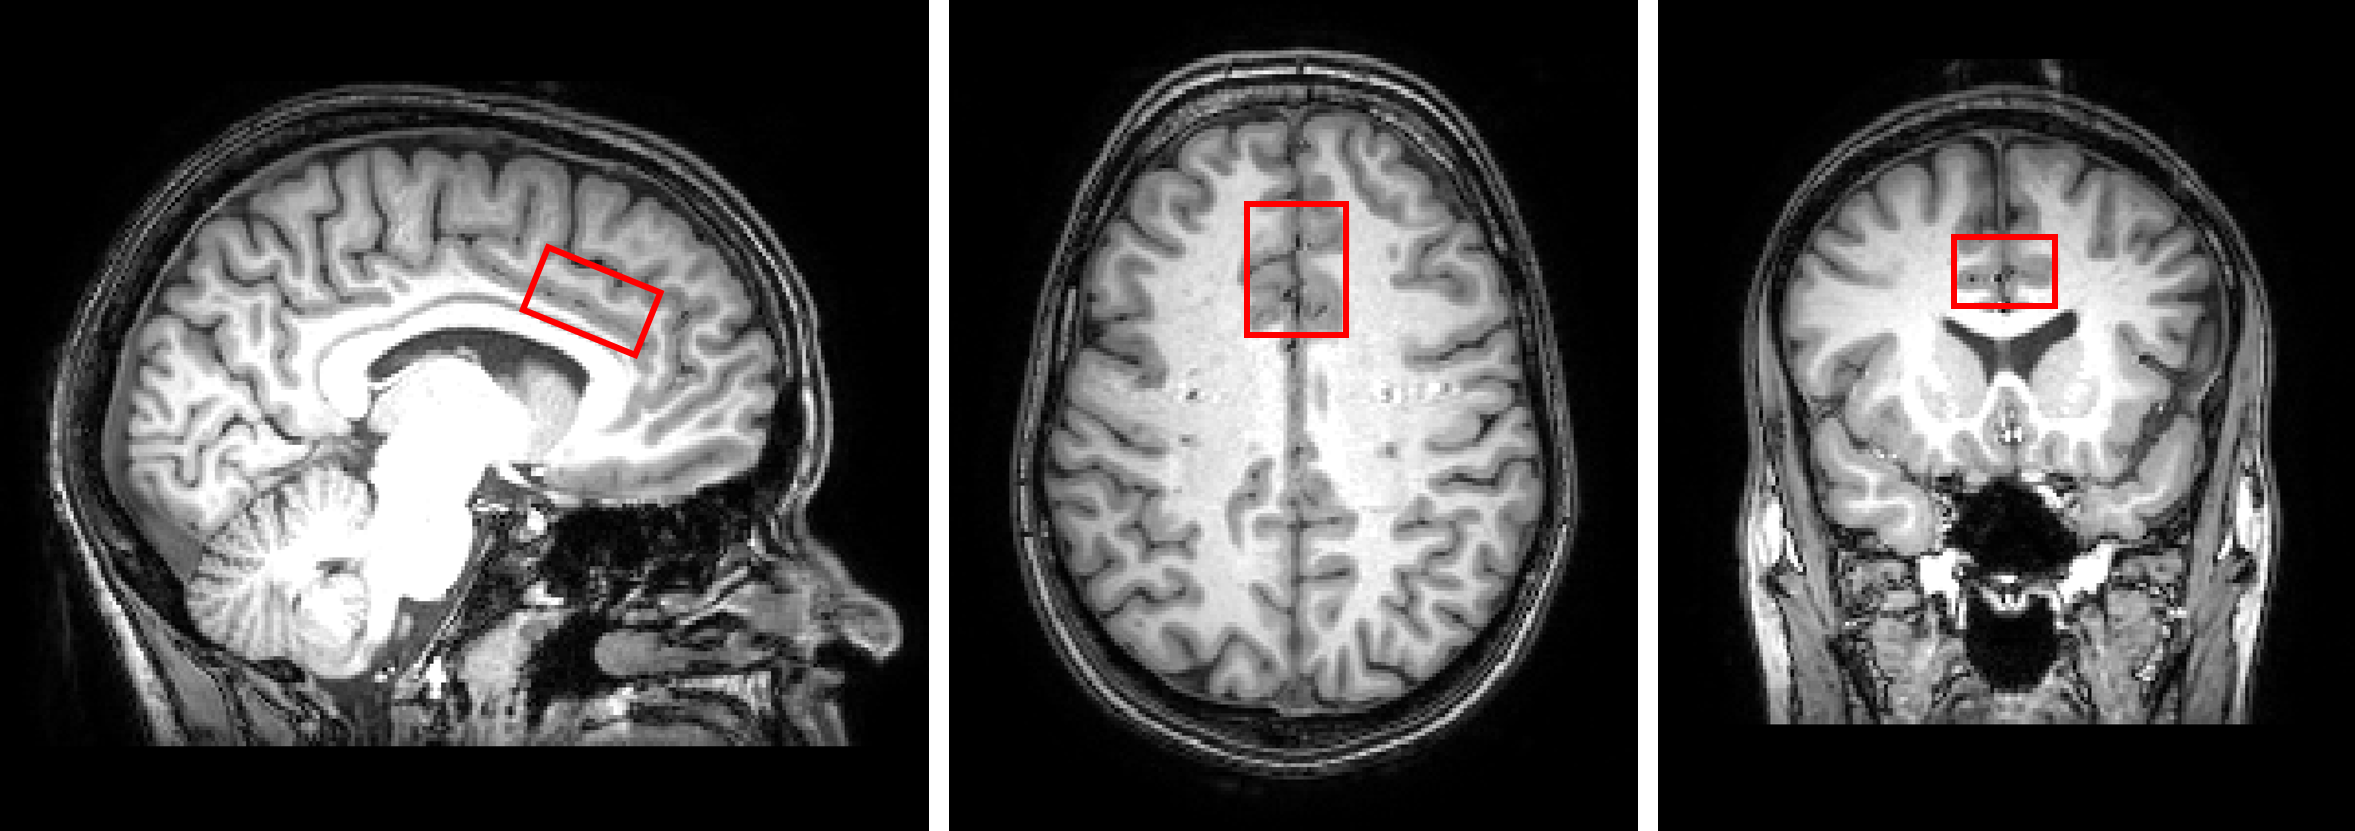
Figure 1: Voxel placement
Sample placement of the voxel (anterior-posterior × right-left × foot-head =3.0 × 2.5 × 1.5 cm³) in the anterior cingulate cortex (ACC)
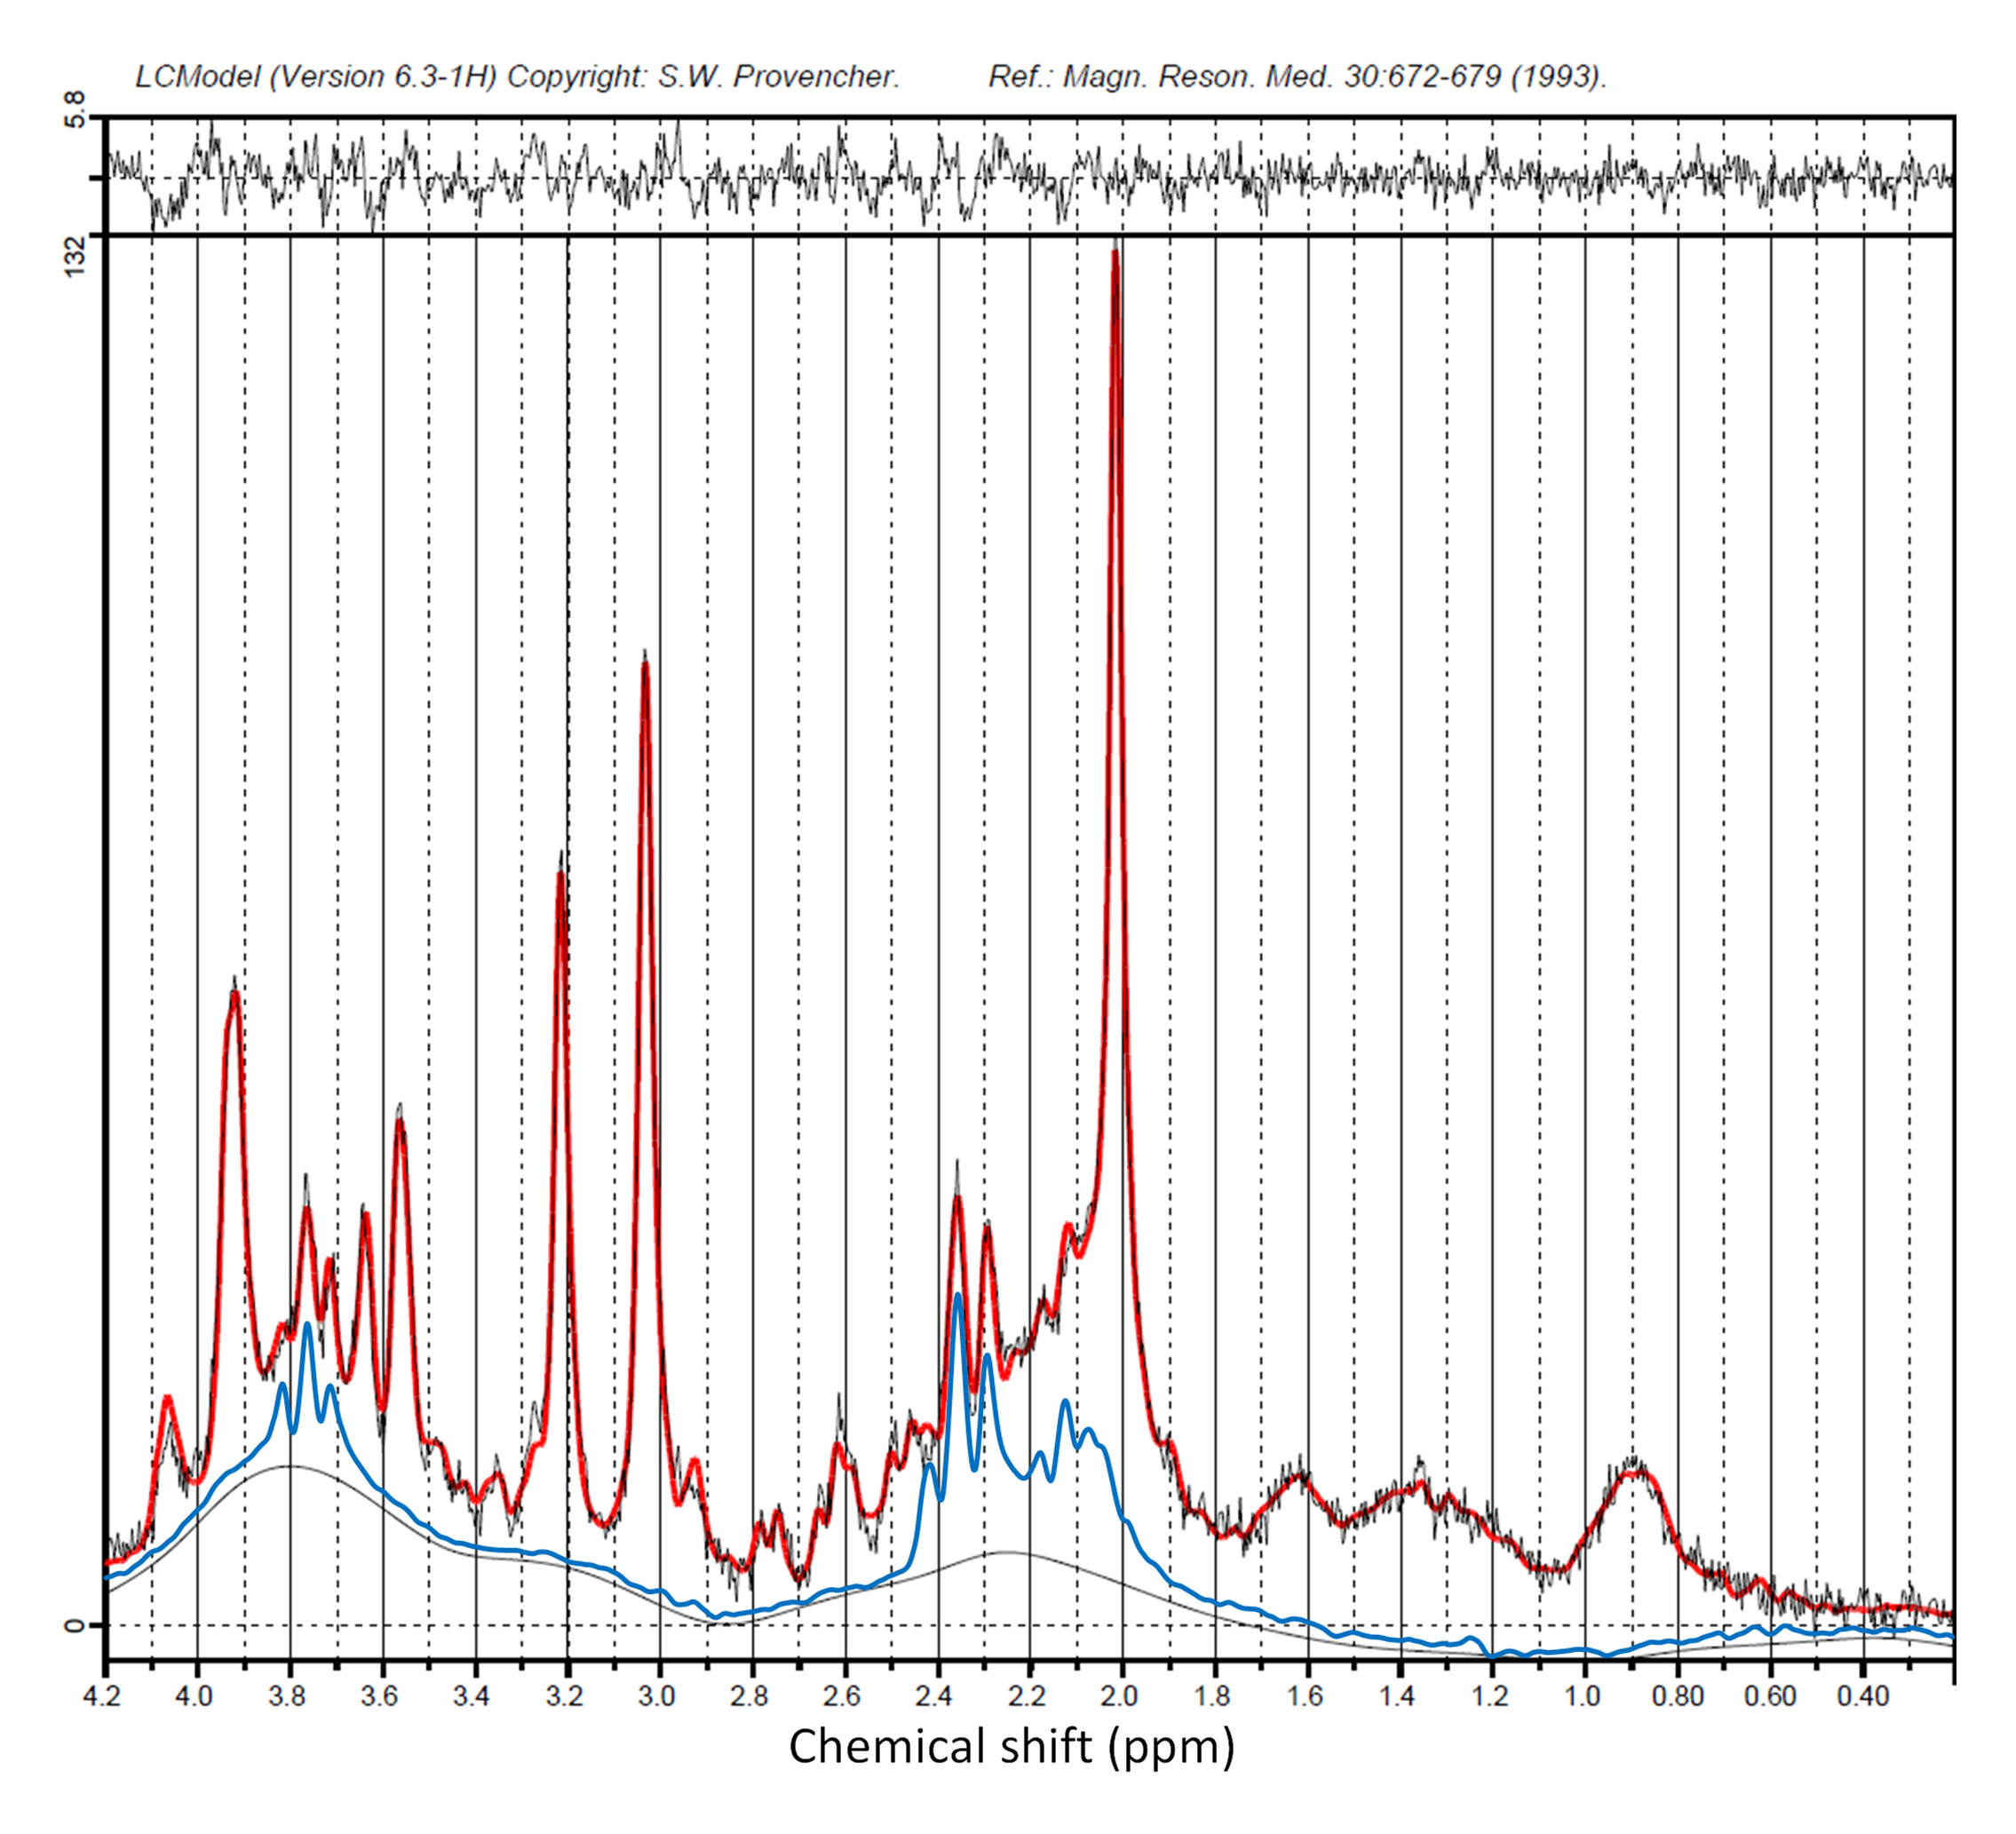
Figure 2: Sample spectrum
LCModel fit of acquired spectrum in red (signal/noise = 34, FWHM = 3.4 Hz). Glu (blue fit) was reliably identified for each of the acquired spectra.
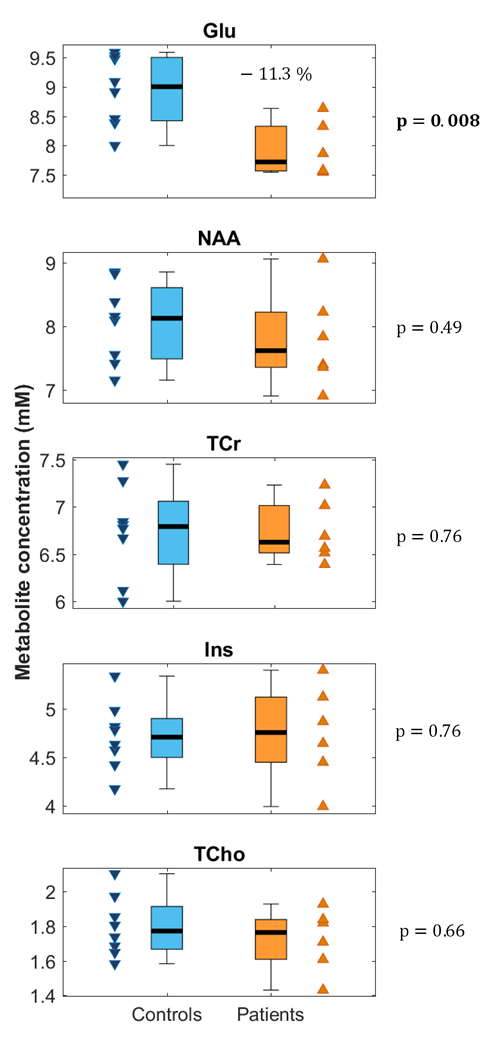
Figure 3: Diferences in metabolite concentrations between groups
Boxplots showing differences between healthy controls (blue) and patients (orange) for metabolites of interest. Glu was decreased by 11.3% (p = 0.008) . No significant differences between controls and patients for NAA, tCr, Ins or tCho were observed.