2378
Extraction of Both Dynamic Functional and Structural Connectivity from Resting-state fMRI for MCI Classification1Department of Radiology and BRIC, University of North Carolina at Chapel Hill, CHAPEL HILL, NC, United States
Synopsis
In this abstract, we show that the diagnosis accuracy of mild cognitive impairment (MCI) can be significantly improved by integrating dynamic information contained in the traditional functional connectivity (FC) from grey matter (GM) regions and the functional correlation tensors (FCT) from white matter (WM) regions, both computed from resting-state fMRI (RS-fMRI). The advantages of our method include: 1) dynamic FC is exploited to reveal rich time-varying information in FC, and 2) the anatomical structure information within WM can be well incorporated in RS-fMRI.
Purpose
Brain functional connectivity1 (FC) built from resting-state fMRI (RS-fMRI) data has become a popular approach for the diagnosis of various neurodegenerative diseases. Current studies mainly construct FC between grey matter (GM) regions of the brain, based on the temporal changes of blood oxygenation level dependent (BOLD) signals related to neural activities. But it has not been addressed whether the structural connectivity constructed within white matter (WM) can also provide useful information for diagnosis2. Therefore, we propose a novel MCI diagnosis method based on the information conveyed by both the FC between GM regions and also the structural connectivity within the WM regions, using on the same RS-fMRI.Method
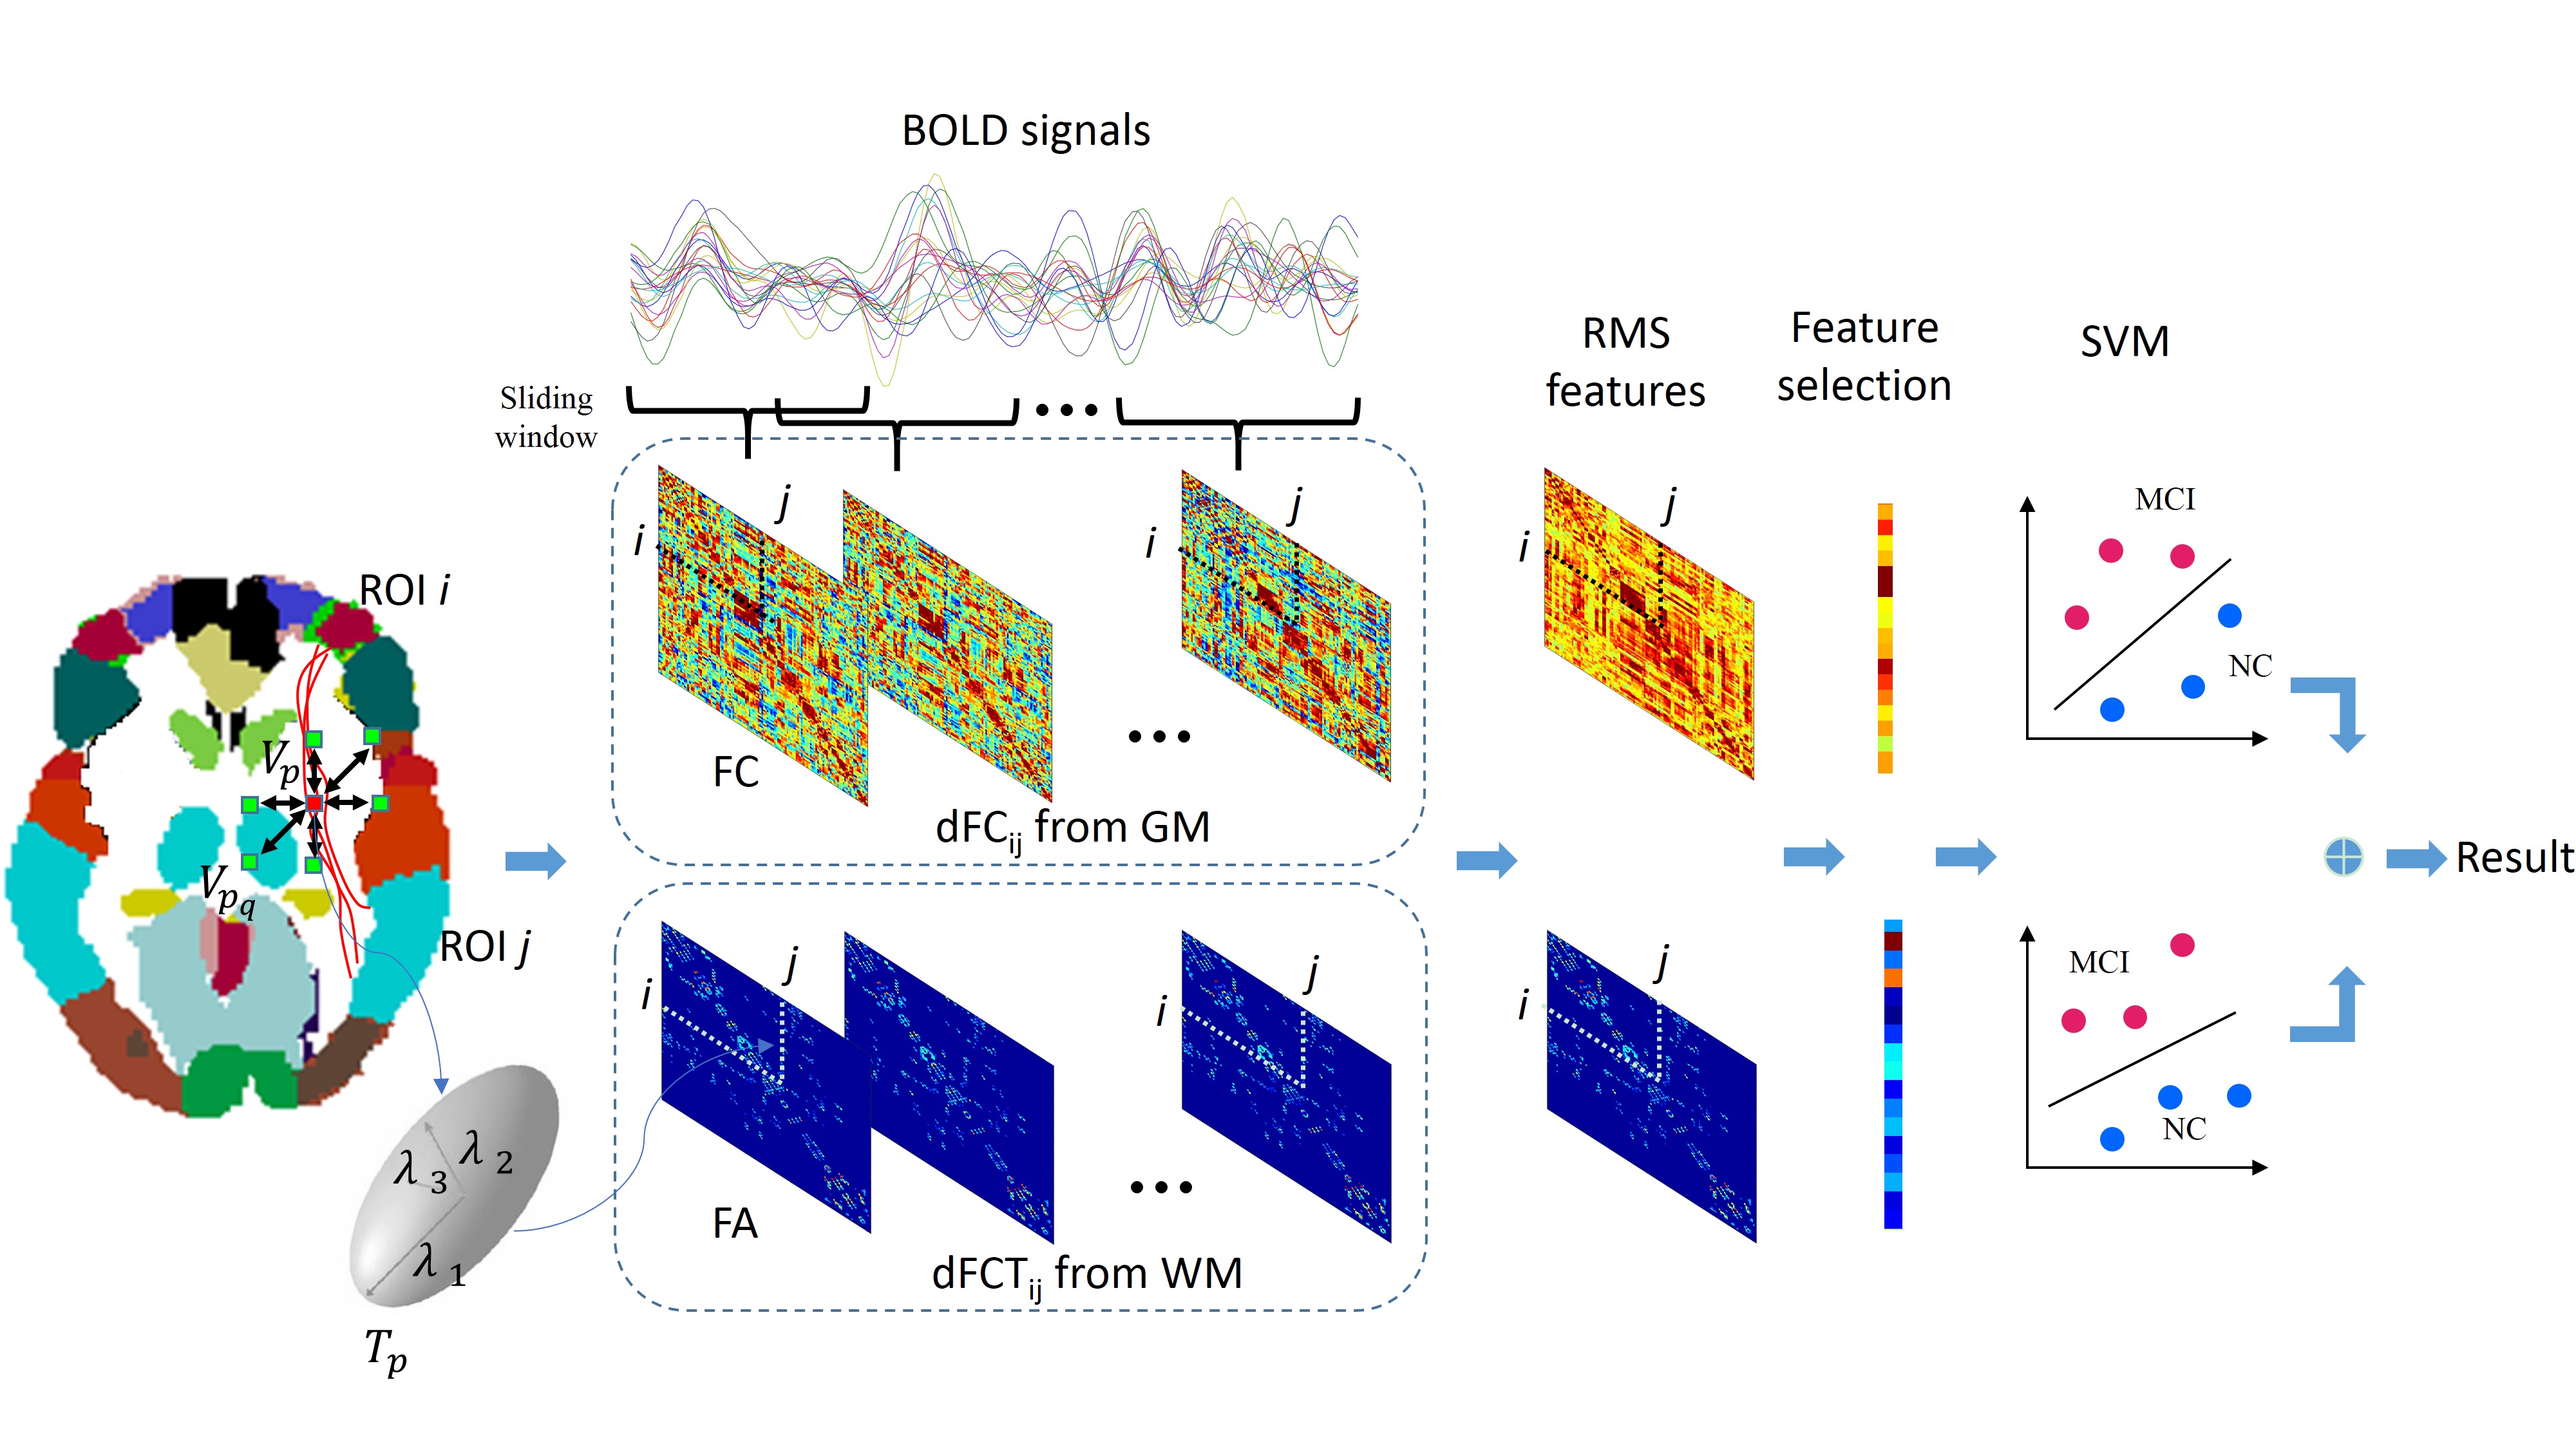
To measure connectivity within WM, we generate WM atlas, within which we can calculate pair-wise connectivity based on specific fiber tracts. These atlas or major fiber probability templates are constructed using DTI images of 60 subjects selected from Human Connectome Project (HCP) dataset. After preprocessing DTI data using FSL, dtifit function in FSL was used to calculate tensor for each voxel. PANDA was then used to generate whole brain tractography within the brain tissue using FACT algorithm. For the two ROIs connected by more than 200 streamlines, their respective template is constructed. Finally, a total of 359 (ROI-pair) templates are obtained. The flowchart of our method is shown in Figure 1. The RS-fMRI image of each subject is parcellated into 116 ROIs using Automated Anatomical Labeling (AAL) atlas. To characterize the dynamic variation, the RS-fMRI BOLD signal is partitioned into multiple overlapping segments with a sliding window approach3,4. On each segment, within GM areas, the regional mean BOLD signal can be calculated for each ROI, and dynamic FC (dFC) between ROIs is calculated following Pearson’s correlation coefficients. Similarly, on each time segment, for the voxels in WM, the functional connectivity tensor5 (FCT) is constructed and then the corresponding fractional anisotropy (FA) value is calculated, which summarizes local anisotropy of temporal correlations. These voxel-wise FA values are aggregated by weighted average according to the WM atlas. In such a way, it generates dynamic FCT (dFCT) representing temporal variation of overall anisotropy of local FC in the WM tracts linking the two GM ROIs. We treat both dFC and dFCT as discrete signals extracted from different pairs of ROIs. To extract features from these signals, the root-mean-square (RMS) is calculated for each signal, which defines a statistics to measure the magnitude of varying quantity. For each subject, the number of RMS features generated for dFC is 6670, and for dFCT is 359. A two-stage feature selection is then developed. In the first stage, a two-sample paired t-test is performed to remove irrelevant features. In the second stage, LASSO6 regression is used to eliminate redundant features. The remaining features from dFC and dFCT are respectively utilized to train two support vector machine classifiers, which are further integrated through weighted averaging to give the final diagnosis result.Results
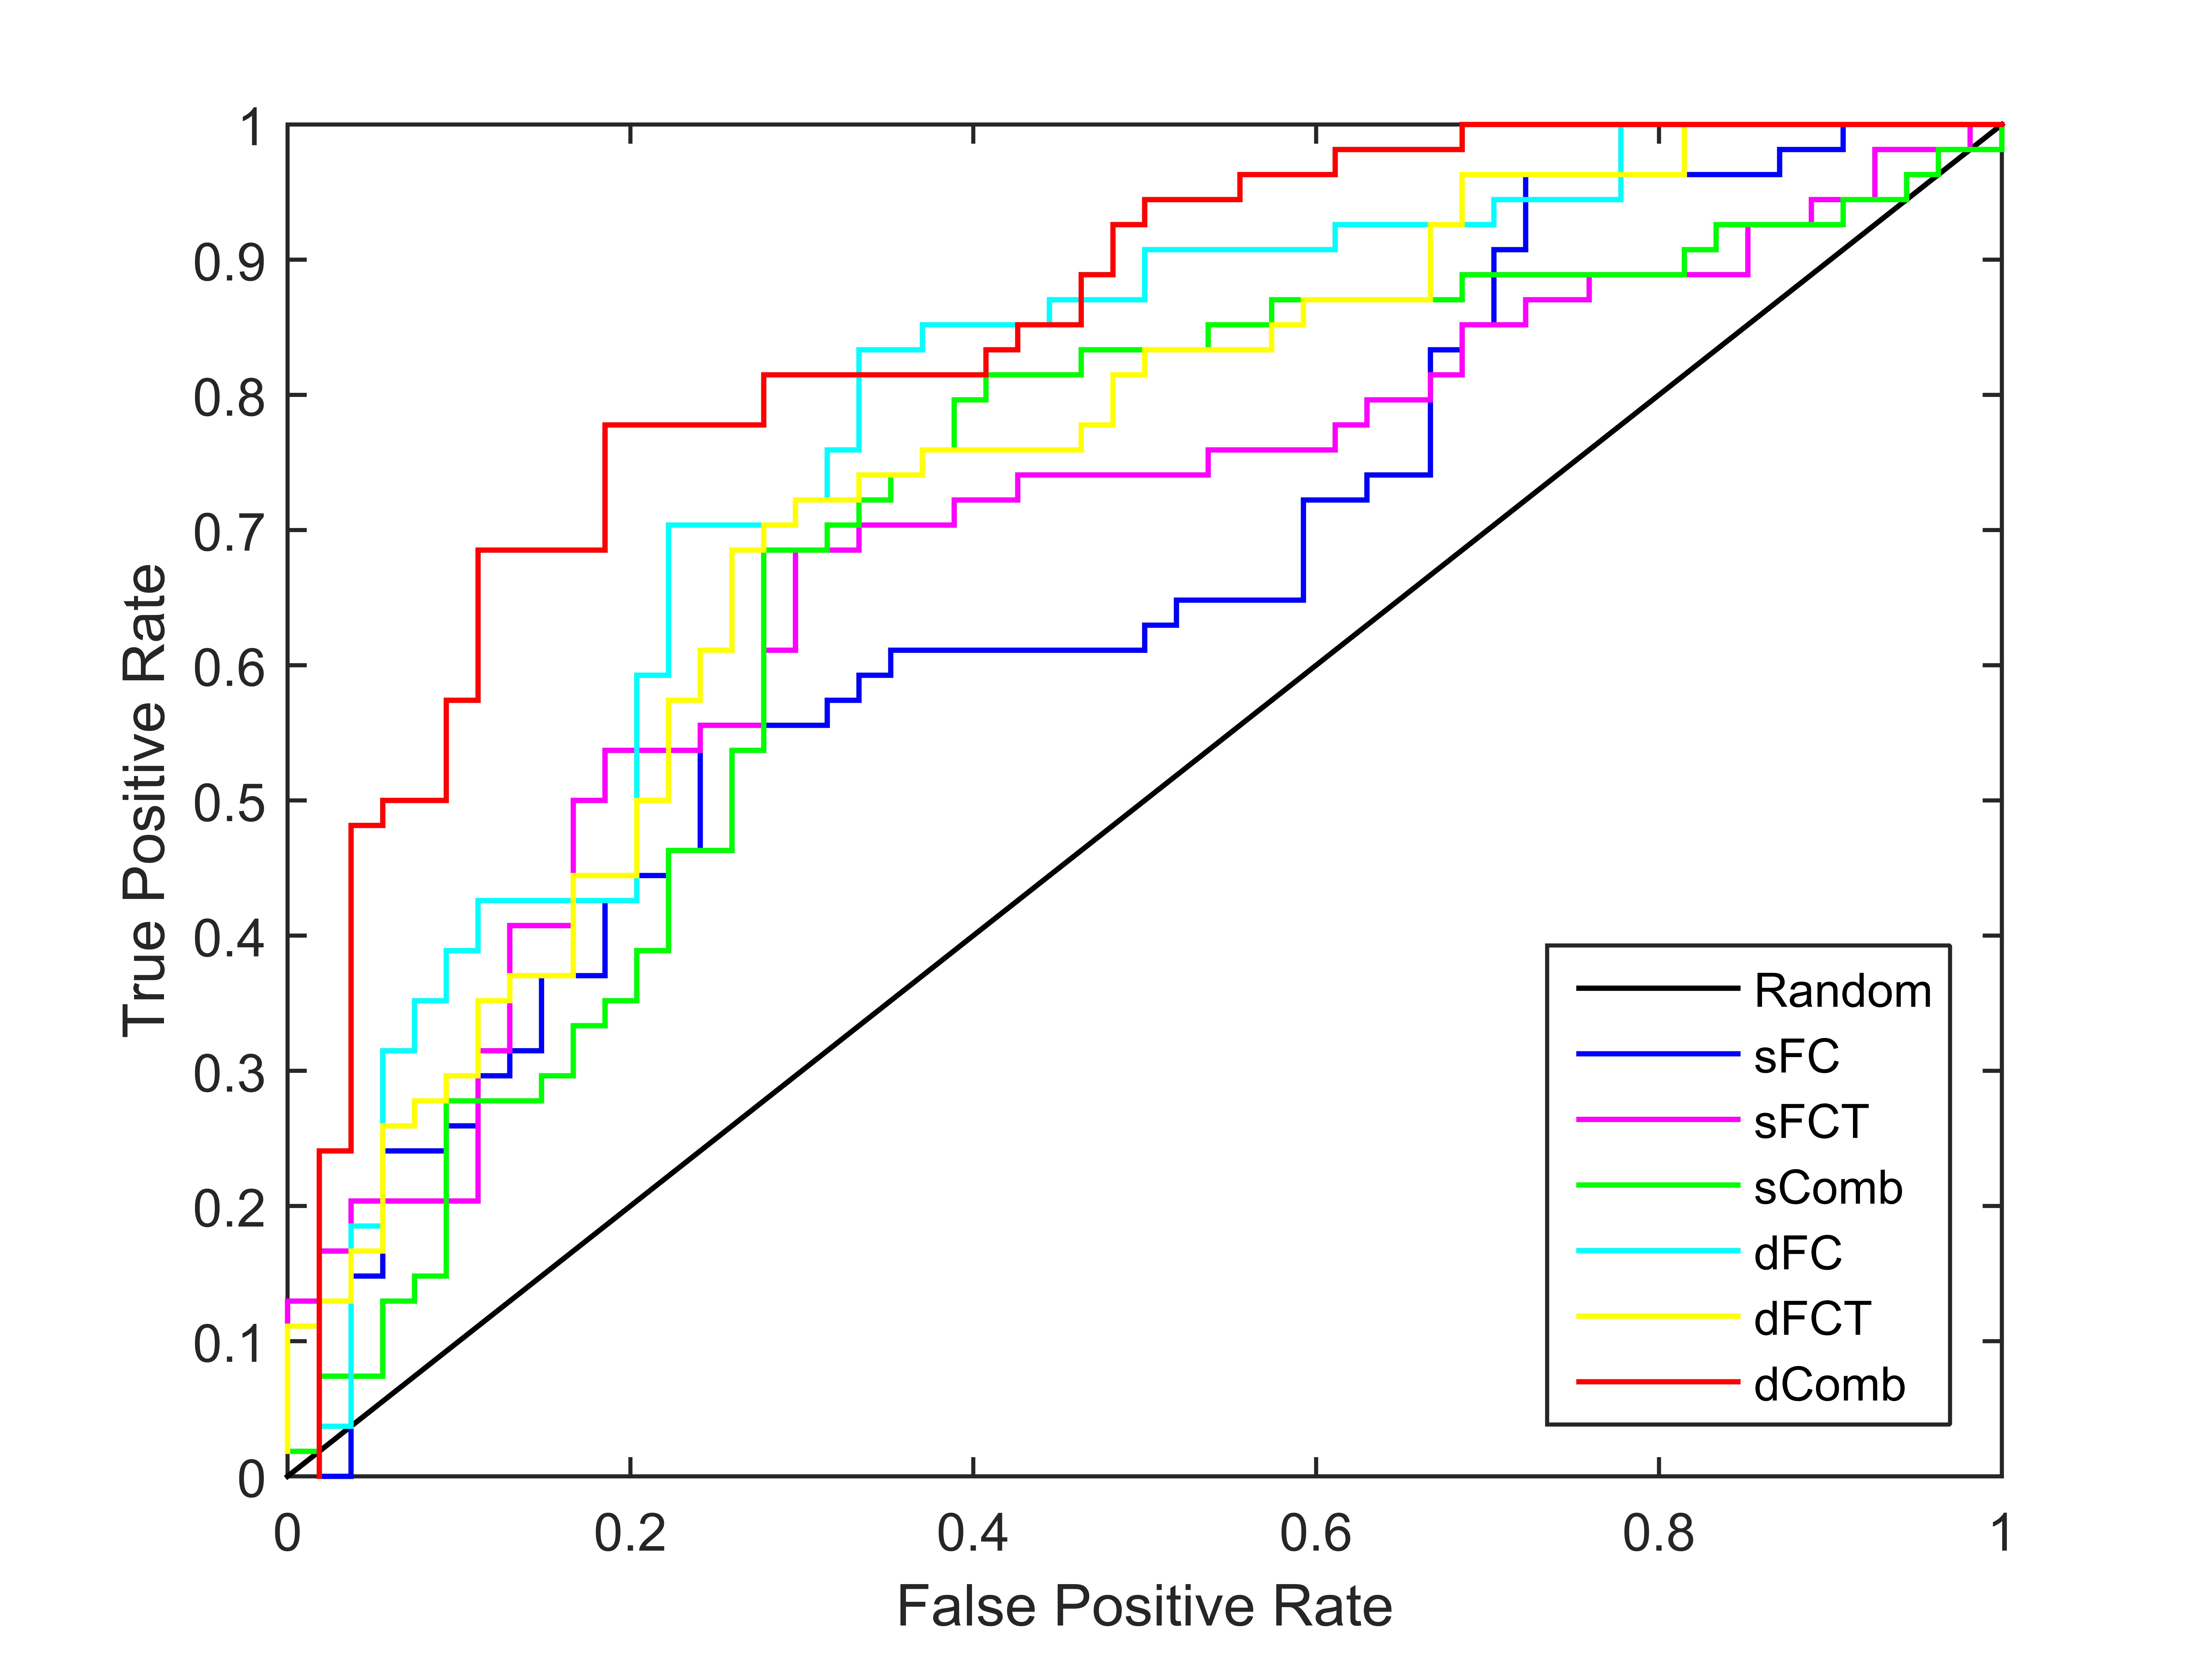
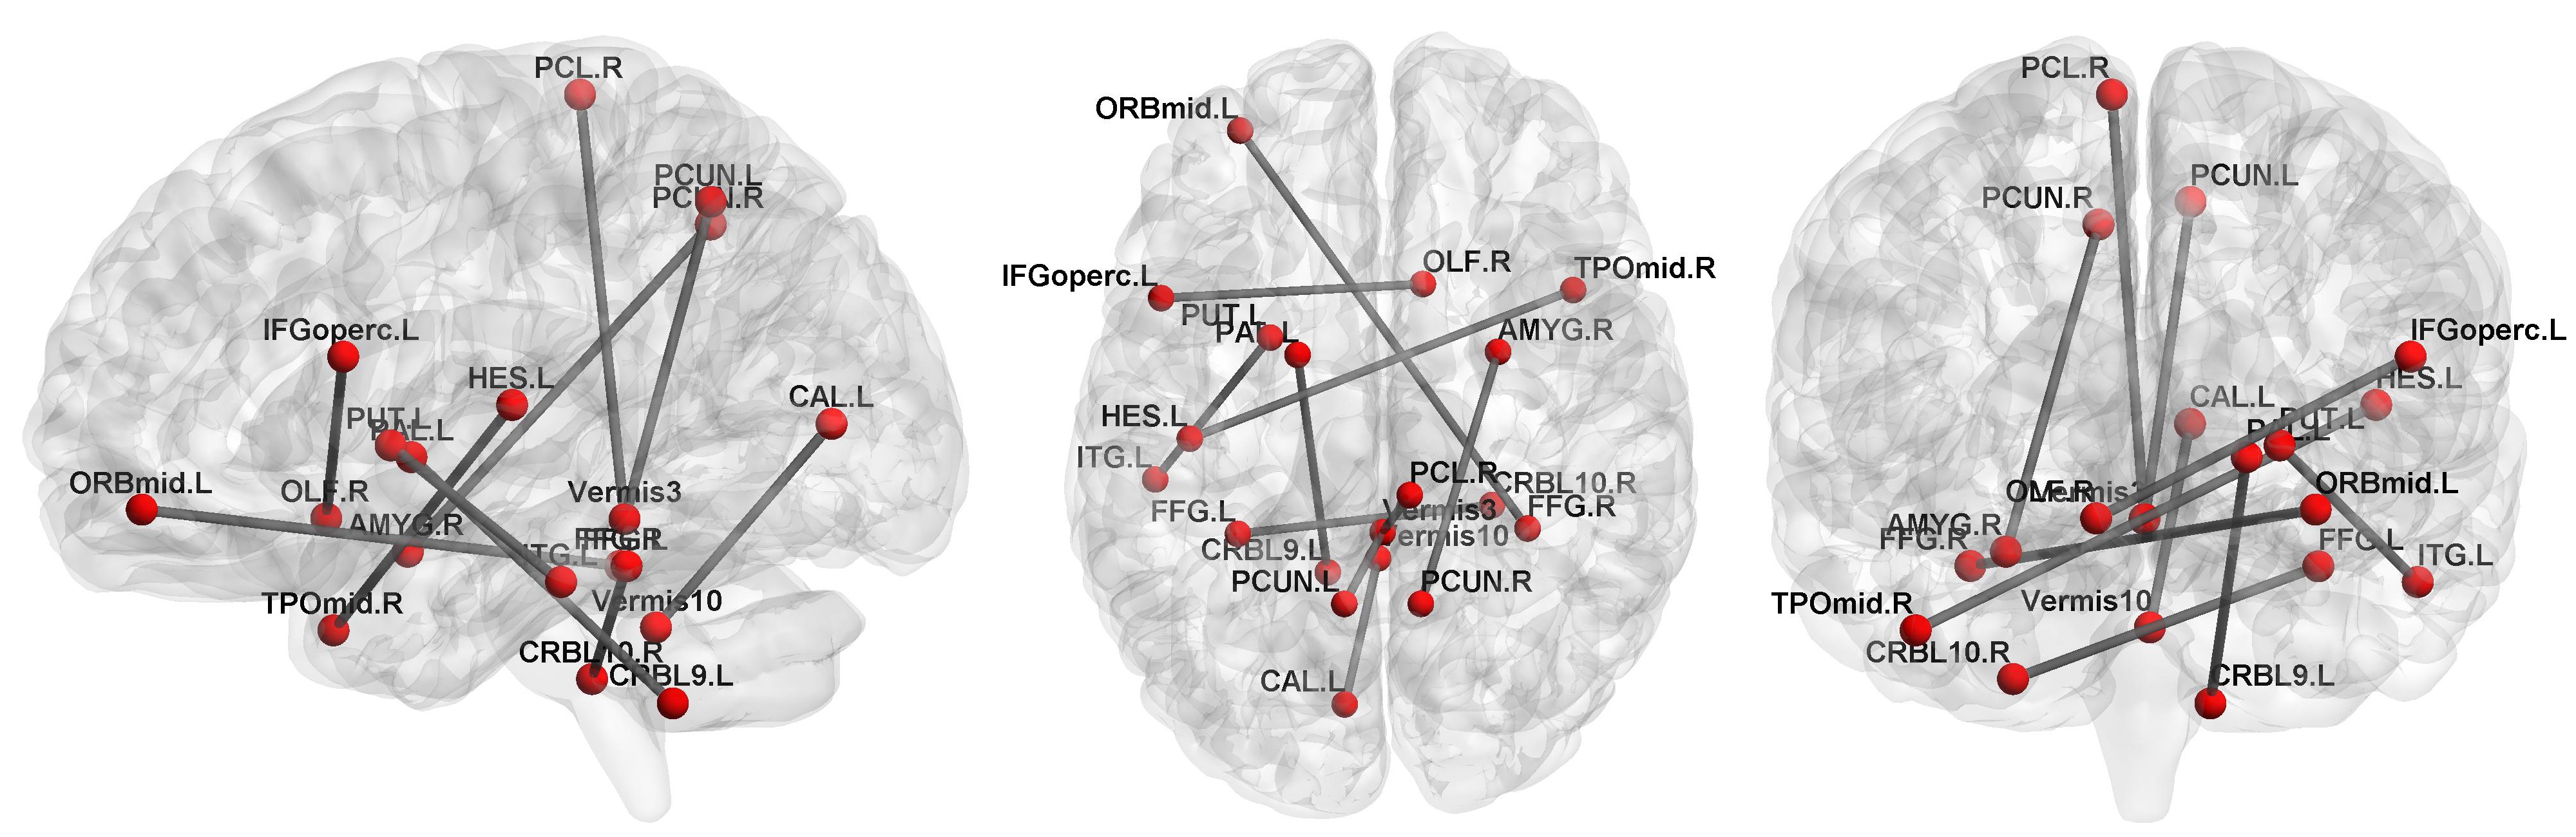
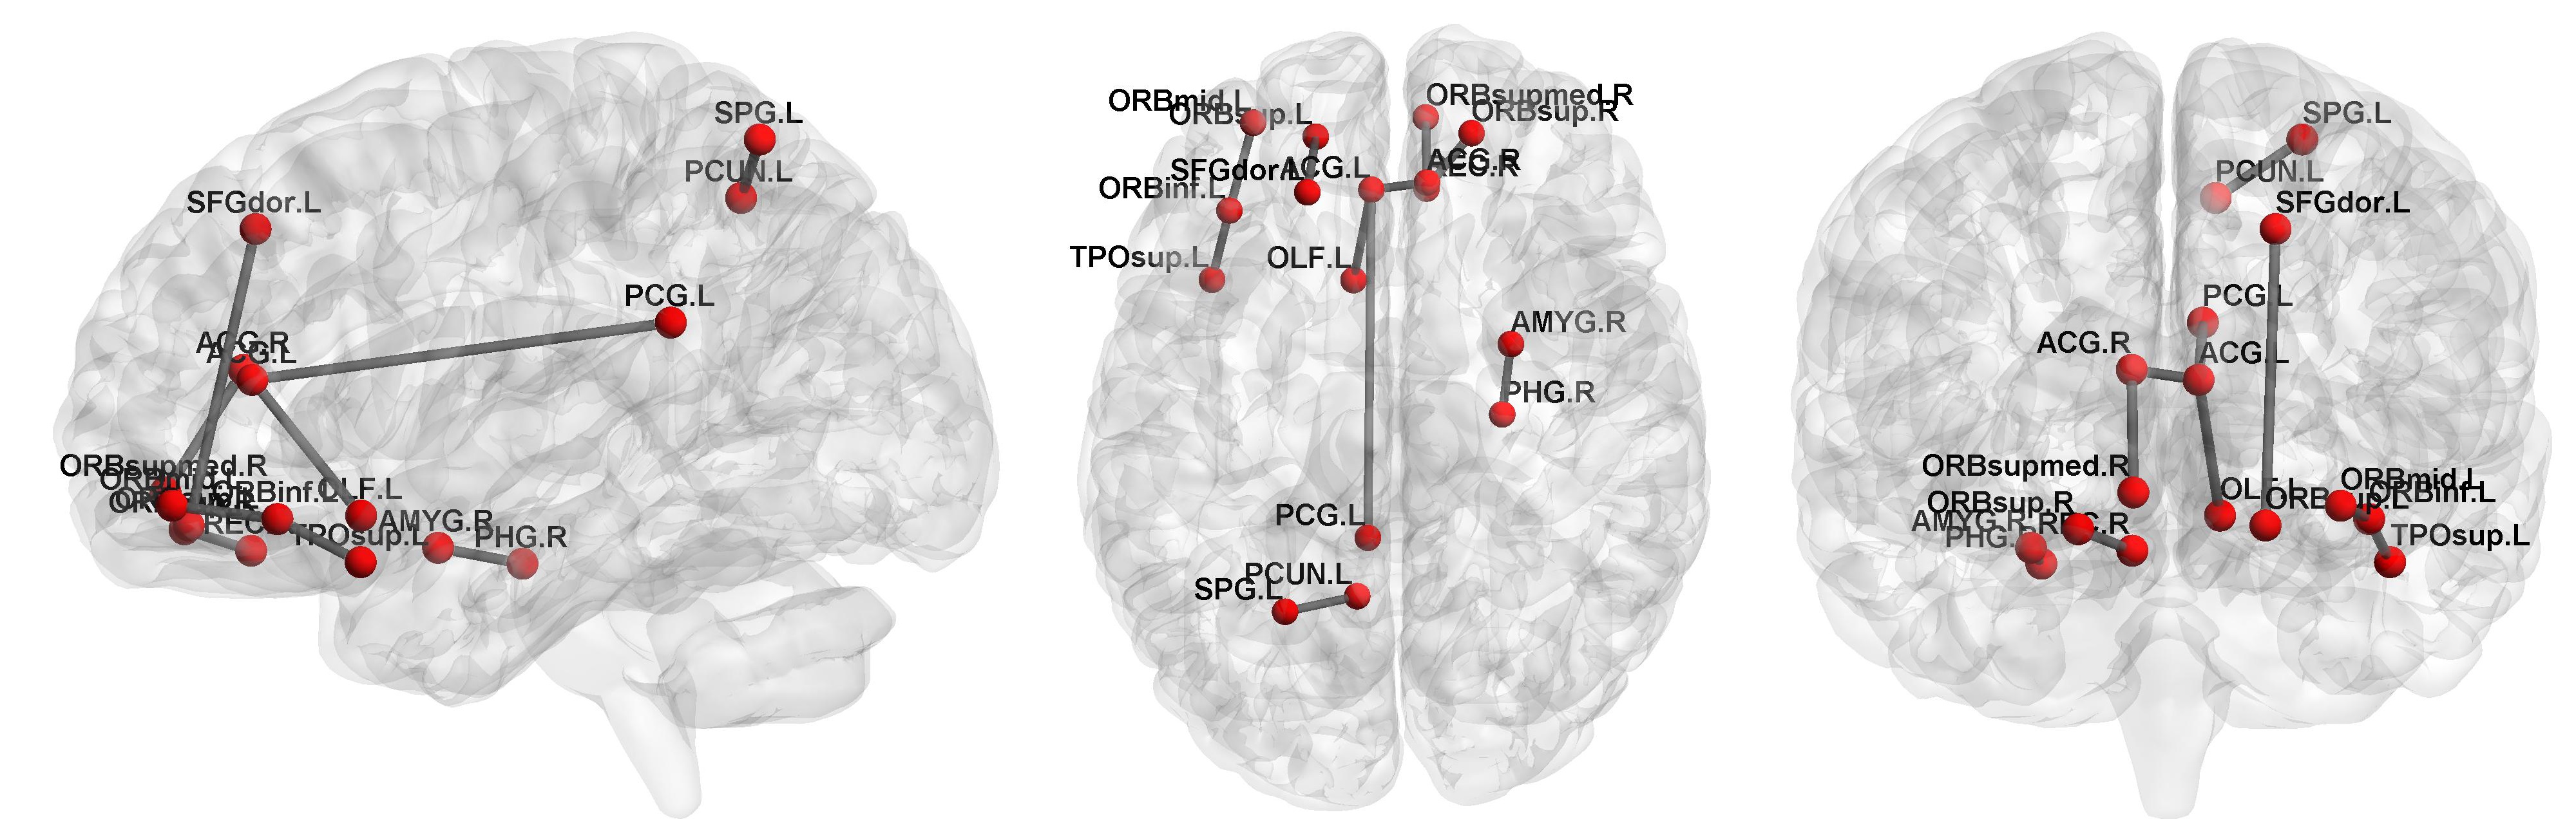
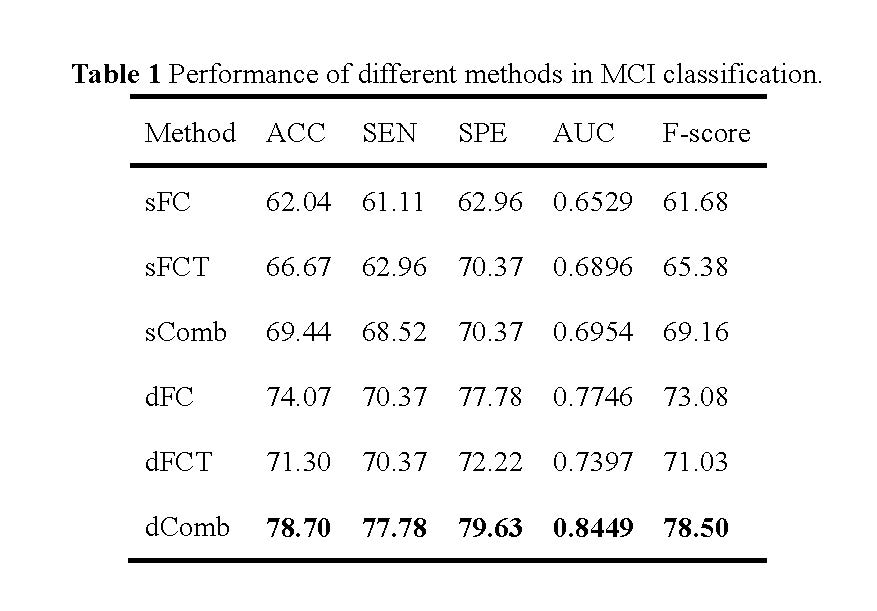
Totally, 54 MCI patients and 54 normal controls (NC), which were age- and gender-matched, from Alzheimer’s Disease Neuroimaging Initiative (ADNI) database are used in our experiments. SPM8 software package was applied to preprocess the RS-fMRI data. We compare static FC (sFC), static FCT (sFCT), their combination sComb, dFC, dFCT, and their combination (dComb). Leave-one-out cross-validation is used to evaluate different methods. The accuracy (ACC), sensitivity (SEN), specificity (SPE), area under ROC curve (AUC), and F-score are measured. The results are summarized in Table 1. Figure 2 plots the ROC curves for different methods. Note that in static cases, FCT achieves higher accuracy than FC, while in dynamic cases, FC outperforms FCT. In either static or dynamic case, the combined methods achieve better performance, and dComb performs best because it not only uses dynamic FC information but also exploits the FC in both GM and WM. Figures 3 and 4 show some most frequently selected connections as well as the associated ROI pairs, from dFC and dFCT, respectively. We can see that the connections selected from dFC and dFCT are generally different. The former is more consistent with anatomical organization in the human brain, while the latter shows widespread FC. Nevertheless, these selected connections are mostly consistent with existing studies7.Conclusions
This study presents a novel approach for automatic MCI diagnosis by integrating dynamic FC information extracted from both GM and WM regions, based on RS-fMRI data. Experimental results verify that the RS-fMRI BOLD signals observed within WM can provide complementary information for MCI classification.Acknowledgements
The work is supported by funding from National Institutes of Health (EB008374 and EB009634) and National Natural Science Foundation of China (Grand No: 61203244).References
1. Rubinov, M., Sporns, O. (2010) Complex network measures of brain connectivity: uses and interpretations. Neuroimage, 52:1059-1069.
2. Wee, C.-Y., Yap, P.-T., Li, W., Denny, K., Browndyke, J.N., Potter, G.G., Welsh-Bohmer, K.A., Wang, L., Shen, D. (2011) Enriched white matter connectivity networks for accurate identification of MCI patients. Neuroimage, 54:1812-1822.
3. Chen, X., Zhang, H., Gao, Y., Wee, C.Y., Li, G., Shen, D. (2016) High-order resting-state functional connectivity network for MCI classification. Human brain mapping, 37(9):3282-96
4. Wee, C.-Y., Yang, S., Yap, P.-T., Shen, D., Initiative, A.s.D.N. (2015) Sparse temporally dynamic resting-state functional connectivity networks for early MCI identification. Brain Imaging and Behavior, 10(2): 342–356.
5. Ding, Z., Xu, R., Bailey, S.K., Wu, T.-L., Morgan, V.L., Cutting, L.E., Anderson, A.W., Gore, J.C. (2016) Visualizing functional pathways in the human brain using correlation tensors and magnetic resonance imaging. Magnetic resonance imaging, 34:8-17.
6. Tibshirani, R. (1996) Regression shrinkage and selection via the lasso. Journal of the Royal Statistical Society. Series B (Methodological):267-288.
7. Adriaanse, S.M., Binnewijzend, M.A., Ossenkoppele, R., Tijms, B.M., van der Flier, W.M., Koene, T., Smits, L.L., Wink, A.M., Scheltens, P., van Berckel, B.N. (2014) Widespread disruption of functional brain organization in early-onset Alzheimer’s disease. PloS one, 9:e102995.
Figures