2377
What Happens to the Hippocampus 12-months After Training? A Longitudinal Linear Mixed Effects Model Analysis of Mild Cognitive Impairment in the SMART Trial1Regenerative Neuroscience Group, Brain and Mind Centre, Sydney, Australia, 2Brain and Mental Health Laboratory, Monash Institute of Cognitive and Clinical Neuroscience, Monash University, Sydney, Australia, 3School of Psychiatry, University of New South Wales, Sydney, 4Centre for Healthy Brain Ageing, School of Psychiatry, University of New South Wales, Sydney, 5Exercise Health and Performance Faculty Research Group, Faculty of Health Sciences and Sydney Medical School, The University of Sydney, 6Hebrew SeniorLife and Jean Mayer USDA Human Nutrition Research Center on Aging at Tufts University, Boston, 7Neuropsychiatric Institute, Prince of Wales Hospital, Sydney, NSW, Australia, 8Dementia Collaborative Research Centre, University of New South Wales, Sydney, NSW, Australia, 9Exercise Health and Performance Faculty Research Group, Faculty of Health Sciences, The University of Sydney, Lidcombe, NSW, Australia., 10Department of Psychiatry, School of Medicine, University of Adelaide, Adelaide, SA, Australia, 11School of Exercise Science, Australian Catholic University, Strathfield, NSW, Australia., 12Clinical and Rehabilitation Research Group, Faculty of Health Sciences, The University of Sydney, Lidcombe, NSW, Australia., 13Department of Medicine and the Diabetes Center, University of California, San Francisco, San Francisco, CA, USA, 14School of Medical Sciences, Sydney Medical School, University of Sydney, Sydney, NSW, Australia.
Synopsis
Mild cognitive impairment (MCI) increases future risk of dementia, however, several studies have shown that mental and physical exercise reduce this risk. From the Study of Mental Activity and Resistance Training (SMART) we have previously shown significantly improved global cognitive function immediately after 6 months of progressive resistance training in MCI. In this analysis, we compare longitudinal hippocampal volume change in MCI using linear mixed effects models over an 18-month period comprised of a 6-month training phase and a 12-month post training follow-up. Our results show both isolated cognitive and progressive resistance training significantly diminished the rate of left hippocampal atrophy compared to a double sham intervention across training and an extended follow-up period.
Introduction
Mild cognitive impairment (MCI) increases future risk of dementia, however, several studies have shown that mental and physical exercise reduce this risk1. The Study of Mental Activity and Resistance Training (SMART)1 is a longitudinal randomised controlled trial that compared the benefits of isolated and combined progressive resistance training and computerised cognitive training in MCI. Previously, we found significantly enhanced functional connectivity between the hippocampus and superior frontal cortex associated with cognitive training, however, no significant group x time interaction was found on hippocampal volume between groups over the 6 months training. In this analysis, we investigate for the first time the ongoing impact of training 12 months after cessation, with a particular interest in hippocampal atrophy using a linear mixed effects (LME) model.Aim
To compare longitudinal hippocampal volume change in MCI in a LME model over an 18-month period comprised of a 6-month training phase and a 12-month post training follow-up.Methods
The SMART trial is a double-blind, double sham-controlled clinical trial (the full protocol and study design have been published previously3). Community-dwelling participants aged ≥55 diagnosed with MCI (Petersen criteria4) were recruited in accordance with ethical standards. After baseline (BL) cognitive and MRI assessments, subjects were randomised into 4 training groups; 1 - Combined computerised cognitive and progressive resistance training (CT+PRT), 2 - PRT and Sham CT (PRT), 3 - Sham PRT and CT (CT), 4 - Double Sham (DS). Training period consisted of 2-3x 1.5 hours per week for 6 months. Follow-up cognitive and MRI assessments were carried out at 6 months (F1) (directly after training) and 18 months (F2) from BL.
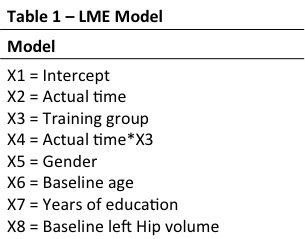
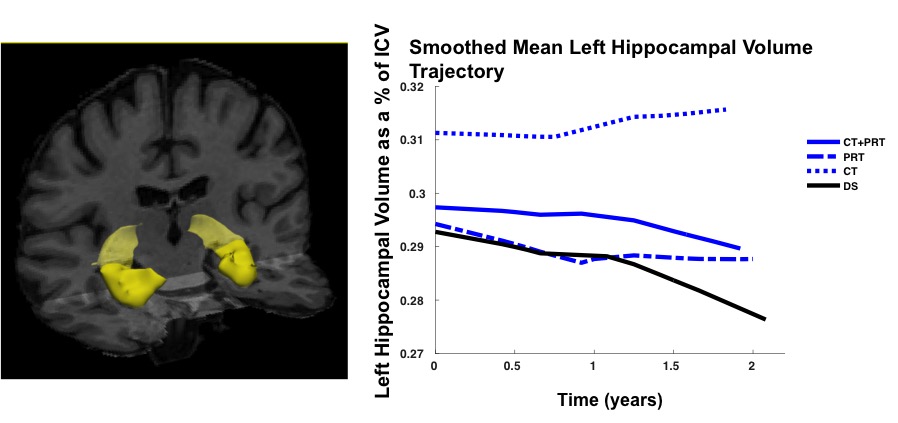
MRI parameters MRI was acquired on a 3T Philips Achieva Scanner (Best, Netherlands) with 8-channel receive head coil. A T13DTFE acquisition with 1mm isotropic resolution, TR/TE/FA = 5.39ms/2.43ms/8° was acquired in 84 subjects at BL. Patient drop out or poor quality delivered usable data on 79 subjects at F1 and 74 subjects at F2, but LME modelling of missing data means that total N=84. Data analysis T13DTFE datasets were pre-processed with FSL to perform brain extraction5. Images were then automatically processed with the longitudinal analysis stream in FreeSurfer to extract reliable volume and thickness estimates6. Longitudinal hippocampal volume change was investigated with a freely available univariate LME Matlab tool7. Hippocampal volumes were modelled as a % of BL volume, with right and left hemispheres analysed separately. A general model specification is shown in Table1 (including both covariates and variables of interest). Parameters were chosen from prior knowledge of the cohort and a likelihood ratio test was performed to determine number of random effects. A locally weighted mean measurement trajectory (lowess) plot provided predicted values for the fitted regression of hippocampal volume (Figure 1); based on this a linear Time x Group interaction was selected as the main contrast of interest.
Results
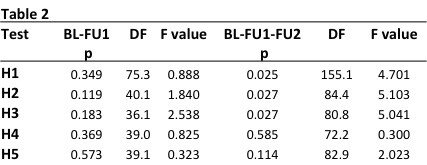
Five hypotheses (H1-H5) were tested for group x time interactions for time periods BL-F1 and BL-F1-F2.
H1 - Is there a difference in the rate of change between DS and all training groups?
H2 - Is there a difference in the rate of change between DS and CT?
H3 - Is there a difference in the rate of change between DS and PRT?
H4 - Is there a difference in the rate of change between PRT and CT?
H5 - Is there a difference in the rate of change between PRT+CT and DS?
LME found significant differences in left but not right hippocampal atrophy rates between training groups and the double sham (DS). Time X Group left hippocampal volume results are presented in Table2.
Discussion
LME models showed significant differences in left hippocampal atrophy rates in both training interventions compared to the DS group over the full 18-month follow-up period. There were no differences in hippocampal trajectories between PRT or CT, nor between combined training and the DS. Interestingly, meta-analysis of asymmetrical hippocampal volume loss in MCI and Alzheimer’s consistently report a greater rate of atrophy in the left hippocampus compared to the right8. Our findings of preserved left but not right hippocampal volume due to training may therefore have implications for combating dementia-related neurodegeneration. Further work is needed to determine if such training-related benefits are linked to better memory and cognitive outcomes in the long term.Acknowledgements
No acknowledgement found.References
1. M. Fiatarone Singh, et al. "The Study of Mental and Resistance Training (SMART) study—resistance training and/or cognitive training in mild cognitive impairment: a randomized, double-blind, double-sham controlled trial." Journal of the American Medical Directors Association 15.12 (2014): 873-880.
2. C. Suo, et al. “Therapeutically relevant structural and functional mechanisms triggered by physical and cognitive exercise.” Molecular Psychiatry. 2016. 21, 1633–1642
3.N.J. Gates et al. "Study of Mental Activity and Regular Training (SMART) in at risk individuals: A randomised double blind, sham controlled, longitudinal trial." BMC geriatrics 11.1 (2011): 1.
4. RC. Petersen, et al. ”Mild cognitive impairment: clinical characterization and outcome.” Arch Neurol 1999;56:303-308
5. M. Jenkinson, et al. “BET2: MR-based estimation of brain, skull and scalp surfaces.” In Eleventh Annual Meeting of the Organization for Human Brain Mapping, 2005.
6. M. Reuter, et al. “Within-Subject Template Estimation for Unbiased Longitudinal Image Analysis.”.NeuroImage 2012 61(4), pp. 1402-1418.
7. JL. Bernal-Rusiel, et al. “Statistical Analysis of Longitudinal Neuroimage Data with Linear Mixed Effects Models.” NeuroImage 2012. 66C, pp. 249-260.
8. F. Shi et al. “Hippocampal volume and asymmetry in mild cognitive impairment and Alzheimer's disease: Meta-analyses of MRI studies”. Hippocampus, 2009. 19: 1055–1064.
Figures