2376
Fast multivariate relaxometry can differentiate neurodegenerative disease processes and phenotypes1NeuroPoly Lab, Institute of Biomedical Engineering, Polytechnique Montréal, Montreal, QC, Canada, 2Athinoula A. Martinos Center for Biomedical Imaging, MGH, Charlestown, MA, United States, 3Department of Clinical Neuroscience, Karolinska Institutet, Stockholm, Sweden, 4Department of Neurology, Karolinska University Hospital, Stockholm, Sweden, 5Center for Medical Imaging Science and Visualization, CMIV, Linköping, Sweden, 6SyntheticMR, Linköping, Sweden, 7Montreal Health Institute, Montreal, QC, Canada, 8Harvard Medical School, Boston, MA, United States, 9Functional Neuroimaging Unit, CRIUGM, Université de Montréal, Montréal, QC, Canada, 10Department of Clinical Science, Intervention and Technology, Karolinska Institutet, Stockholm, Sweden, 11Department of Radiology, Karolinska University Hospital, Stockholm, Sweden
Synopsis
Hereditary diffuse leukoencephalopathy with spheroids (HDLS) and multiple sclerosis (MS) are demyelinating and neurodegenerative disorders that can be hard to distinguish clinically and radiologically. Here, we present a framework to extract independent physiological sources of signal from time-efficient multiple quantitative relaxometry (T1, T2 and PD maps) to characterize varying degrees and mechanisms of tissue disruption. The method can aid in the differentiation of HDLS and MS (p=0.007), as well as identify MS subtypes (p=0.0007), which would be helpful in ensuring a correct diagnosis and treatment of these disorders.
Purpose
Hereditary diffuse leukoencephalopathy with spheroids (HDLS) and multiple sclerosis (MS) are two disorders characterized by focal and diffuse demyelination, axonal loss, neurodegeneration and scarring, making them hard to distinguish clinically and with conventional imaging [1]. HDLS can be misdiagnosed as primary progressive MS due to clinical and radiological similarities [2]–[4]. There are, however, differences in the pathophysiology and varying degree of tissue disruption in MS and HDLS that would be helpful to characterize in order to ensure correct diagnosis and treatment. This is of particular clinical importance since MS treatments applied to HDLS may not be beneficial and only cause side effects. Here, we present a framework based on the extraction of independent physiological sources of signal from a single time-efficient multi-parametric (T1, T2, PD) acquisition, similar to MR fingerprinting, that can aid the differentiation of HDLS and MS, as well as identify MS lesion subtypes.Methods
Data acquisition: In this prospective study, we enrolled 14 healthy controls (age 40±14 years, 7 females), 14 MS patients (age 50±9 years, 11 females; 1 PPMS, 4 RRMS, 9 SPMS, median EDSS score 3.75, range 1-8.5) and 4 HDLS patients (age 50±5 years, 2 females). Each subject was scanned on a Siemens Trio 3.0T scanner using a saturation-recovery spin echo sequence: 30 axial slices; resolution 0.9x0.9x4.0 mm3, flip angle 120°; repetition time 4260 ms; echo times 22 and 100 ms; 4 averages (150/580/2000/4130 ms effective inversion times); GRAPPA factor 2; acquisition time 6:50 min [5]. The software SyMRI 7.2RC was used to fit the quantitative T1, T2 and PD maps. Since these maps are based on the same acquisition, they are inherently aligned. Lesion masks in patients were segmented by an experienced rater based on synthetic FLAIR, PD-, T1- and T2-weighted images.
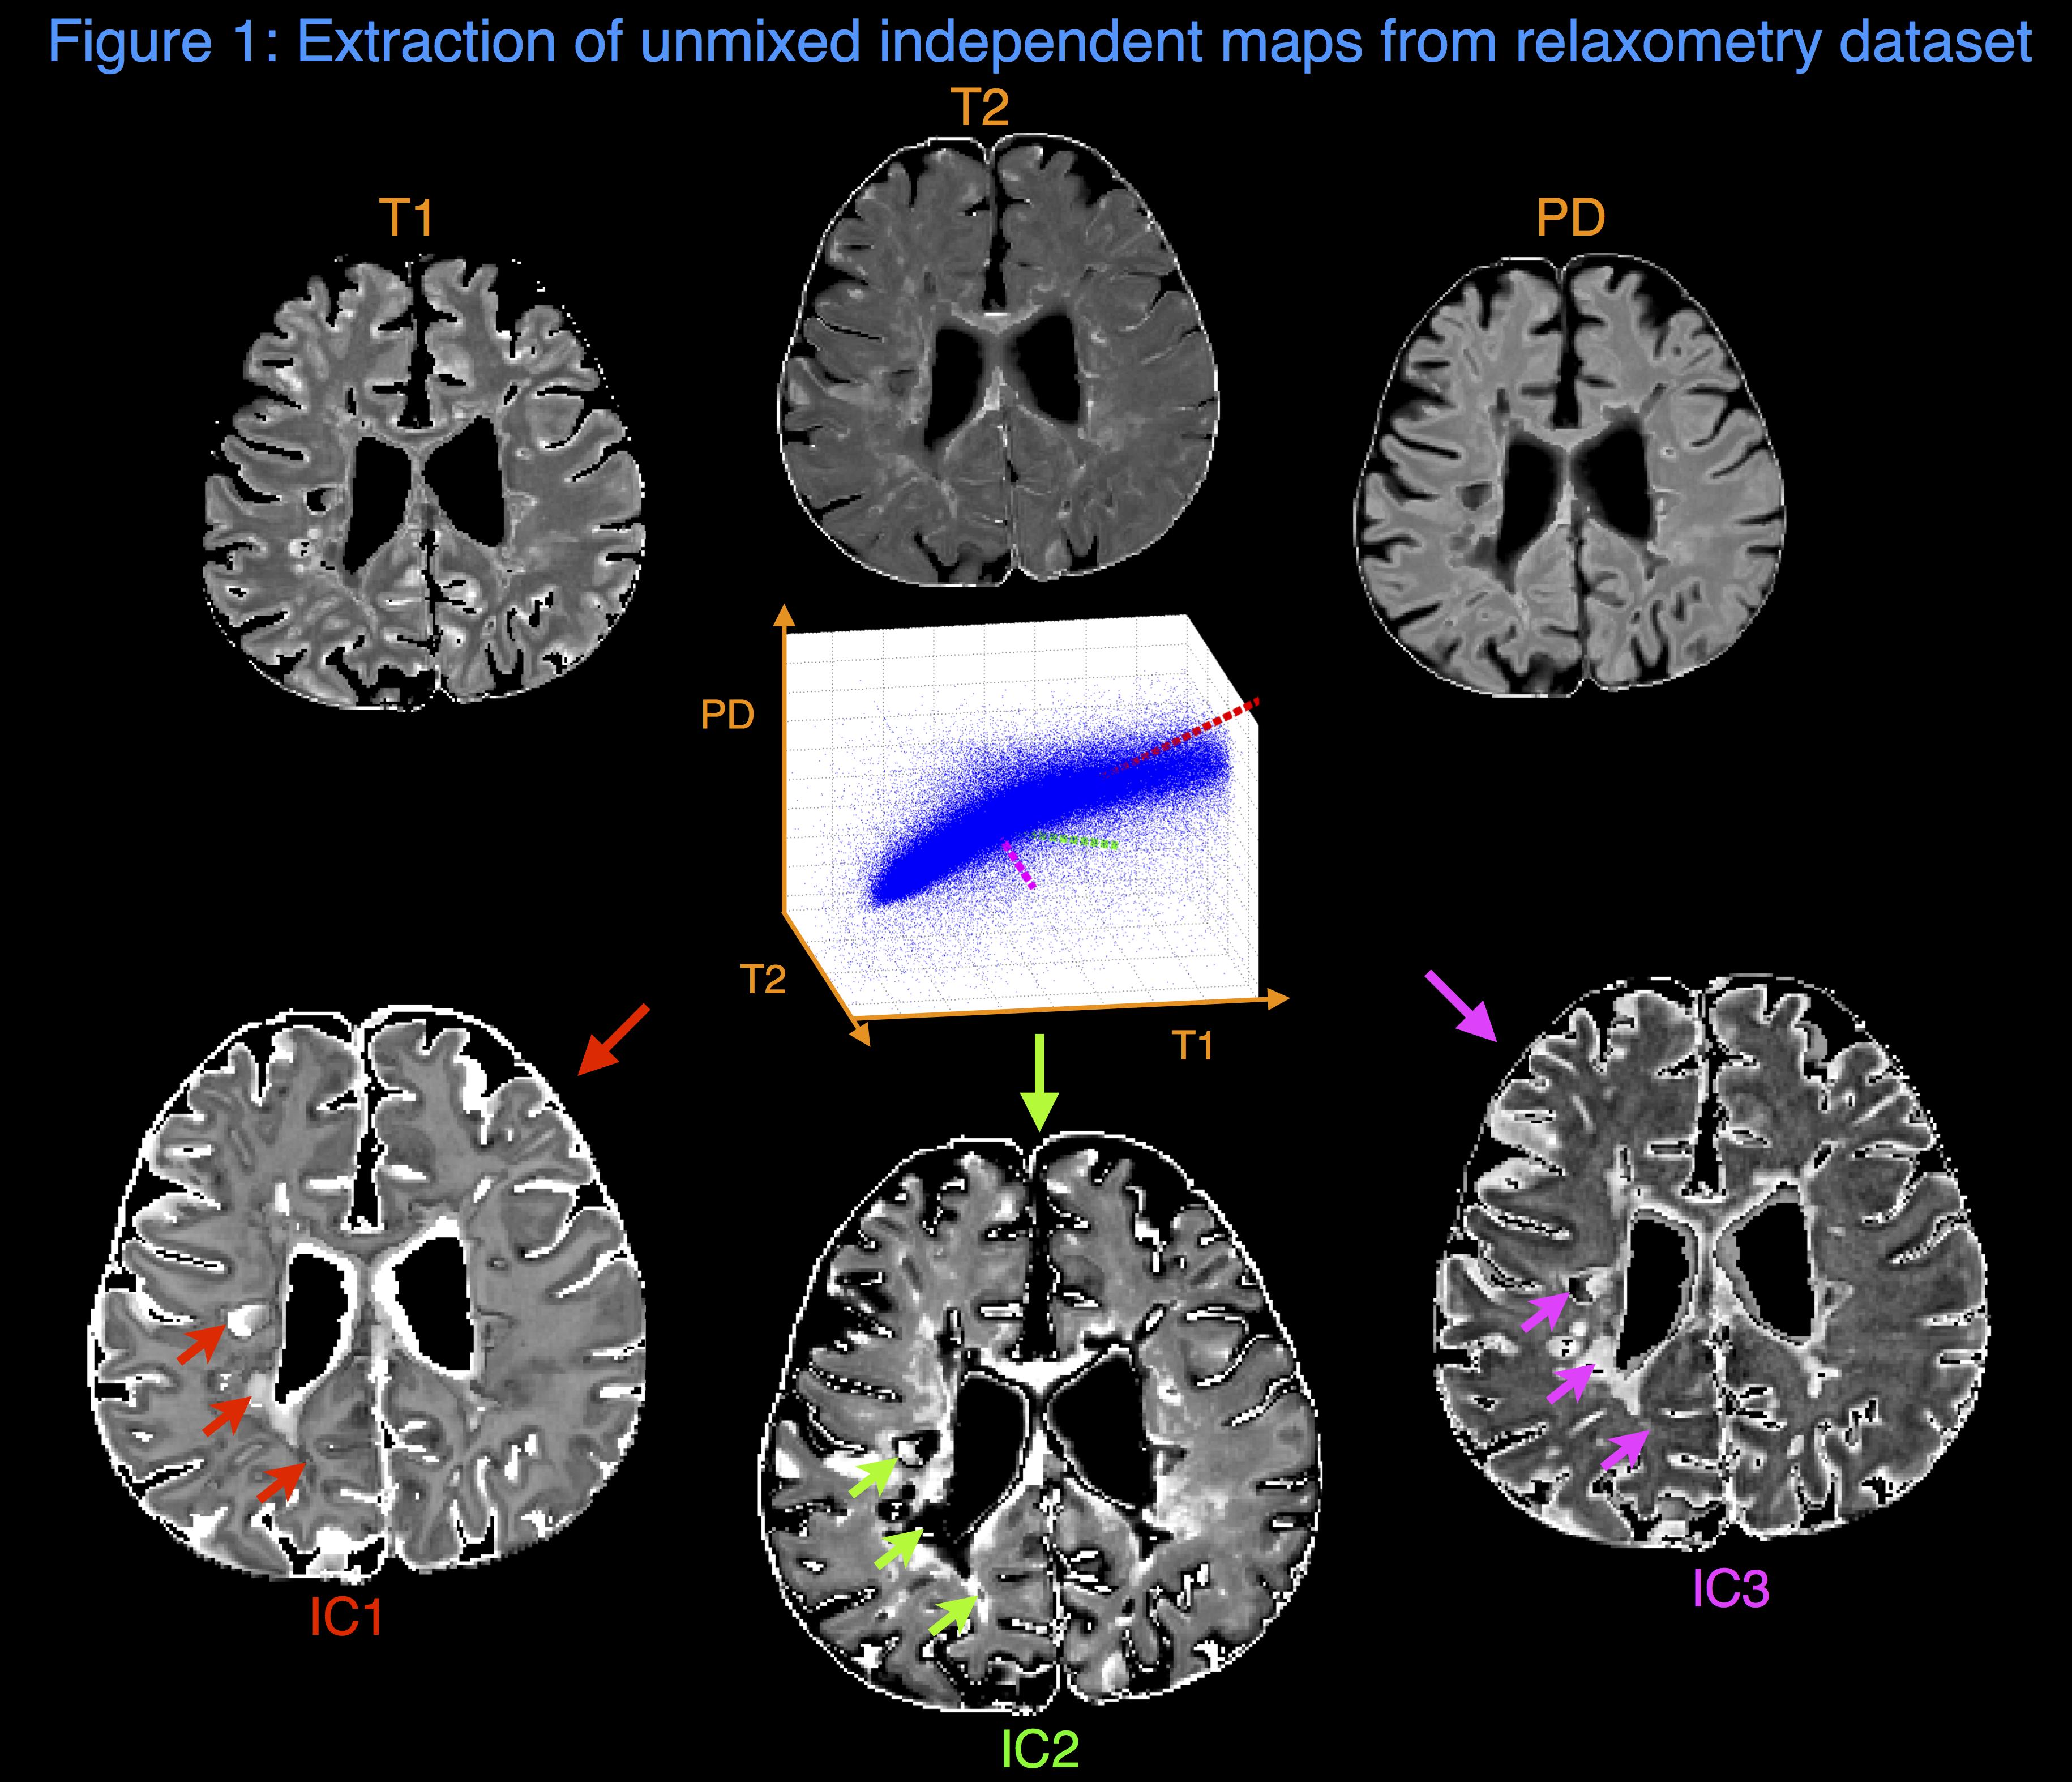
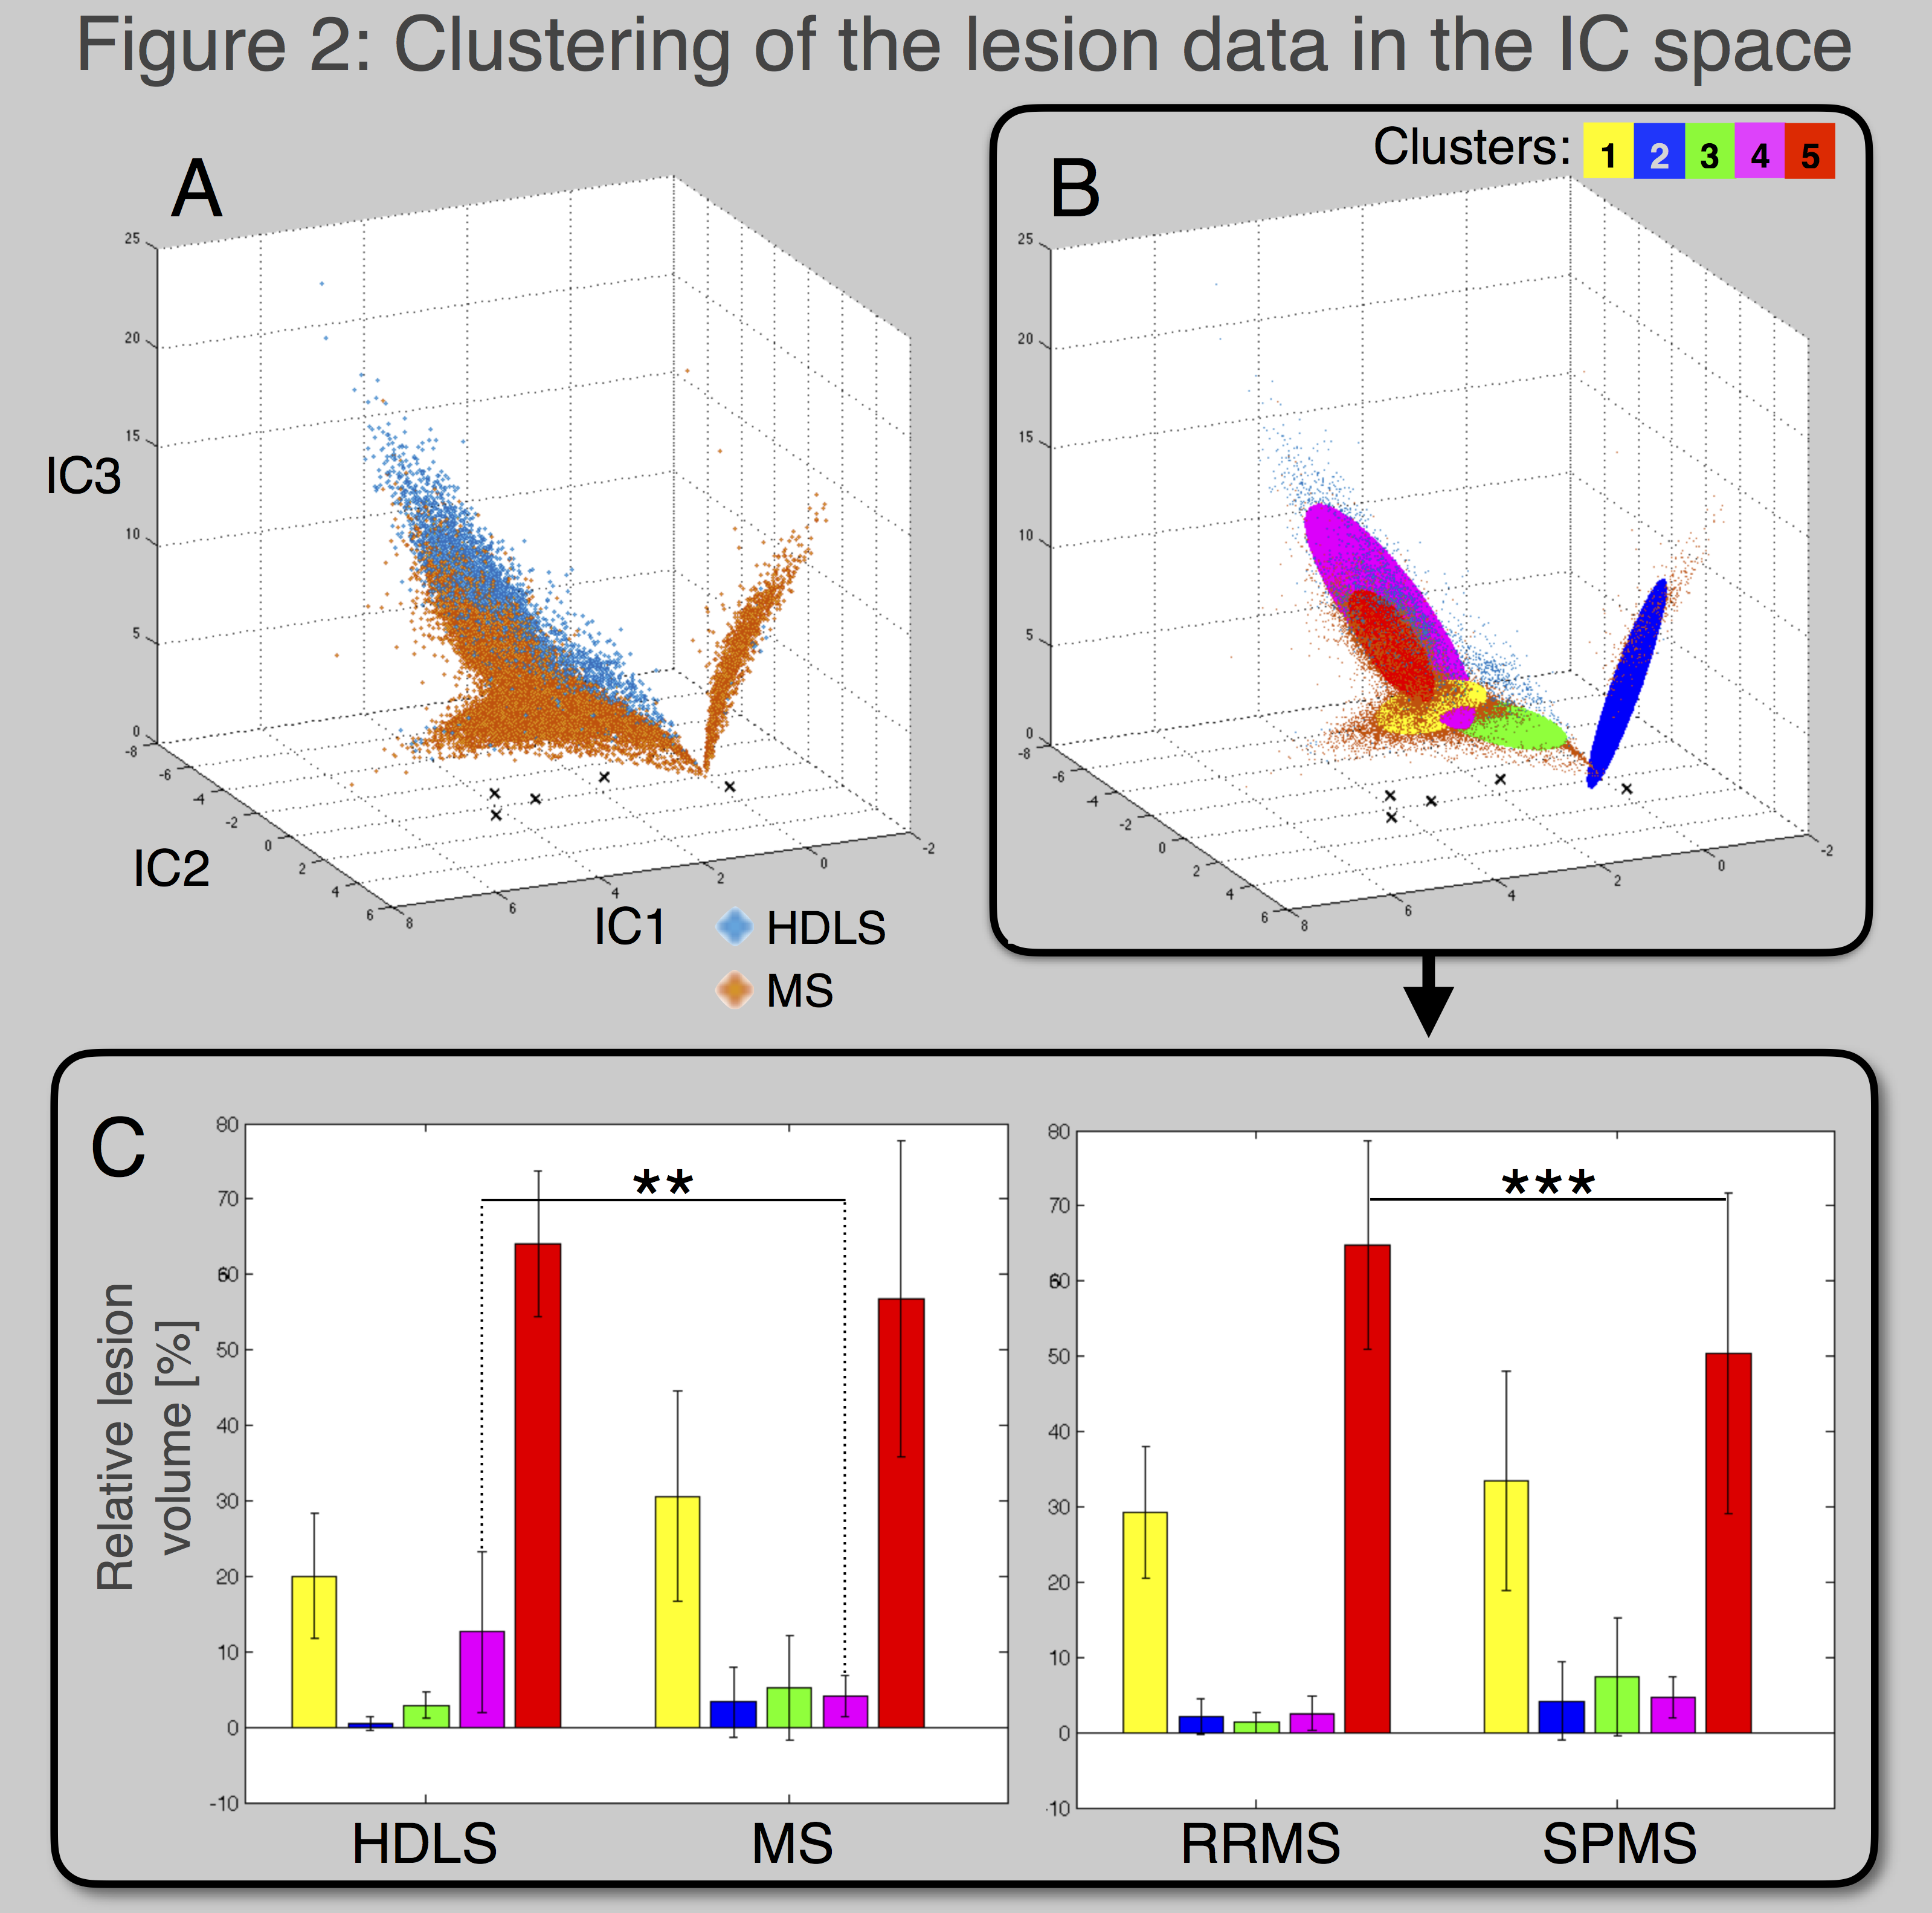
Data processing: The first step consisted in extracting the unmixed information contained in the relaxometry maps. Indeed, T1, T2 and PD shares redundant information that decrease the user ability to detect specific processes. An independent component analysis (ICA) algorithm was used to unmix the independent physiological sources of signal that drive T1, T2 and PD [6], [7], illustrated in Figure 1. Secondly, the lesions were extracted and analyzed in the independent component (IC) space, Figure 2. A Gaussian-Mixture clustering was performed [8], [9], without a-priori information, in order to classify the lesion voxels based on their distribution in the IC space. Then, the probability of data points to belong in each cluster was computed using Mahalanobis distance [9]. Thirdly, to compare the proportion of lesion type in the different groups, general linear models were performed with gender and age as regressors.
Results
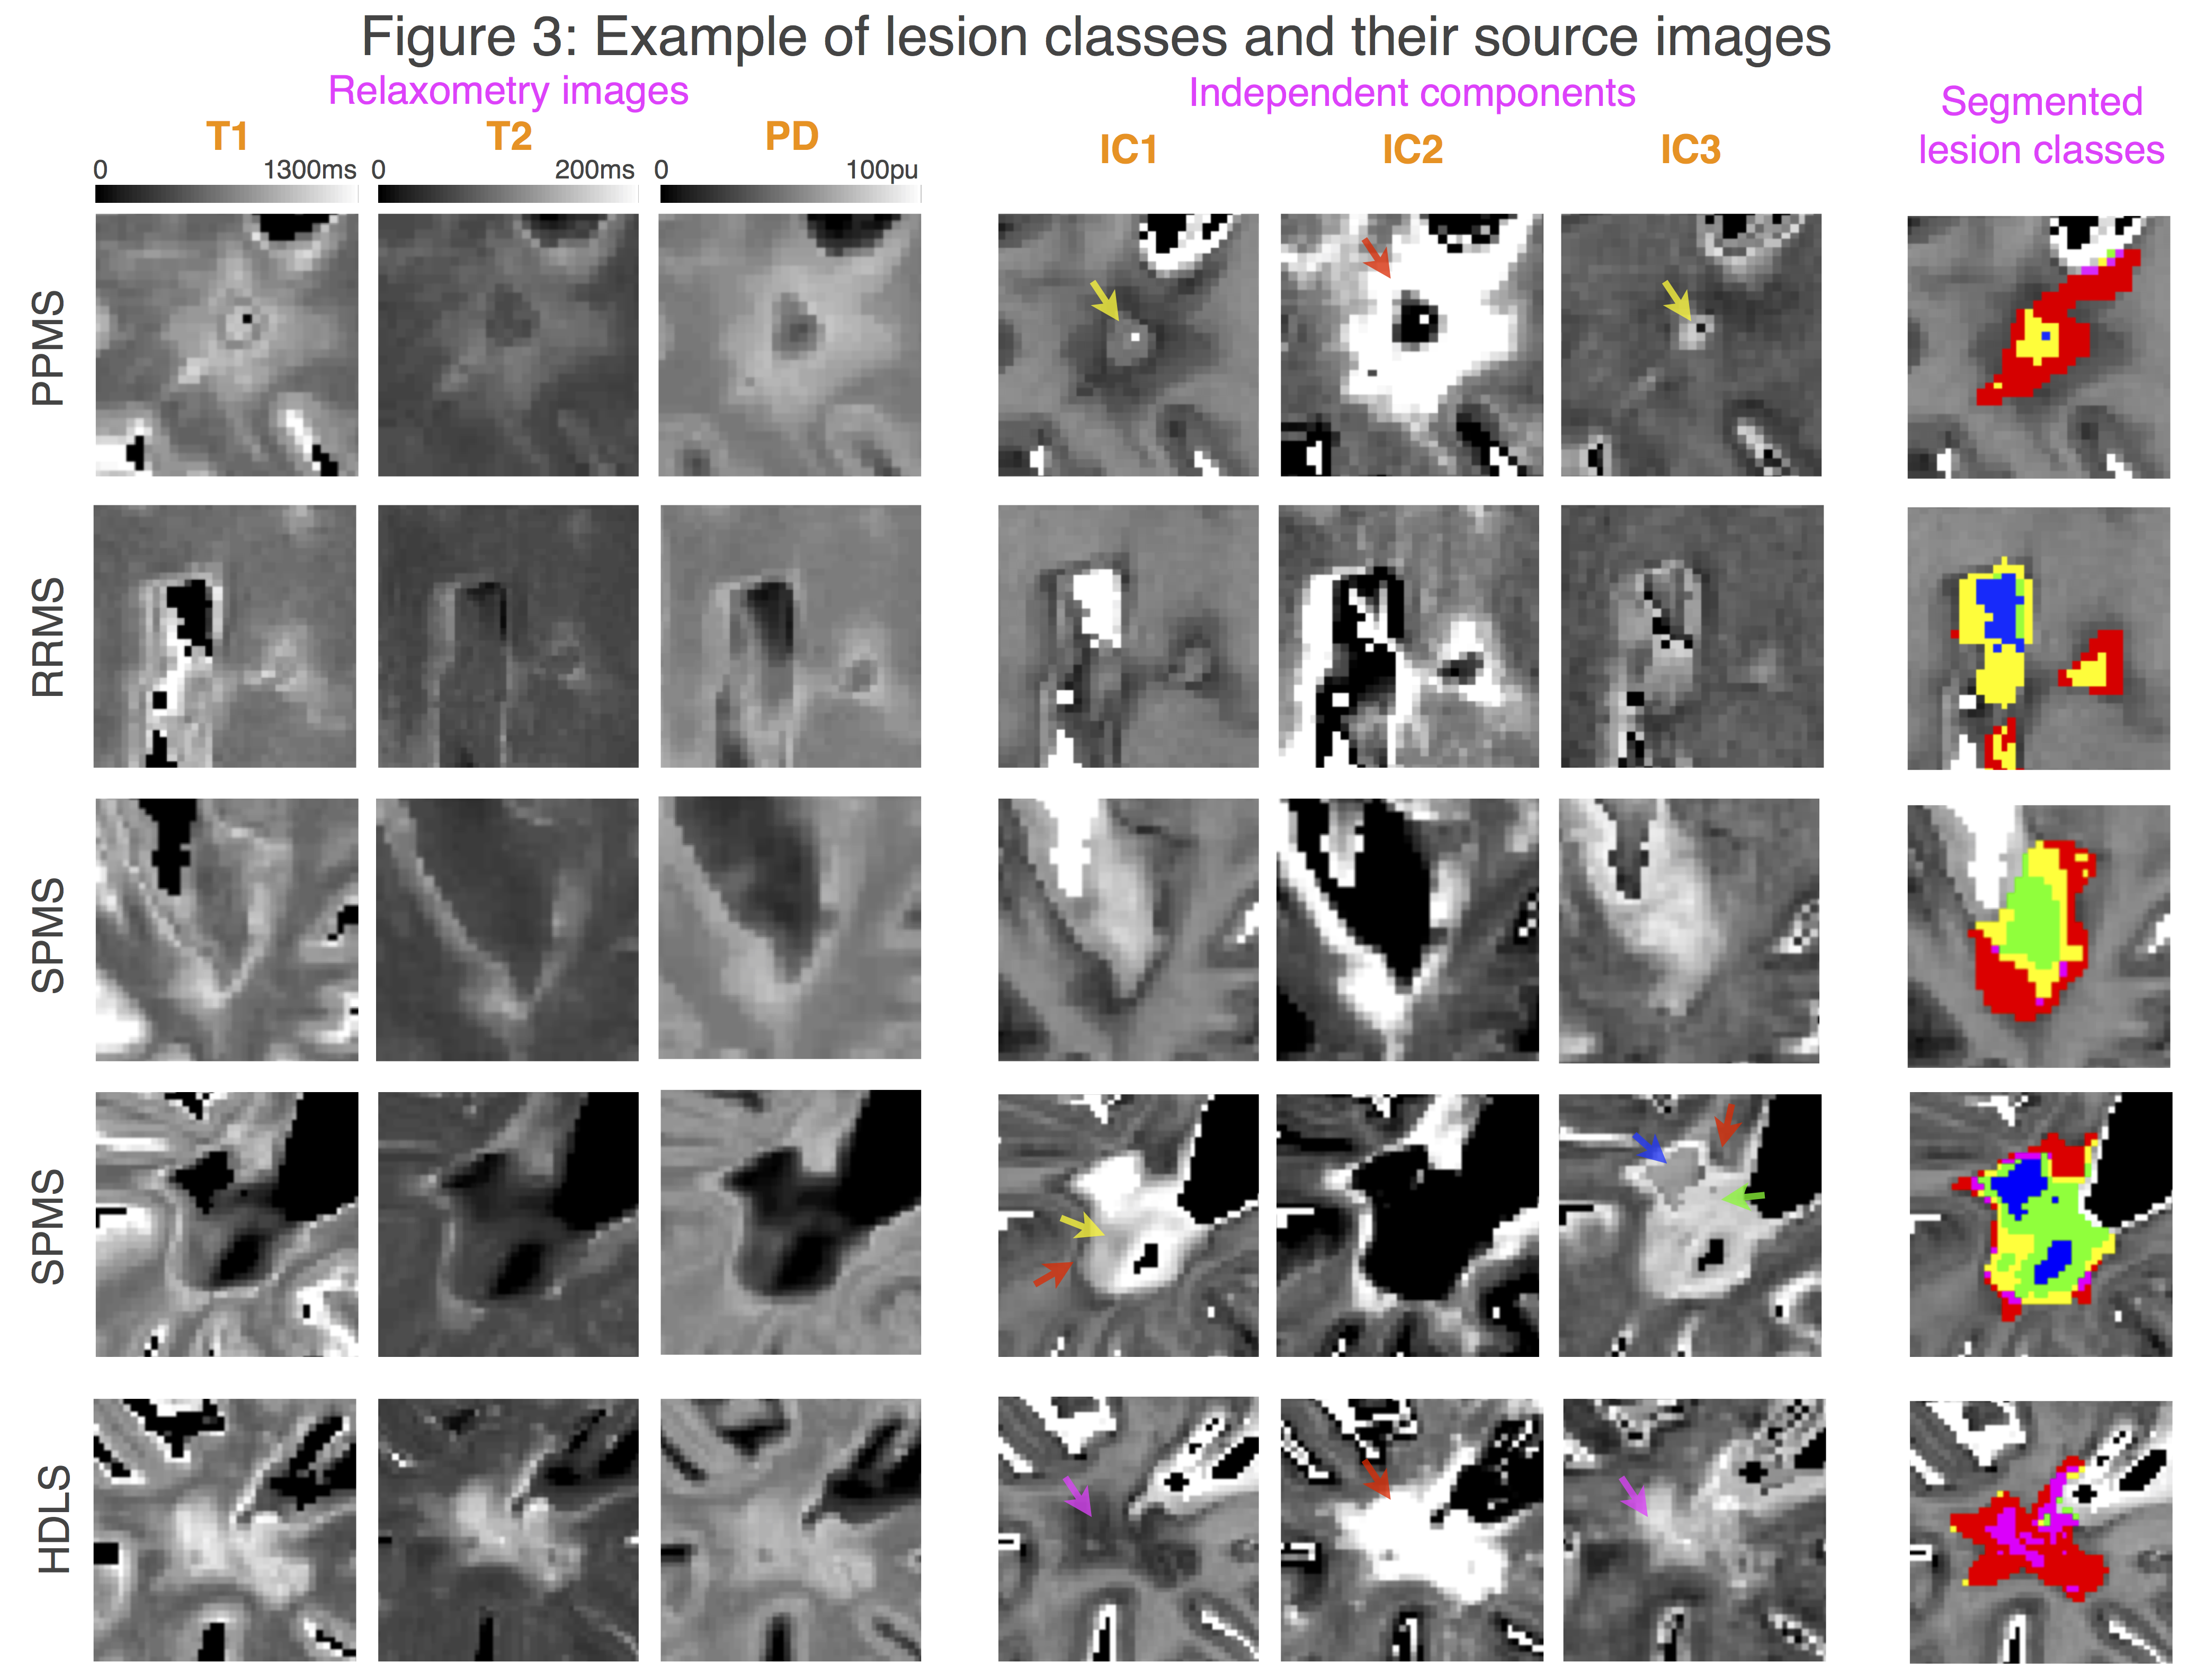
Figure 2A shows the lesion data plotted in the IC space. Blue dots represents data from HDLS patients while orange dots represent MS patients. In this space, the groups are easily distinguishable, moreover, well-defined clusters are seen within MS lesions, suggesting different types of MS lesions. Figure 2B shows the result of the clustering: five classes of lesions were identified (fast convergence, Mahalanobis distance <3.05, p<0.01). Voxels were classified based on the cluster for which they had the highest probability to belong. Figure 2C shows the proportion of lesion classes for the HDLS and MS groups (left) and the proportion of lesion classes for RRMS and SPMS groups (right). The general linear models show that the HDLS group has significantly more lesions of class 4 than the MS group (p=0.007). Moreover, the RRMS group has more lesions of class 5 than SPMS (p=0.0007). Trends are also seen for lesion classes 2-4, suggesting that the disorders/phenotypes are affected by different lesion degrees and/or mechanisms. Figure 3 exemplifies multi-parametric maps, ICs and lesion classes in the patient groups.Discussion/Conclusion
In this study, we generated an independent and multi-dimensional dataset in order to classify the signal coming from lesions in HDLS and MS, as well as within MS subtypes. The well-defined lesion classes are hypothesized to represent different degrees and types of pathophysiological processes occurring in neurodegenerative diseases, including inflammation, de- and remyelination, axonal loss and gliosis. This is a first step exploring the feasibility of characterizing tissue disruption using a fast imaging sequence, enabling a specific differentiation of neurodegenerative phenotypes such as HDLS and MS or RRMS and SPMS. Since the used imaging technique is time-efficient and additionally produces traditional and conventional image contrasts, as well as robust volumetry [10], it could be easily applicable in clinics. Future studies will include histological work in order to determine whether it is possible to associate the different lesion classes with specific pathophysiological processes.Acknowledgements
We would like to thanks Maël Richard (Claude Bernard Medical University) for helpful discussions. This research was supported by the Stockholm City Council and Karolinska Institutet (ALF 20120213 and 20150166), the Canadian Institute of Health Research (CIHR FDN-143263), Canada Research Chair in Quantitative Magnetic Resonance Imaging, the Fonds de Recherche du Québec - Santé (FRQS 28826), the Fonds de Recherche du Québec - Nature et Technologies (FRQNT 2015-PR-182754), Quebec Bio-Imaging Network (QBIN), the Natural Sciences and Engineering research Council of Canada (NSERC). Dr. Granberg is supported by the Swedish Society for Medical Research.References
[1] T. Granberg, F. Hashim, O. Andersen, C. Sundal, and V. D. Karrenbauer, “Hereditary diffuse leukoencephalopathy with spheroids - a volumetric and radiological comparison with multiple sclerosis patients and healthy controls,” Eur. J. Neurol., vol. 23, no. 4, pp. 817–822, Apr. 2016.
[2] B.-Y. Saitoh et al., “A case of hereditary diffuse leukoencephalopathy with axonal spheroids caused by a de novo mutation in CSF1R masquerading as primary progressive multiple sclerosis,” Mult. Scler., vol. 19, no. 10, pp. 1367–1370, Sep. 2013.
[3] T. Inui et al., “A new CSF1R mutation presenting with an extensive white matter lesion mimicking primary progressive multiple sclerosis,” J. Neurol. Sci., vol. 334, no. 1–2, pp. 192–195, Nov. 2013.
[4] C. Sundal et al., “Hereditary diffuse leukoencephalopathy with spheroids with phenotype of primary progressive multiple sclerosis,” Eur. J. Neurol., vol. 22, no. 2, pp. 328–333, Feb. 2015.
[5] J. B. M. Warntjes, O. D. Leinhard, J. West, and P. Lundberg, “Rapid magnetic resonance quantification on the brain: Optimization for clinical usage,” Magn. Reson. Med., vol. 60, no. 2, pp. 320–329, Aug. 2008.
[6] G. Mangeat, S. T. Govindarajan, C. Mainero, and J. Cohen-Adad, “Multivariate combination of magnetization transfer, T2* and B0 orientation to study the myelo-architecture of the in vivo human cortex,” Neuroimage, vol. 119, pp. 89–102, Oct. 2015.
[7] G. Mangeat et al., “Multivariate combination of quantitative T2* and T1 at 7T MRI detects in vivo subpial demyelination in the early stages of MS,” in Mult Scler, 2015, vol. 23, p. 485.
[8] H. Permuter, J. Francos, and I. Jermyn, “A study of Gaussian mixture models of color and texture features for image classification and segmentation,” Pattern Recognit., vol. 39, no. 4, pp. 695–706, 2006/4.
[9] D. Ververidis and C. Kotropoulos, “Gaussian Mixture Modeling by Exploiting the Mahalanobis Distance,” IEEE Trans. Signal Process., vol. 56, no. 7, pp. 2797–2811, Jul. 2008.
[10] T. Granberg et al., “Clinical Feasibility of Synthetic MRI in Multiple Sclerosis: A Diagnostic and Volumetric Validation Study,” AJNR Am. J. Neuroradiol., vol. 37, no. 6, pp. 1023–1029, Jun. 2016.
Figures