2372
Exaggeration of Tau Pathology by Amyloid-β production in PS2APPxTauP301L Transgenic Mouse Model of Alzheimer’s Disease1Biomedical Imaging, Genentech, South San Francisco, CA, United States, 2Neuroscience, Genentech, South San Francisco, CA, United States, 3Pathology, Genentech, South San Francisco, CA, United States
Synopsis
The PS2APP, PS2APPxTauP301LHet, TauP301LHomo, TauP301LHet transgenic mouse models of AD were characterized using MRI, and various regional brain atrophies were detected using a completely automated analysis by SPM-8. Furthermore, through MRI (both ROI and voxel based morphometry) and histology we showed that the presence of PS2APP mutation in PS2APPxTauP301LHet triple transgenic mouse model exaggerates the Tau pathology. The presented results will enable MRI as a great tool to non-invasively assess the disease progression over time in preclinical therapeutic studies targeting Aβ and Tau pathology.
Introduction
Alzheimer’s disease is characterized by intracellular accumulation of phosphorylated Tau (neurofibrillary tangles) and extracellular deposition of amyloid-β (plaques), resulting in neuronal loss and regional brain atrophy followed by dementia in AD patients 1. Transgenic mouse models of human Alzheimer’s disease (AD) with mutations to human APP, presenilin 2 (PS2) and Tau have been shown to recapitulate the hallmarks of the disease pathology. MRI has been used to characterize various aspects of brain pathology: e.g. volumetric MRI for brain atrophy, diffusion anisotropy for white matter degradation, and T2 imaging for detection of amyloid plaque deposits. Our goal was to characterize the PS2APP, PS2APPxTauP301LHet, TauP301LHomo, TauP301LHet transgenic mouse models of AD using MRI to detect the regional brain atrophy caused due to the neural loss, and further examine their rate of brain atrophy to detect the role of Amyloid-β deposition over phosphorylated Tau in AD progression. A fully automated analysis by SPM-8 was used to evaluate the regional and voxel differences in the brain structure 2.Methods
Animal procedures were approved by the institutional AAALAC-accredited review board. In the first study, Thy1.hTauP301L transgenic (TauHomo, n=20) and wild type (WT, n=20) mice were longitudinally imaged every month from 2 to 6, and later at 9, 12 and 16 months of age. In the second study, Thy1.PrP.hAPP.hPS2 dual transgenic (PS2APP, n=12), Thy1.hTauP301L transgenic (TauHomo, n=12), triple transgenic (PS2APPxTauHet, n=10), and wild type (WT, n=12) mice were imaged at 9, 12 and 18 months. MRI for both studies were performed on a 9.4T Varian/Agilent (Agilent Technologies, Santa Clara, CA) system with a 30 mm transmit/receive volume coil. T2-weighted images were acquired using a multi-spin echo sequence: TR 6000 ms, TE 10, 20, 30, 40, 60, 70, 80ms, 56 contiguous axial slices of 0.3 mm thickness, FOV 19.2 mm x 19.2 mm, matrix size 128 x 96 (zero-filled to 128x128), 2 averages, scan time 19 min. In the third study, Thy1.hTauP301L transgenic (TauHet, n=17), triple transgenic (PS2APPxTauHet, n=20), and wild type (WT, n=20) mice were imaged at 9, 12 and 18 months. MRI for this study was performed on a 7T Bruker (Billerica, MA) system with a 4-channel receive-only cryocoil and volume transmit coil. T2-weighted images were acquired with a multi-spin echo sequence: TR 5100 ms, TE 10, 20, 30, 40, 50, 60, 70, 80ms, 56 contiguous axial slices of 0.3 mm thickness, FOV 19.2 mm x 19.2 mm, matrix size 256 x 128, 1 average, scan time 11 min. Equal number of males and females were included in all the three studies to detect any gender difference. The images were processed and analyzed using an automated algorithm where the analysis was based on an in-vivo mouse atlas that contains 20 defined structures 3. The ROI volumes were normalized to whole brain volumes to minimize the genotype differences. Dunnett’s test was used for group comparisons against the WT with threshold of p<0.05.Results and Discussion
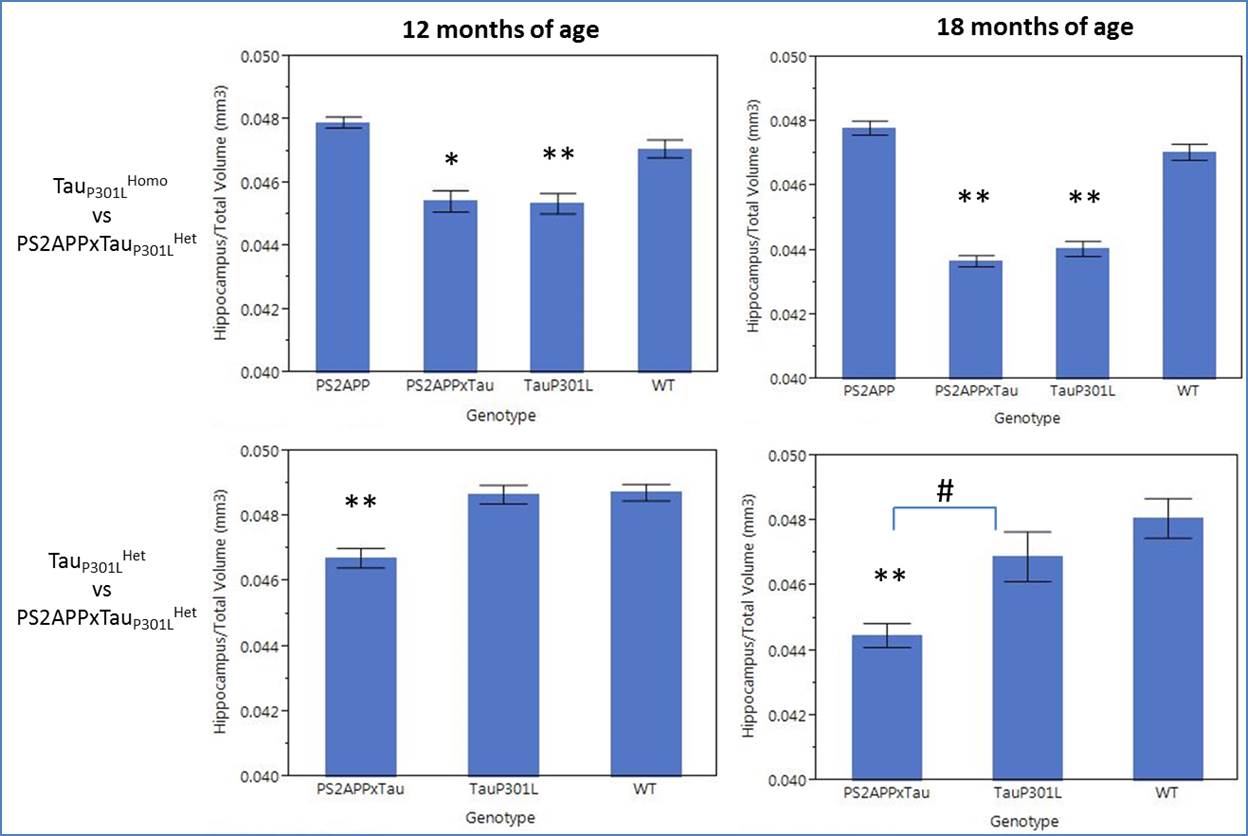
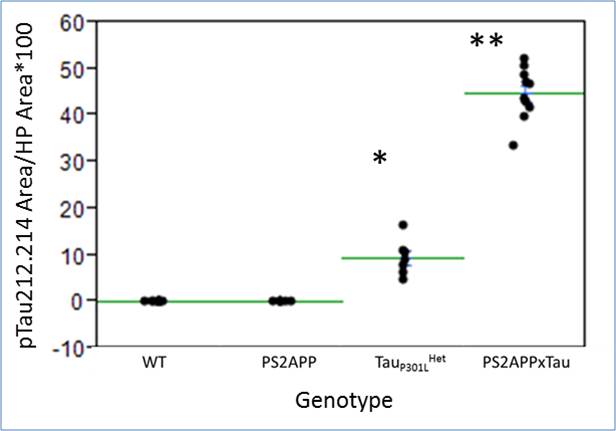
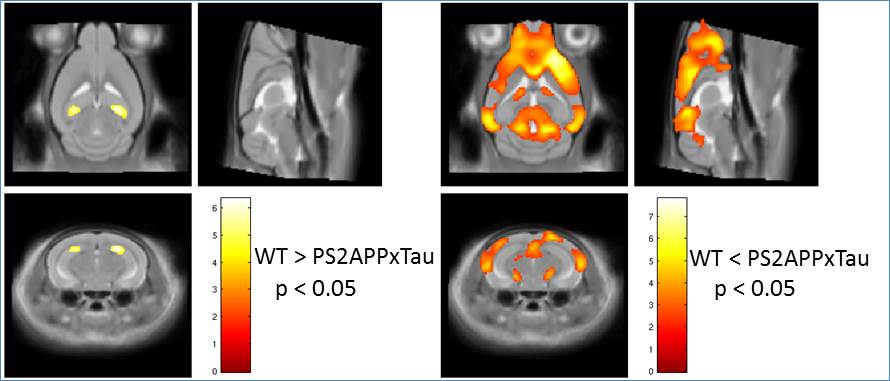
A reduction in normalized hippocampal volume over time was detected in TauP301LHomo mouse model of AD through volumetric MRI starting at 5 months of age, reaching significance at 12 months (Fig 1). The hippocampal volume was also significantly reduced in PS2APPxTauHet mice at 12 months of age whereas hippocampal atrophy was not detected in PS2APP and TauP301LHet alone mice (Fig 2), suggesting that the presence of PS2APP mutation in this triple transgenic mouse model exaggerates the Tau pathology. This was also evident from the histology where elevated pTau levels were detected in the hippocampus of PS2APPxTauHet mice (Fig 3). We also found that the normalized neocortex volume in PS2APP and PS2APPxTauHet mice was significantly higher than the WT mice. Furthermore, voxel based morphometry (VBM) detected areas of significantly lower gray matter volume in the hippocampus and larger in the Neocortex of PS2APPxTauHet mice (Fig 4). No differences were detected between the WT and TauP301LHet mice. The hippocampal atrophy observed in the TauP301LHomo and PS2APPxTauHet groups recapitulates a feature of human AD. Expansion of the neocortex in the PS2APP positive mice may be due to the high Ab load and possibly inflammation observed in this model at this age.Conclusion
Significant regional brain atrophies in these mouse models were detected that are consistent with the known pathologies of AD and showed that the Aβ accumulation in PS2APPxTauHet mouse model of AD enhances the Tau pathology. The presented results characterizing the AD transgenic mouse models using MRI will enable preclinical therapeutic studies targeting Aβ and Tau pathology, and provides MRI as a great tool to non-invasively assess the disease progression over time.Acknowledgements
No acknowledgement found.References
1. Yang D et al., Volumetric MRI and MRS provide sensitive measures of Alzheimer's disease neuropathology in inducible Tau transgenic mice (rTg4510), NeuroImage, 2010.
2. Barck K et al.,Characterization of Transgenic Mouse Models of Alzheimer's Disease by Fully Automated Analysis of Brain MRI, Proceedings of the International Society for Magnetic Resonance in Medicine-21, 2013.
3. MRM NeAT, http://brainatlas.mbi.ufl.edu/
Figures