2370
Modulated the Physiological Response Delay to Prevent Overestimating the Disruption of Default Mode Network in Alzheimer’s Disease1Institute of Biomedical Engineering, National Taiwan University, Taipei, Taiwan, 2Department of Medical Imaging, Taipei Medical University-Shuang Ho Hospital, New Taipei City, Taiwan, 3Neurological Institute, Taipei Veterans General Hospital, Taipei, Taiwan, Taipei, Taiwan, 4Department of Neuroscience and Biomedical Engineering, Aalto University, Espoo, Finland
Synopsis
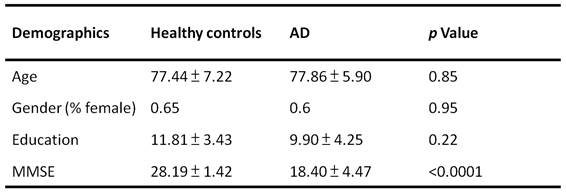
This study quantified the impact of physiological noise correction in characterizing the resting-state fMRI in Alzheimer’s disease (AD) patients with age- and gender-matched 17 healthy subjects and 15 AD patients. Using a seed-based correlation method with seeds at posterior cingular cortex and medial prefrontal cortex, we found that the difference in the functional connectivity between AD patients and healthy controls was significantly reduced when physiological noise was suppressed.
Purpose
Studies have reported that the strength of the default mode network (DMN) is significantly reduced in Alzheimer’s disease (AD) patients1-6. However, few studies have considered the contamination of physiological noise in DMN characterization. It has been reported that the patterns of physiological noise caused by cardiac and breathing rhythms are not the same in young and elderly subjects7-9. The contribution of cardiac and respiratory activity to fMRI signal fluctuations can also depends on subject’s healthy and disease state. Here, we estimate the physiological response functions and study the impact of spontaneous physiology on characterizing the DMN of AD patients and age-matched healthy subjects. The goal is to test how the difference in DMN characteristics may change after appropriately controlling physiological response due to spontaneous cardiac and breathing rhythms.Methods
Age- and gender-matched 17 healthy elderly and 15 AD patients participated this study (Table 1) with written informed consents approved by the Insitute Reviewing Board. MRI was performed on a 3T scanner (Magnetom Tim Trio, Siemens) with a 32-channel head coil array. T1-weighted anatomical images were acquired by MPRAGE (TR/TE = 2530/3.03ms, FOV = 256mm, flip angle = 7o, Matrix size = 224x256, voxel size = 1.0mm3; GRAPPA, acceleration = 2). Resting-state fMRI scans used T2*-weigthed echo-planar imaging (TR/TE = 2000/30ms, FOV = 220mm, flip angle = 90o, Matrix size = 384x384, slice thickness = 3.5mm, duration: 6’40”). Cardiac and respiratory cycles were recorded using the pulse oxymeter placed on the index finger tip and a respiration belt strapped around the upper abdomen. We used RETROICOR10 to remove cardiac and respiratory artifacts. We further removed the low-frequency respiratory and heart rate effects by RVHRCOR11, where the “respiratory variations” (RV) time series was generated by convolving the root-mean-square amplitude of the respiration waveform across a 6-s sliding window and a “respiration response function (RRF)”12; the heart rate (HR) time series by convolving between the inverse of the average beat-to-beat interval in a 6-s sliding window and a “cardiac response function (CRF)”13. Functional connectivity was estimated by a seed-based correlation method14 with seeds at posterior cingulate cortex (PCC; MNI [0, -53, 26]15) and medial pre-frontal cortex (mPFC; MNI [0, 52, -6]6). We also analyzed group-specific RRF and CRF for healthy subjects and AD patients. Specifically, brain image voxels showing significant contribution to RV and HR fluctuations were pooled together for RRF and CRF estimation by using a linear combination of the previously published RRF12 and CRF13 and their first- and second-order temporal derivatives.Results
The RV and HR regression coefficient maps (Figure 1) in the general linear modeling show significant differences between healthy controls and AD patients, especially at DMN regions. We found that, for AD patients, the RV and HR factors both did not explain as much variance as for healthy subjects (Figure 1-C, F). Figure 2 shows DMN maps calculated by using PCC/mPFC as the seed regions. Before physiological noise correction, the functional connectivity with PCC showed significant difference in the mPFC (Figure 3-A). It became insignificant after the physiological noise suppression (Figure 3-B). Similarly, taking the mPFC as the seed region, the functional connectivity of the healthy group differed signficantly from the AD group at PCC (Figure 3-D). Again, this difference became insignificant after physiological noise suppression (Figure 3-E). Compared to healthy controls, we found that AD patients had a delayed physiological response (Figure 4) with a later arrival time in both respiration and cardiac response functions. By applying the group-specific RRF and CRF in the RVHRCOR approach, we found that the difference between healthy subjects and AD patients in DMN was still reduced after physiological noise suppression (Figure 3-C,F).Discussion & Conclusion
The impact of the spontaneous physiology to two groups were not the same. Specifically, RV and HR were both low frequency physiological factors with prominent effects near the DMN nodes. While AD patients have different DMN characteristics from normal controls before physiological noise suppression as reported previously1-6, however, this difference became insignificant after physiological noise suppression. Note that we suppressed physiological noise by population-specific physiological response functions, which had different physiological response delays between healthy subjects and AD patients. Our results suggest the importance of controlling noise due to spontaneous cardiac and respiratory cycles in order to achieve more sensitive and specific differentiation between healthy subjects and AD patients based on features in the DMN.Acknowledgements
This work was partially supported by Ministry of Science and Technology, Taiwan (103-2628-B-002-002-MY3, 105-2221-E-002-104), and the Academy of Finland (No. 298131).
References
1. Buckner, R.L. and J.L. Vincent, Unrest at rest: default activity and
spontaneous network correlations. Neuroimage, 2007. 37(4): p. 1091-6; discussion 1097-9.
2. Greg
Allen, H.B., Roderick McColl, Andrea L.
Hester, Julie A. Fields, Myron F. Weiner, Wendy K. Ringe, Anne M. Lipton, Matthew Brooker, Elizabeth McDonald, Craig D. Rubin, C. Munro Cullum, Reduced Hippocampal Functional Connectivity in Alzheimer Disease.
Archives of Neurology, 2007. 64(10):
p. 1482-1487.
3. Rombouts,
S.A., et al., Altered resting state
networks in mild cognitive impairment and mild Alzheimer's disease: an fMRI
study. Hum Brain Mapp, 2005. 26(4):
p. 231-9.
4. Wang,
L., et al., Changes in hippocampal
connectivity in the early stages of Alzheimer's disease: Evidence from resting
state fMRI. NeuroImage, 2006. 31(2):
p. 496-504.
5. Wang,
K., et al., Altered functional
connectivity in early Alzheimer's disease: a resting-state fMRI study. Hum
Brain Mapp, 2007. 28(10): p. 967-78.
6. Zhang,
D. and M.E. Raichle, Disease and the
brain's dark energy. Nat Rev Neurol, 2010. 6(1): p. 15-28.
7. Nicolini,
P., et al., The prognostic value of heart
rate variability in the elderly, changing the perspective: from sympathovagal
balance to chaos theory. Pacing and Clinical Electrophysiology, 2012. 35(5): p. 621-637.
8. Schulz,
S., et al., Cardiovascular and
cardiorespiratory coupling analyses: a review. Philosophical Transactions
of the Royal Society of London A: Mathematical, Physical and Engineering
Sciences, 2013. 371(1997): p.
20120191.
9. Taylor,
B.J. and B.D. Johnson. The pulmonary
circulation and exercise responses in the elderly. in Seminars in respiratory and critical care medicine. 2010. NIH Public
Access.
10. Glover,
G.H., T.Q. Li, and D. Ress, Image-based
method for retrospective correction of physiological motion effects in fMRI:
RETROICOR. Magn Reson Med, 2000. 44(1):
p. 162-7.
11. Chang,
C. and G.H. Glover, Effects of
model-based physiological noise correction on default mode network
anti-correlations and correlations. Neuroimage, 2009. 47(4): p. 1448-59.
12. Birn,
R.M., et al., The respiration response
function: the temporal dynamics of fMRI signal fluctuations related to changes
in respiration. NeuroImage, 2008. 40(2):
p. 644-54.
13. Chang,
C., J.P. Cunningham, and G.H. Glover, Influence
of heart rate on the BOLD signal: the cardiac response function.
NeuroImage, 2009. 44(3): p. 857-69.
14. Bharat
Biswal, et al., Functional Connectivity
in the Motor Cortex of Resting Human Brain Using Echo-Planar MRI. Magnetic
Resonance in Medicine, 1995. 34(4):
p. 537-541.
15. Gorges,
M., et al., Functional Connectivity
Within the Default Mode Network Is Associated With Saccadic Accuracy in
Parkinson's Disease: A Resting-State fMRI and Videooculographic Study.
Brain Connectivity, 2013. 3(3): p.
265-272.
Figures
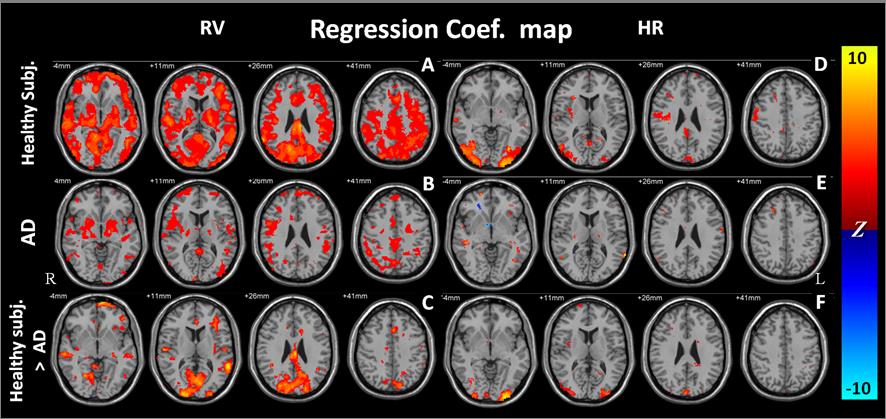
The contrast between healthy elderly and AD patients were shown at the bottom row. Significance level: p < 0.001 (FDR corrected; cluster threshold: 30 voxels)
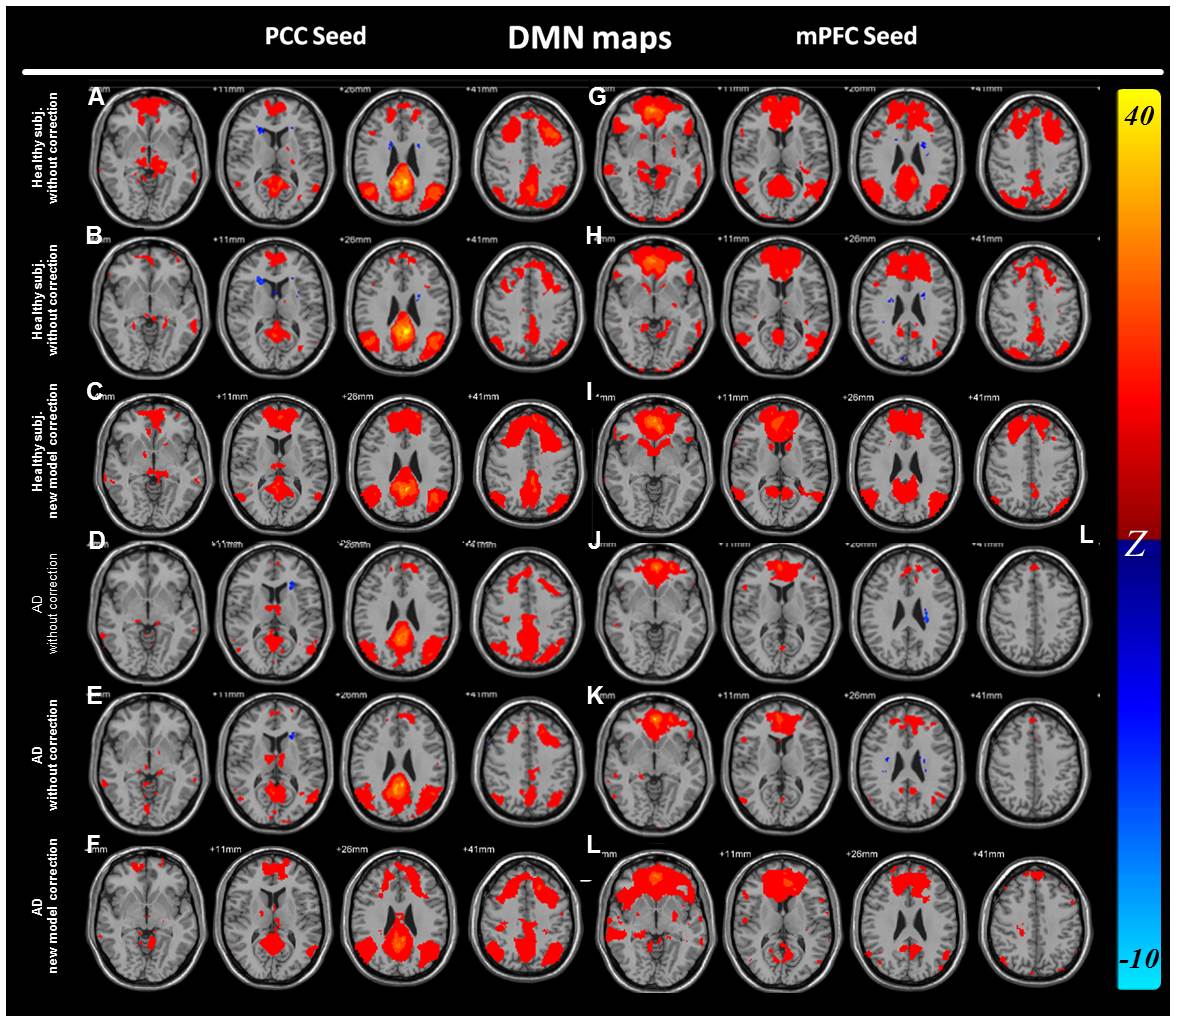
Figure
2 DMN map (A-D: seed at PCC; E-H: seed
at mPFC)
A, G: Healthy subjects: without suppression
B, H: Healthy subjects: with suppression
C, I: Healthy subjects: suppress with new
RRF/CRF
D, J: AD patients: without suppression
E, K: AD patients: with suppression
F, L: AD patients: suppress with new RRF/CRF
Significance level: p < 0.001 (FDR corrected; cluster
threshold: 30 voxels)
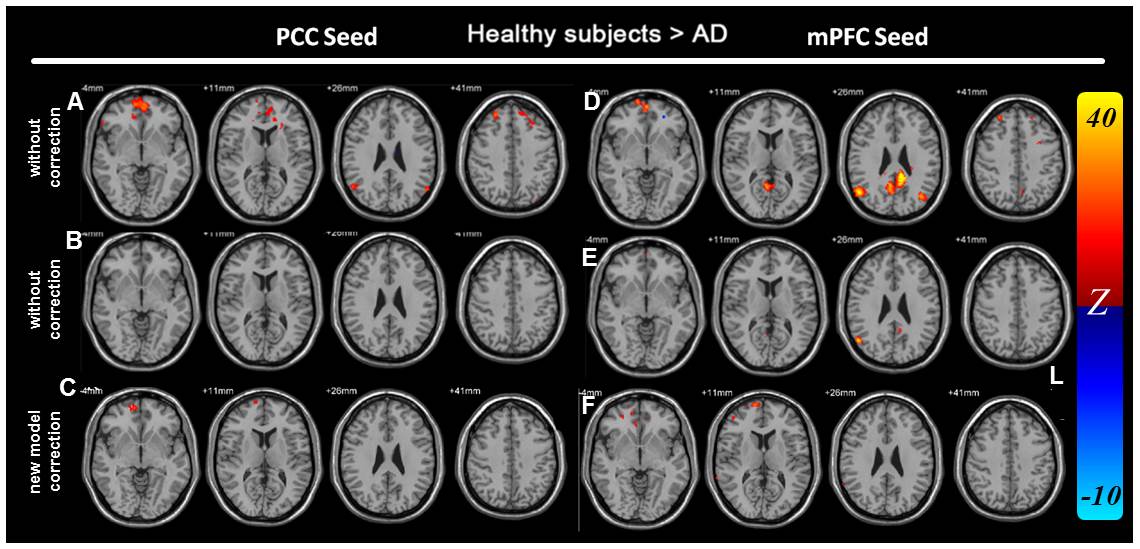
Figure
3
Main effect of Healthy elderly > AD (A-C: seed at PCC; D-F: seed at
mPFC)
A, D: without noise suppression
B, E: with noise suppression
C, F: noise suppression with
population-specific RRF and CRF
Significance level: p < 0.001 (FDR corrected; cluster
threshold: 30 voxels)
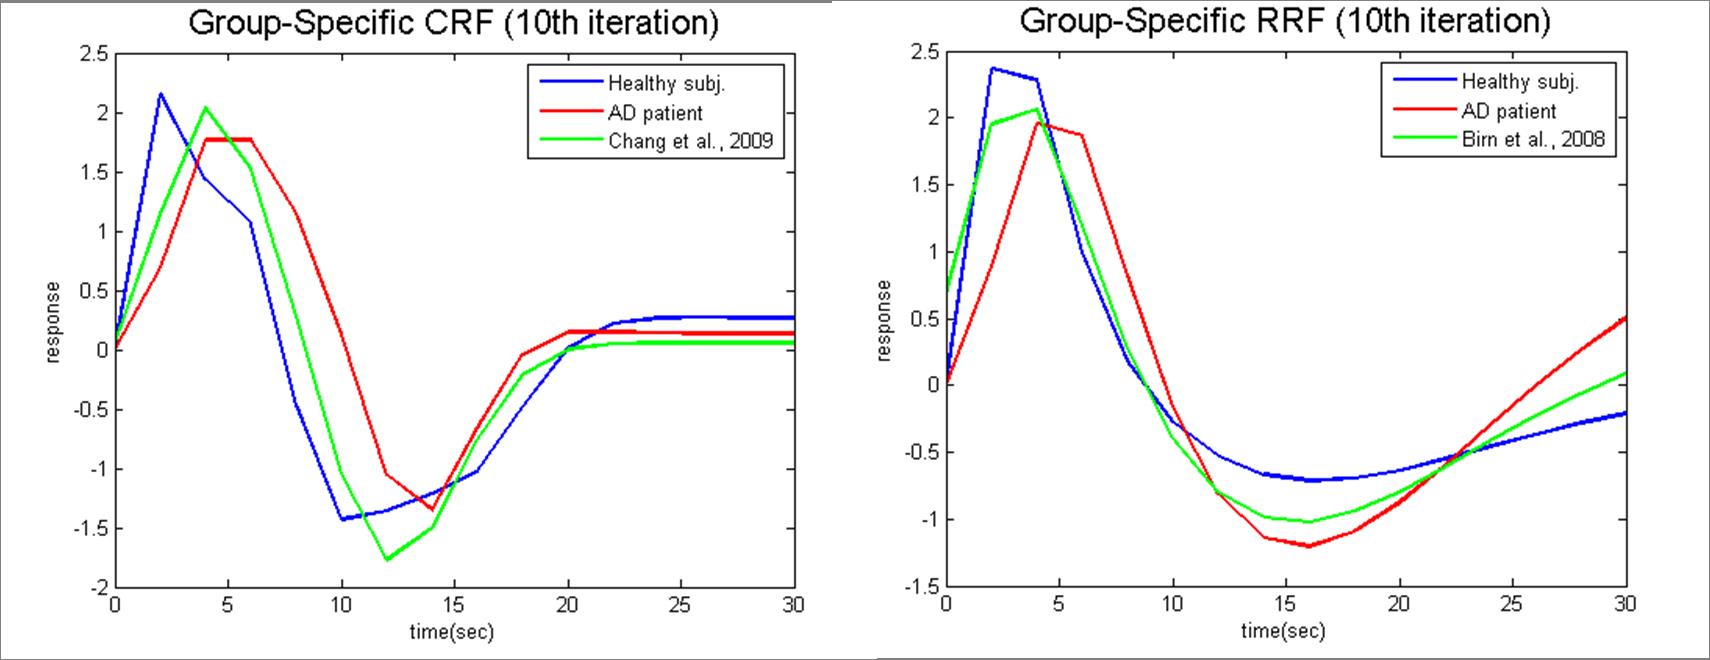
Figure
4 Group specific CRF (the
left) and RRF (the right).
The green lines
indicated the previous published response functions, while the blue lines
indicated the healthy controls’ and the red indicated the AD patients’ response
functions.