2369
Hippocampal T1-weighted and FLAIR contrast is associated with CSF biomarkers in asymptomatic individuals with parental history of Alzheimer’s disease1Cerebral Imaging Centre, Douglas Mental Health Institute, Montreal, QC, Canada, 2Douglas Mental Health Institute, Montreal, QC, Canada
Synopsis
Cerebrospinal fluid (CSF) β-amyloid and phosphorylated-tau are consistently used as biomarkers related to the pathophysiology and clinical severity of individuals in the earliest phases of Alzheimer’s disease (AD). This study shows that T1-weighted and FLAIR signal intensity in the hippocampal subfields, normalized using the fimbria, are associated with ApoE4 status and CSF biomarkers. The FLAIR results suggest that presence of inflammation in the subiculum of ApoE4 carriers and in the CA1 and molecular layers of the hippocampus in subjects with low CSF β-amyloid burden as tau pathology increases.
Introduction
Cerebrospinal fluid (CSF) biomarkers and hippocampal (HC) subfield morphometry have consistently been used as biomarkers individuals early in the disease course of Alzheimer’s disease (AD). We have recently shown that total HC, cornu ammonis (CA) 1, and subiculum volumes are decrease with phosphorylated-tau (p-tau) but increase with CSF β-amyloid1-42 (Aβ) in healthy subjects with a parental history of AD1. Here we investigated the biological underpinnings of these morphological differences, in particular neuroinflammation, using T1-weighted (T1w) and T2-weighted fluid-attenuated inversion recovery (FLAIR) MRI contrasts in the same cohort.Methods
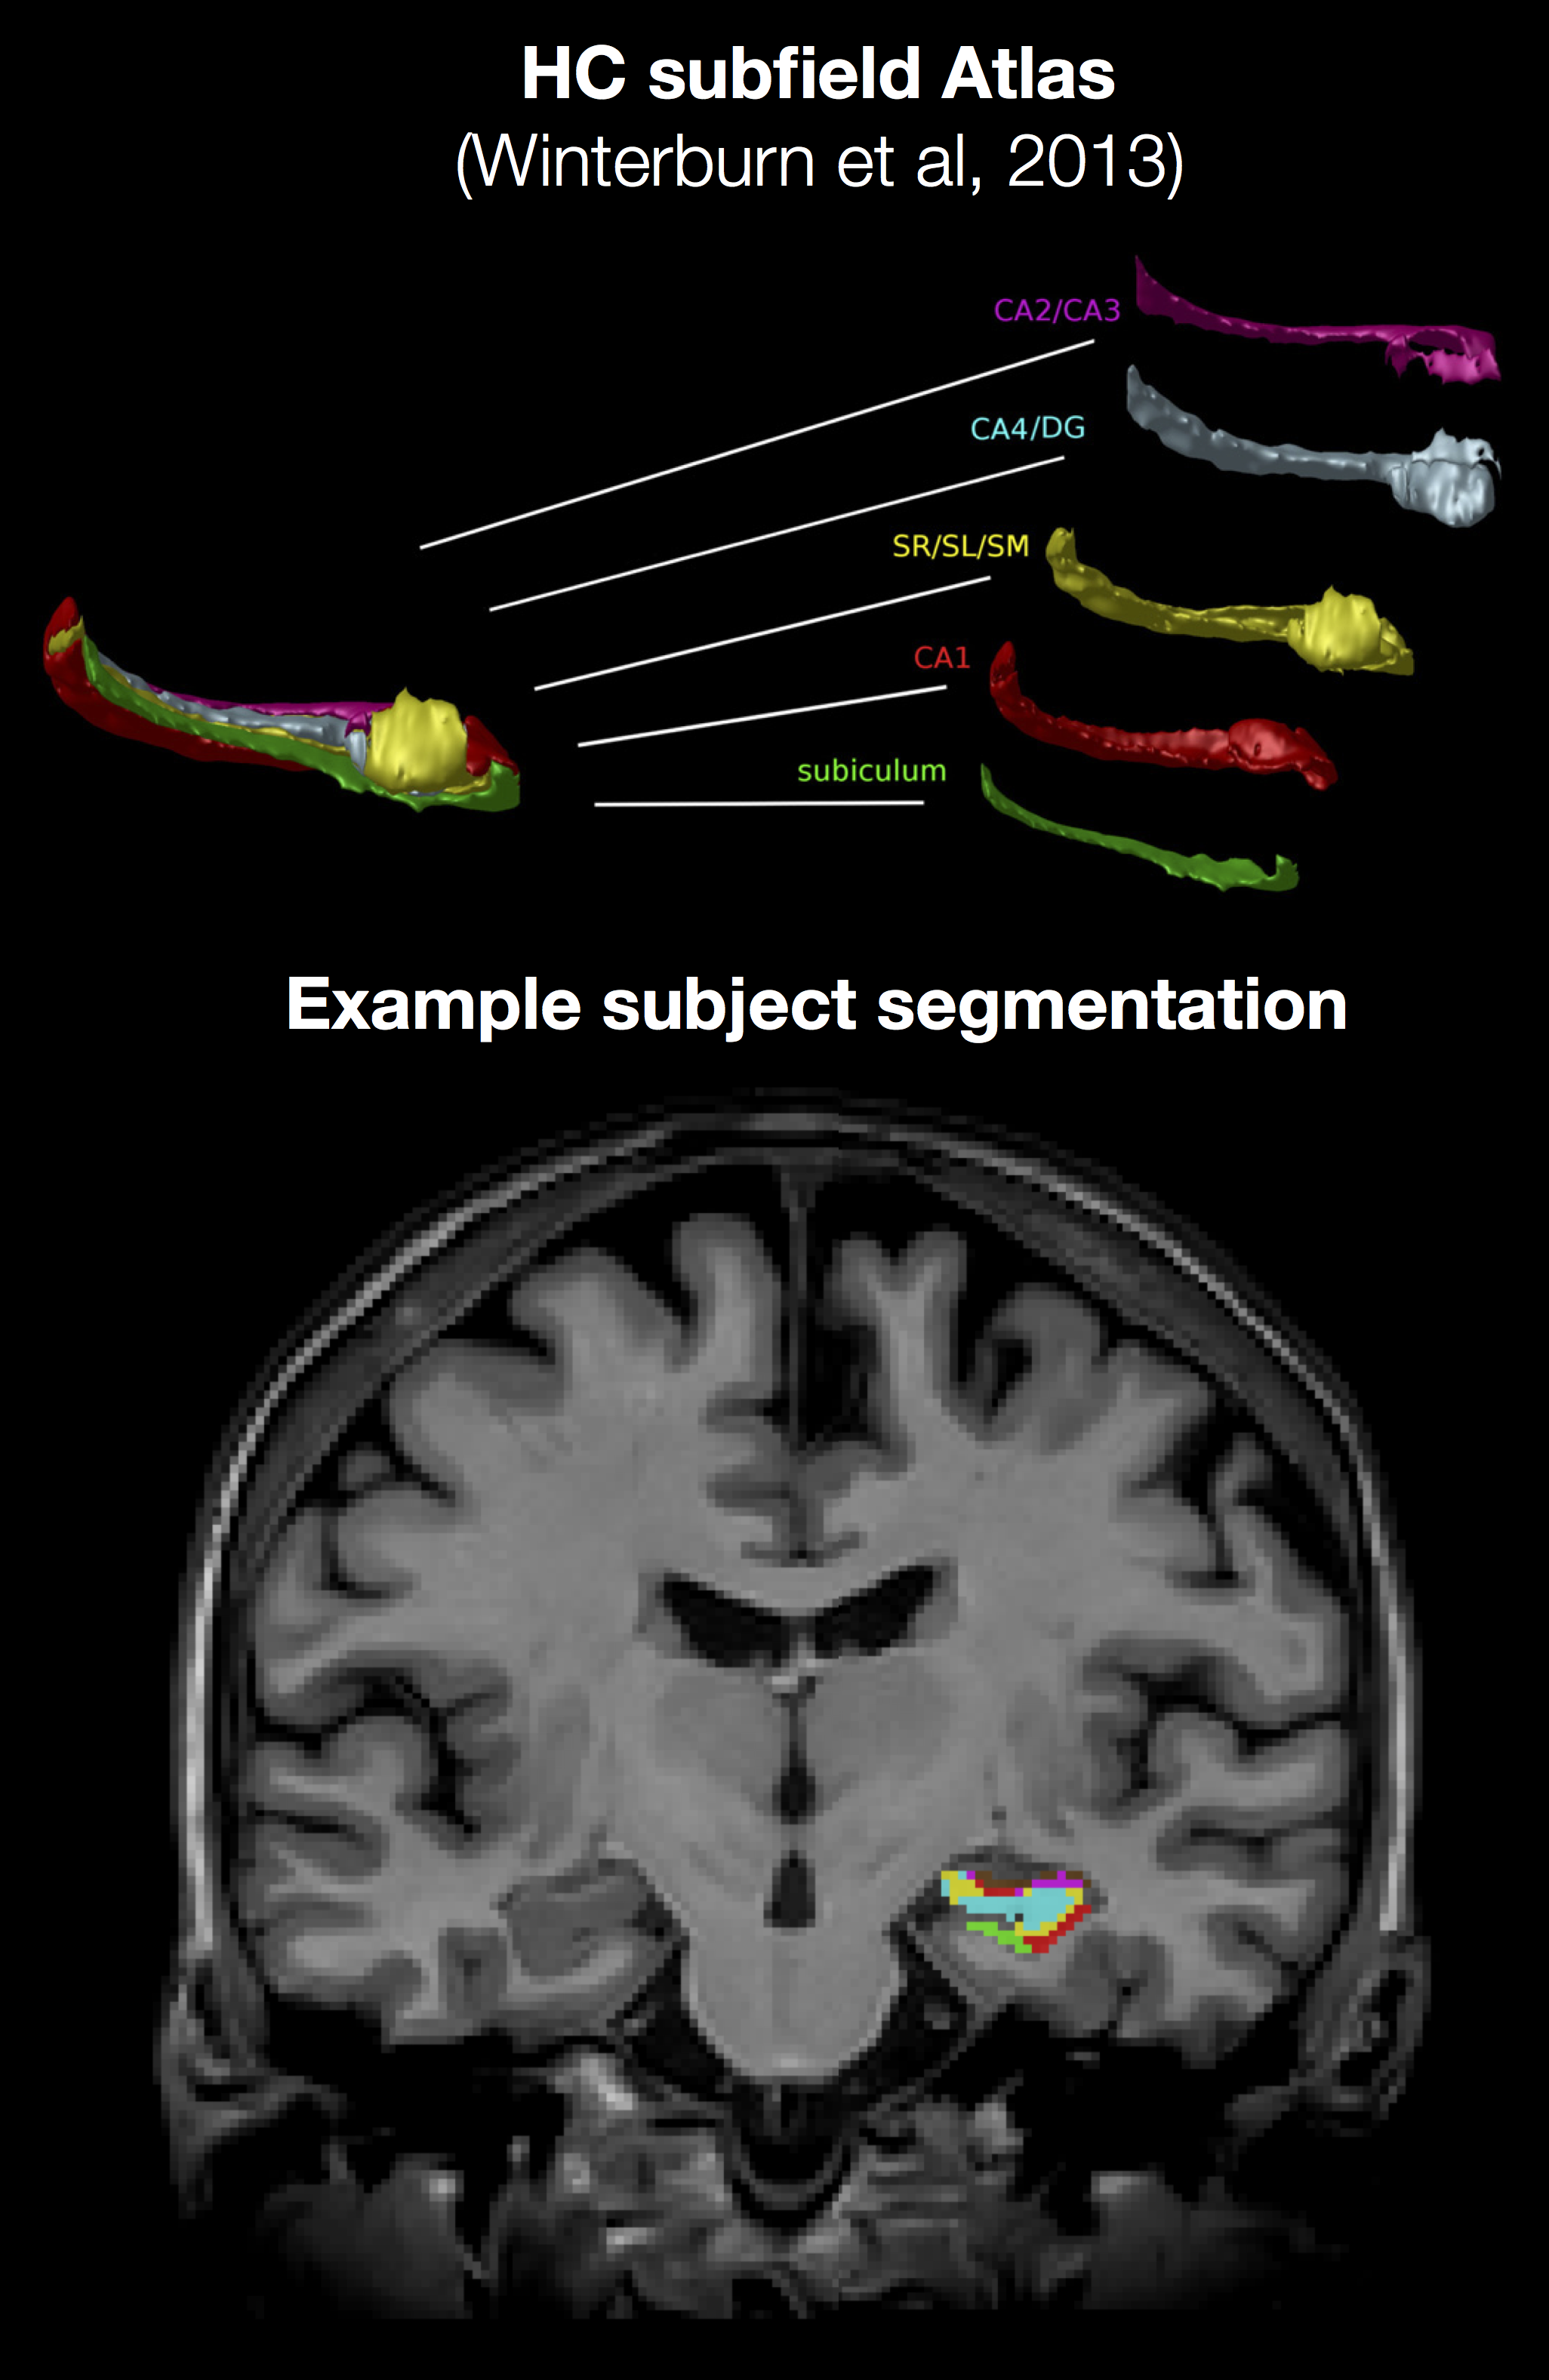
We analyzed baseline data from a longitudinal investigation of 95 individuals (62.8 (5.5) years of age, 29/66 male/female) who had a parental history for AD but were cognitively healthy. The subjects underwent a lumbar puncture to assay CSF Aβ and p-tau levels using Innotests ELISA, and were genotyped for Apolipoprotein E4 (ApoE4) status. T1-weighted MPRAGE (TI=900ms, TE=5ms, ⍺=9◦, TR=2300ms, ~9mins) and T2-weighted FLAIR (TI=1800ms, TE=389ms, ⍺=12◦, TR=5000ms, ~6mins) structural brain images at 1mm3 were acquired on a 3T Siemens Trio with a 12-channel coil. Preprocessed2 T1-weighted images were segmented using MAGeTbrain3 to label the HC subfields4 and HC white matter5. The T1w and FLAIR signal intensities were averaged within each subfield, shown in Figure 1, and normalized with respect to the average intensity of the fimbria. We are thus effectively comparing local tissue contrast across subjects to minimize methodological confounds in conventional weighted images (such as B1 field non-uniformity). We calculated the meanT1w/FLAIR subfield signal ratio as another method of normalization. Statistical analysis was performed in R using linear models that include gender, age, age until parental onset of AD, ApoE4 status, p-tau, Aβ, and p-tau by Aβ interaction.Results
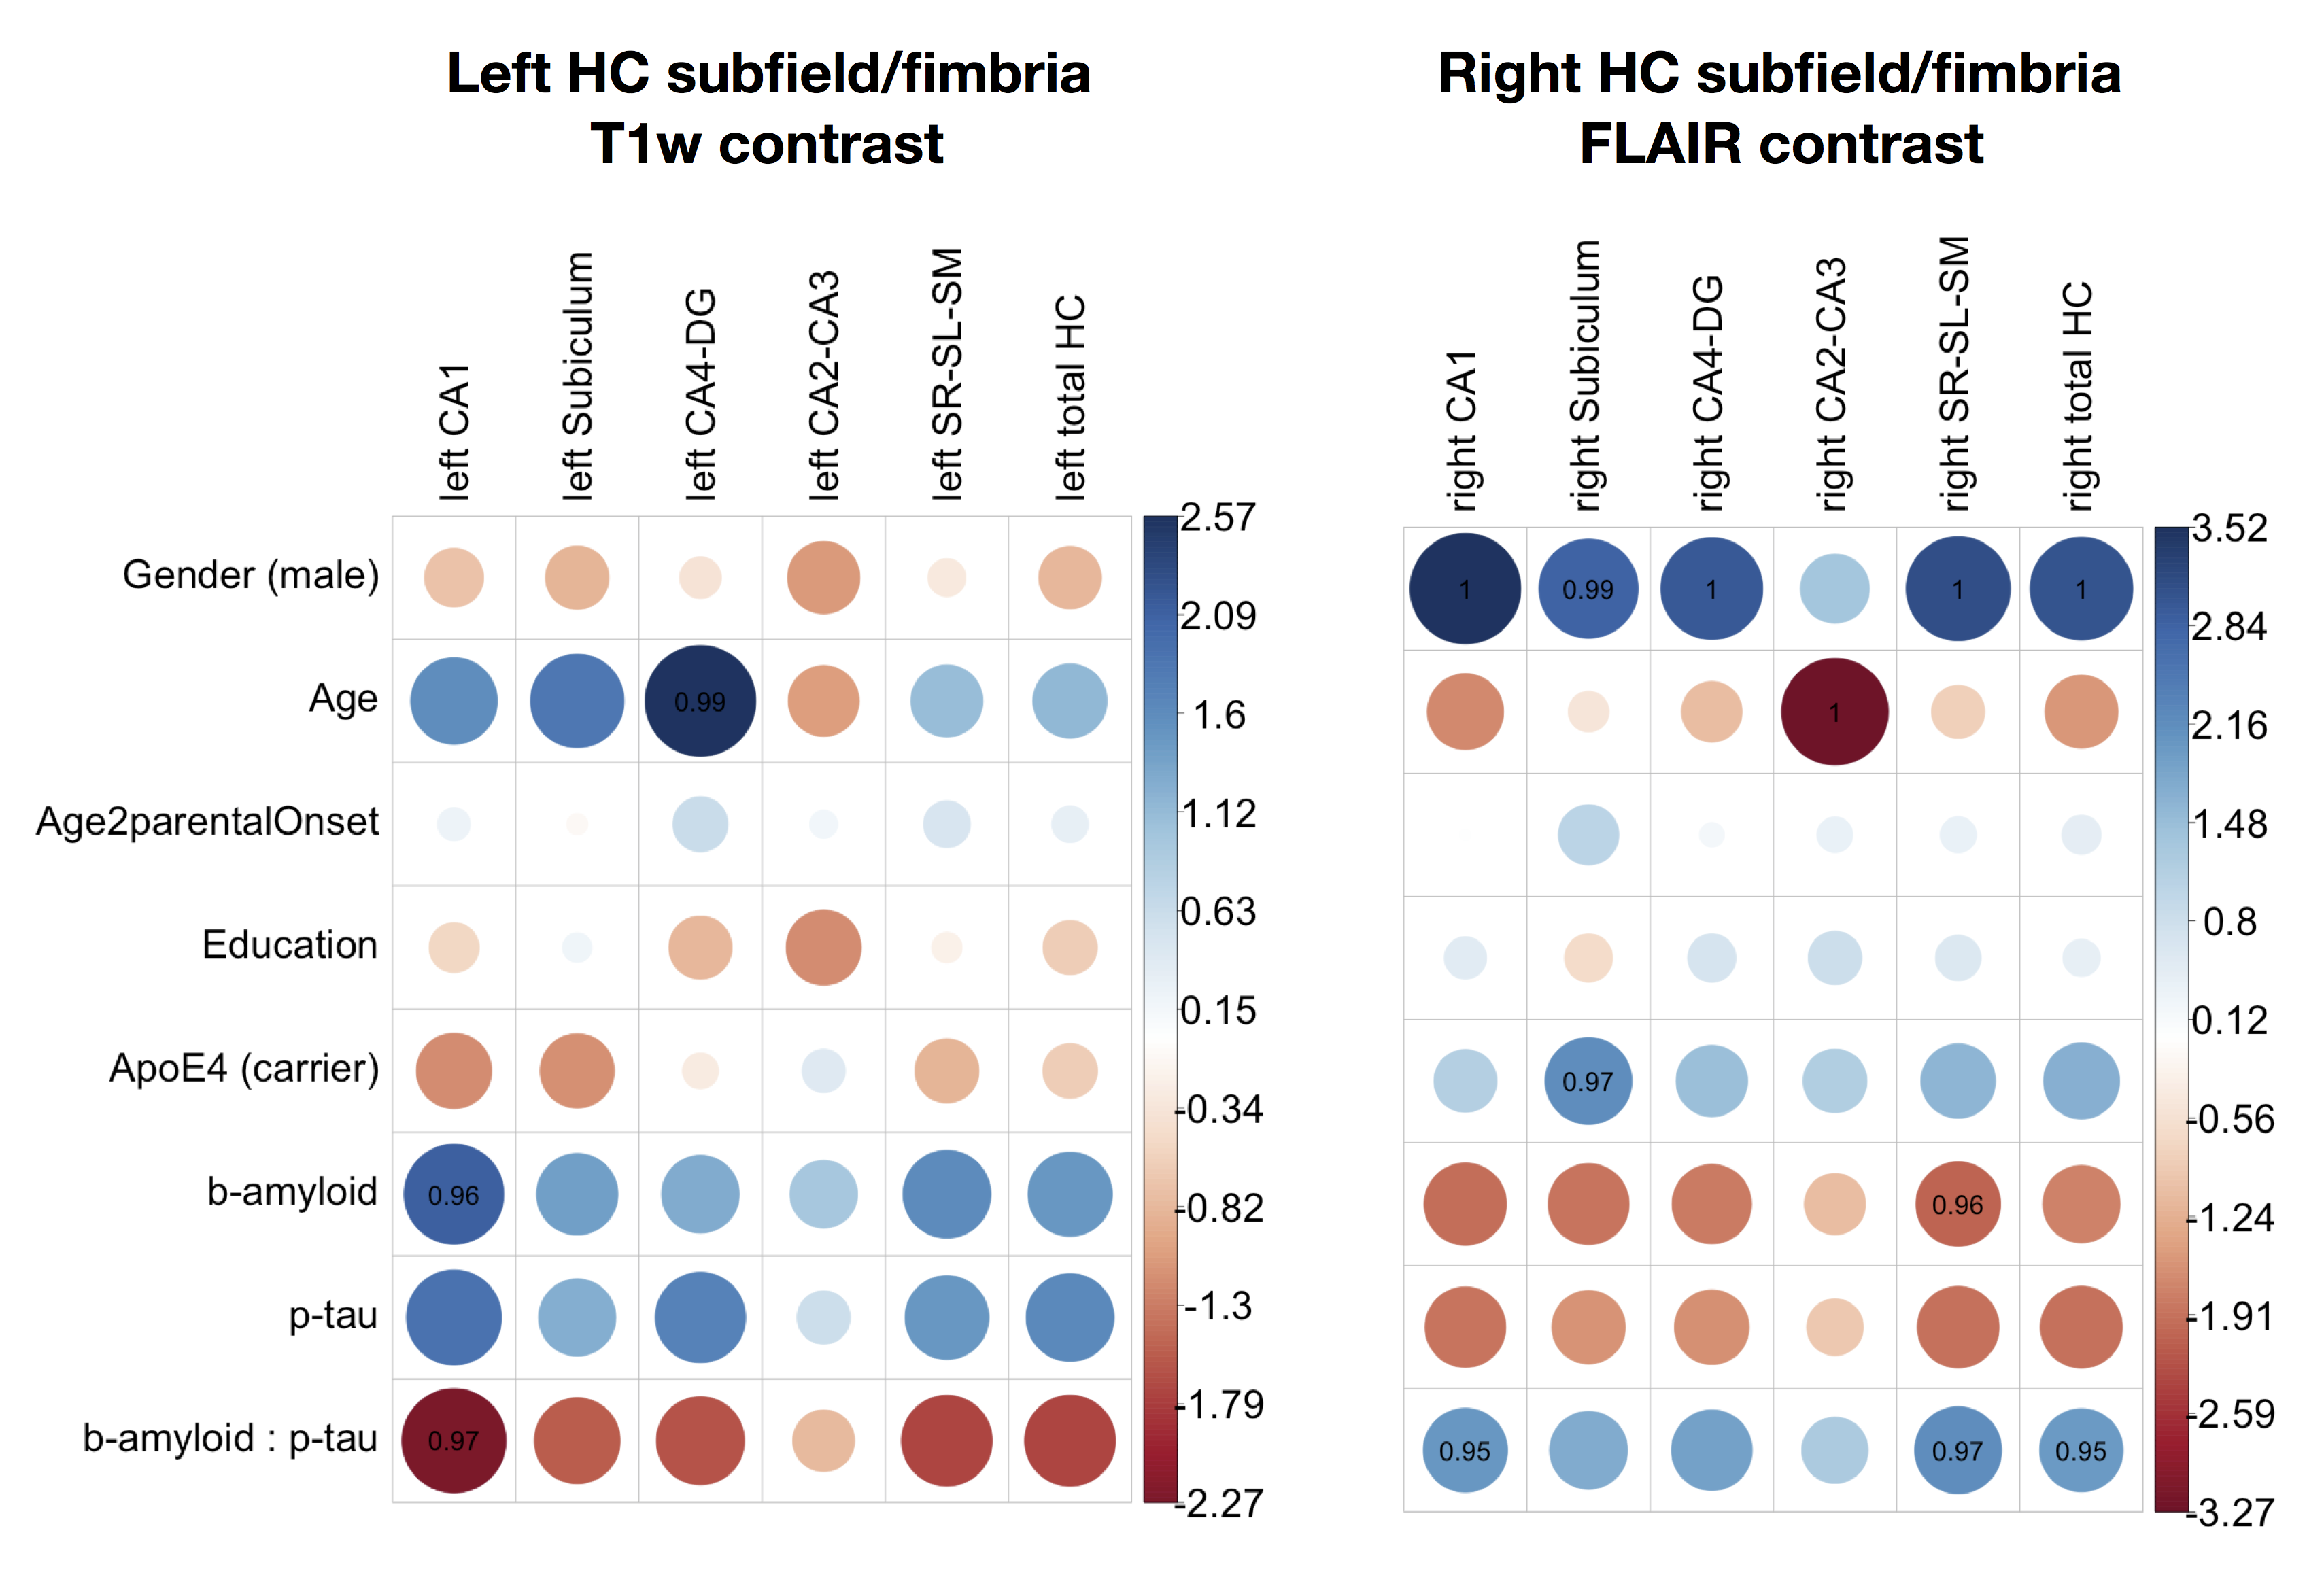
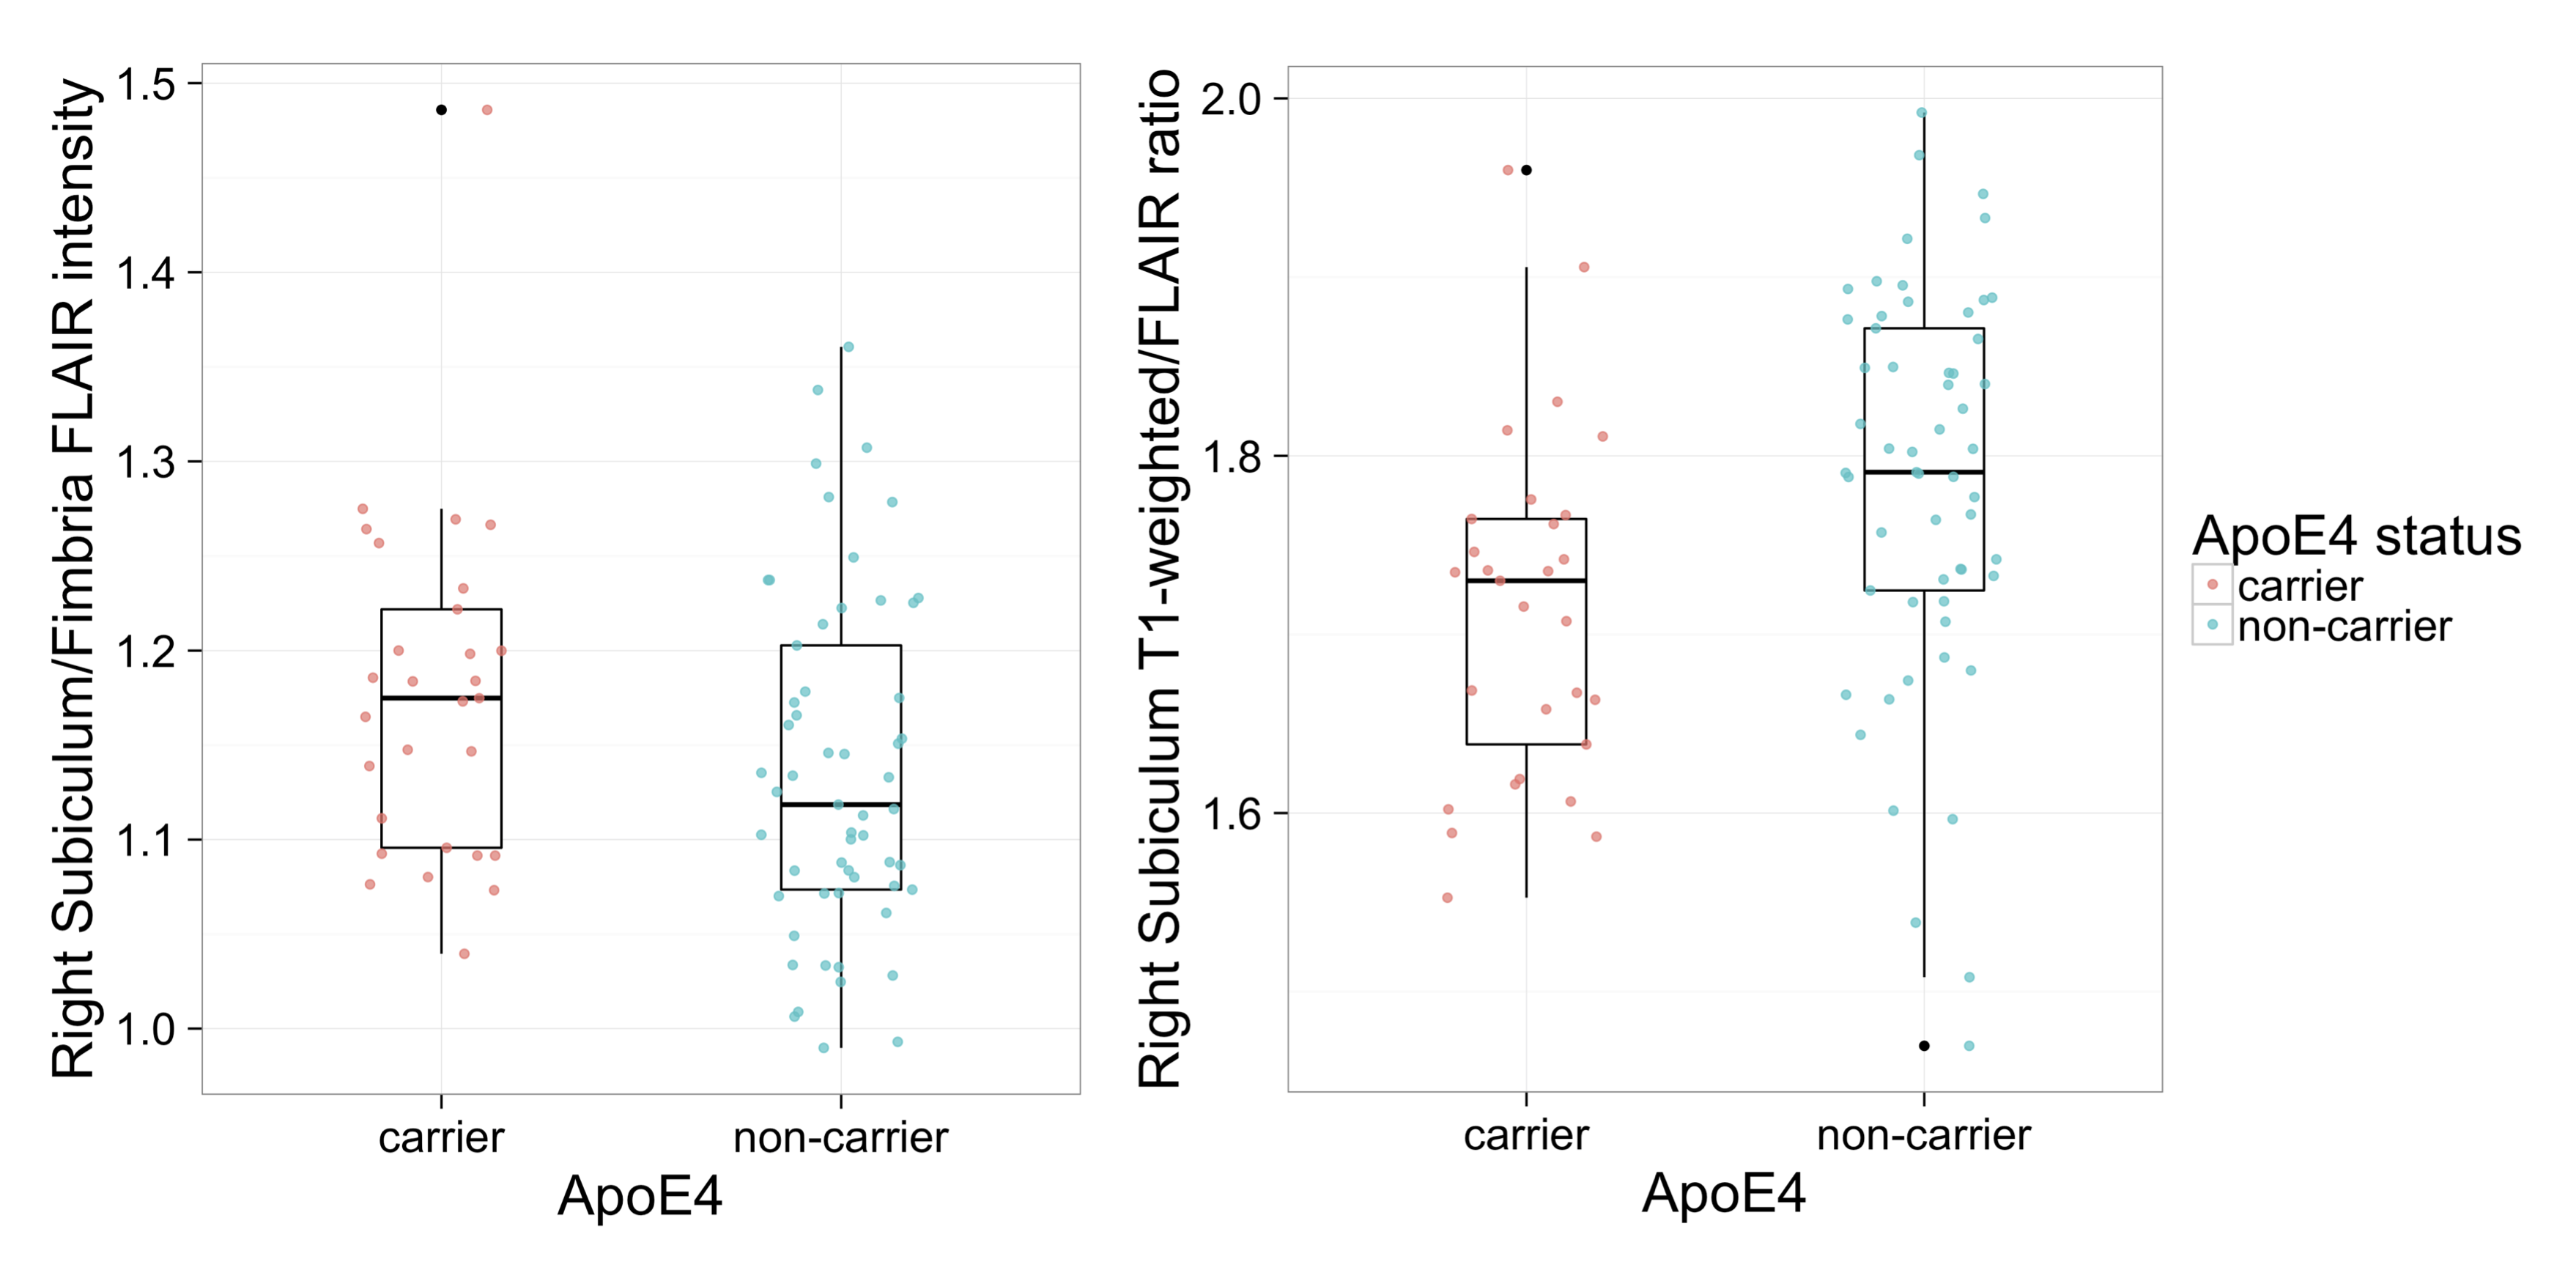
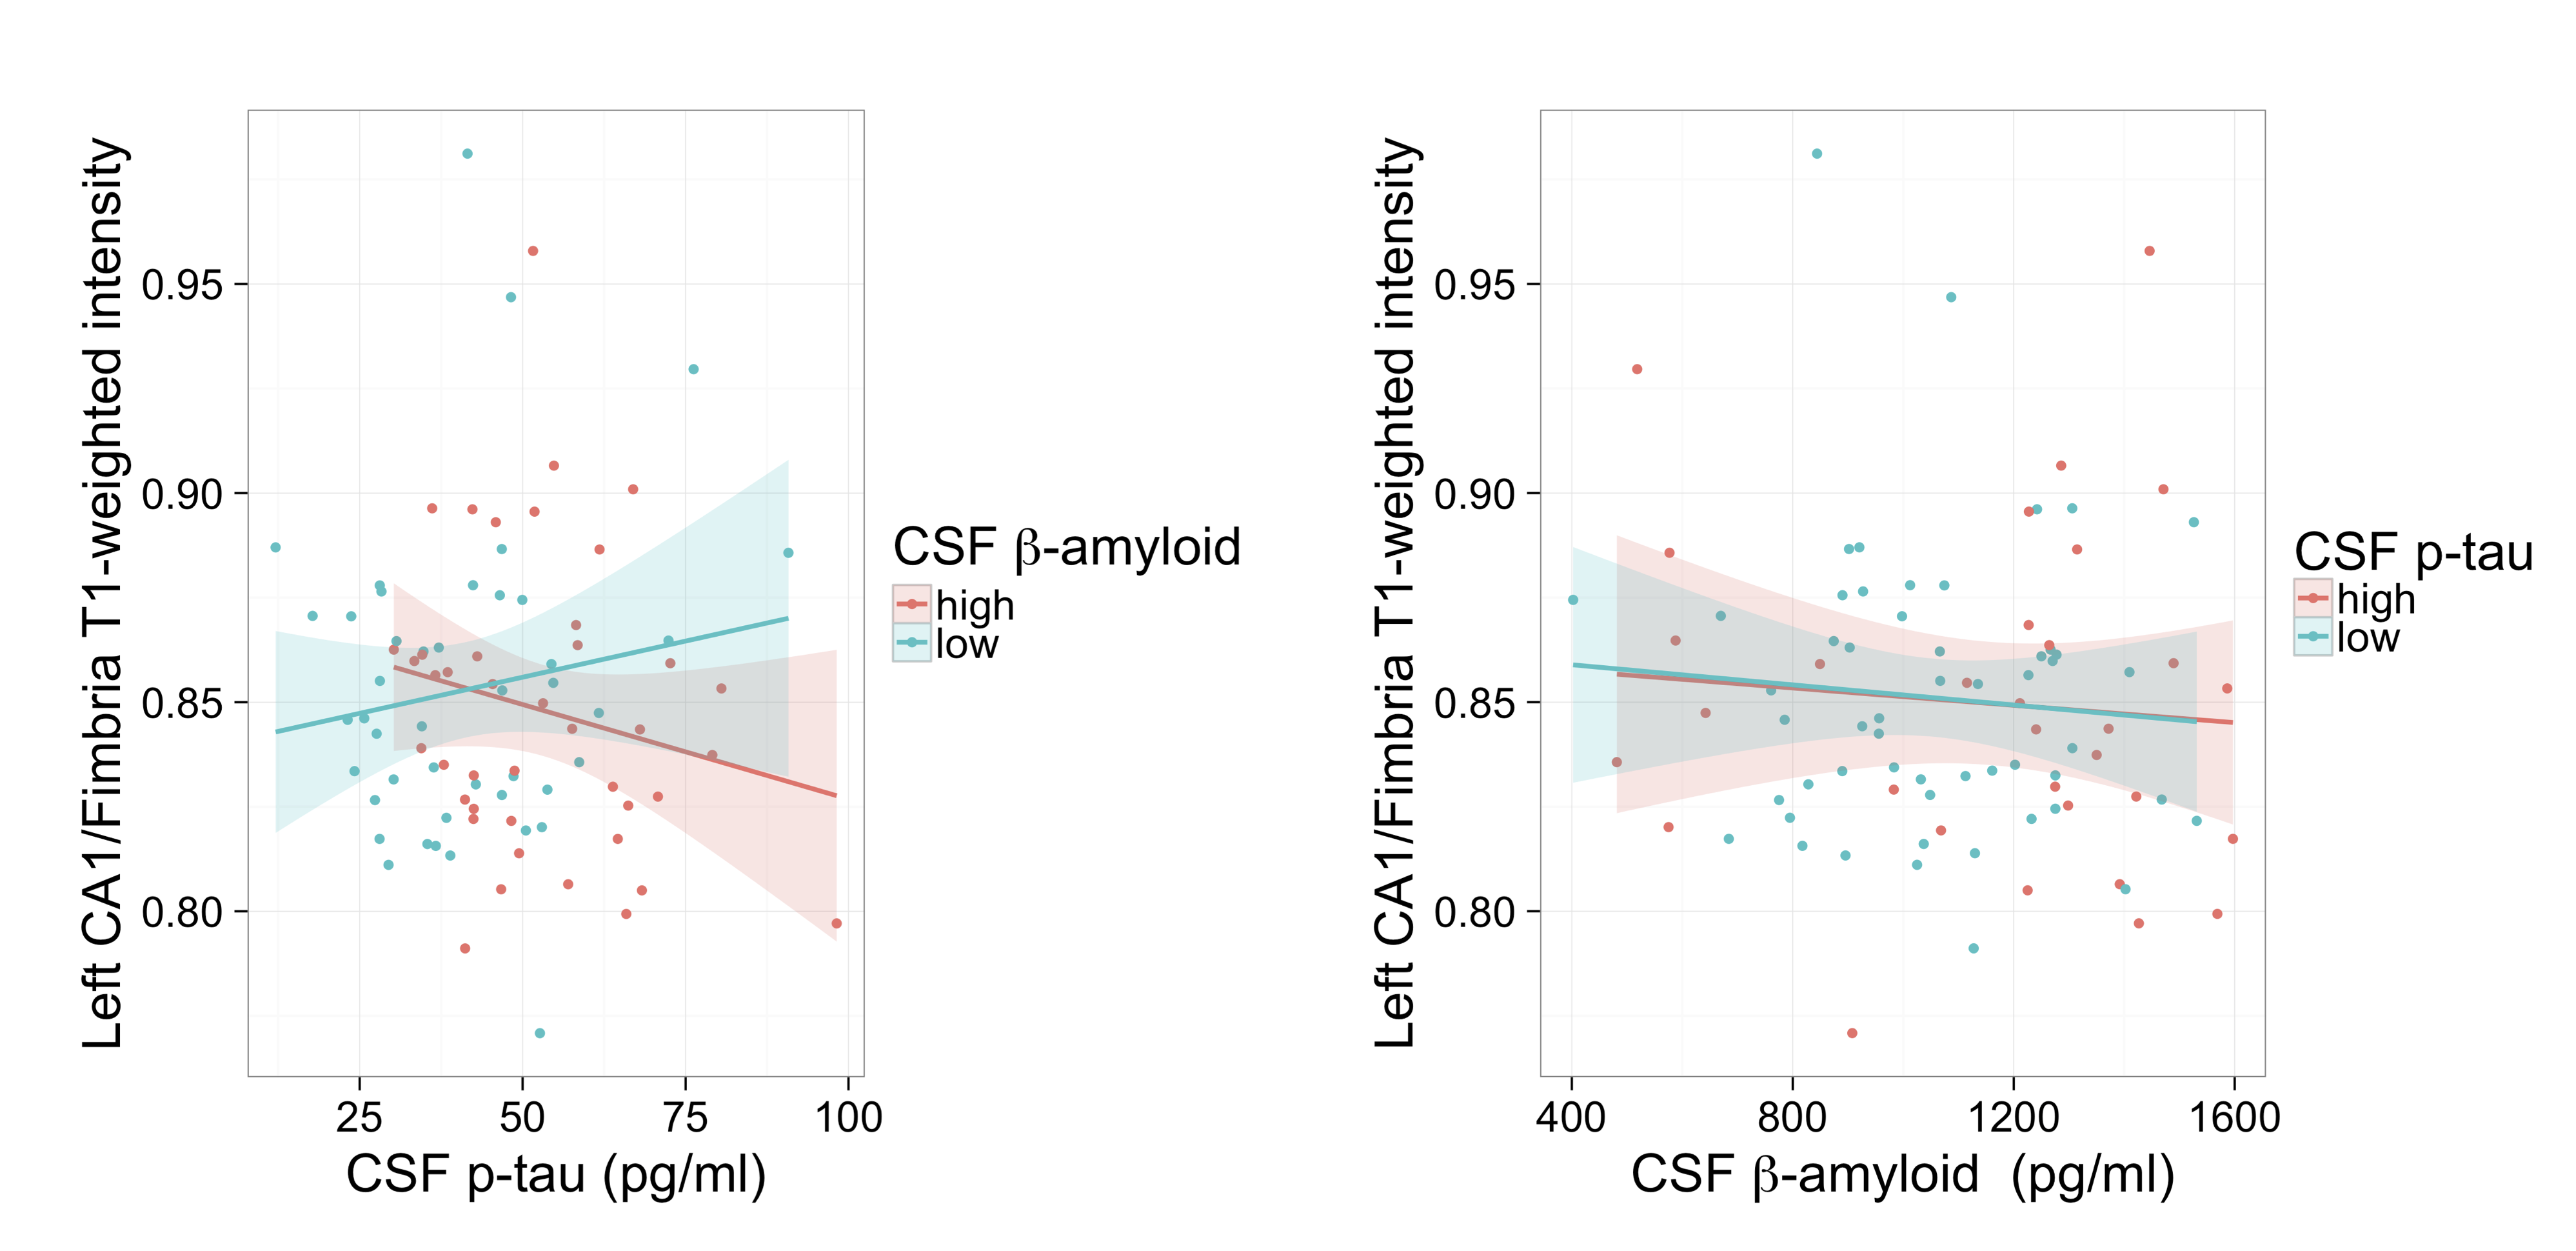
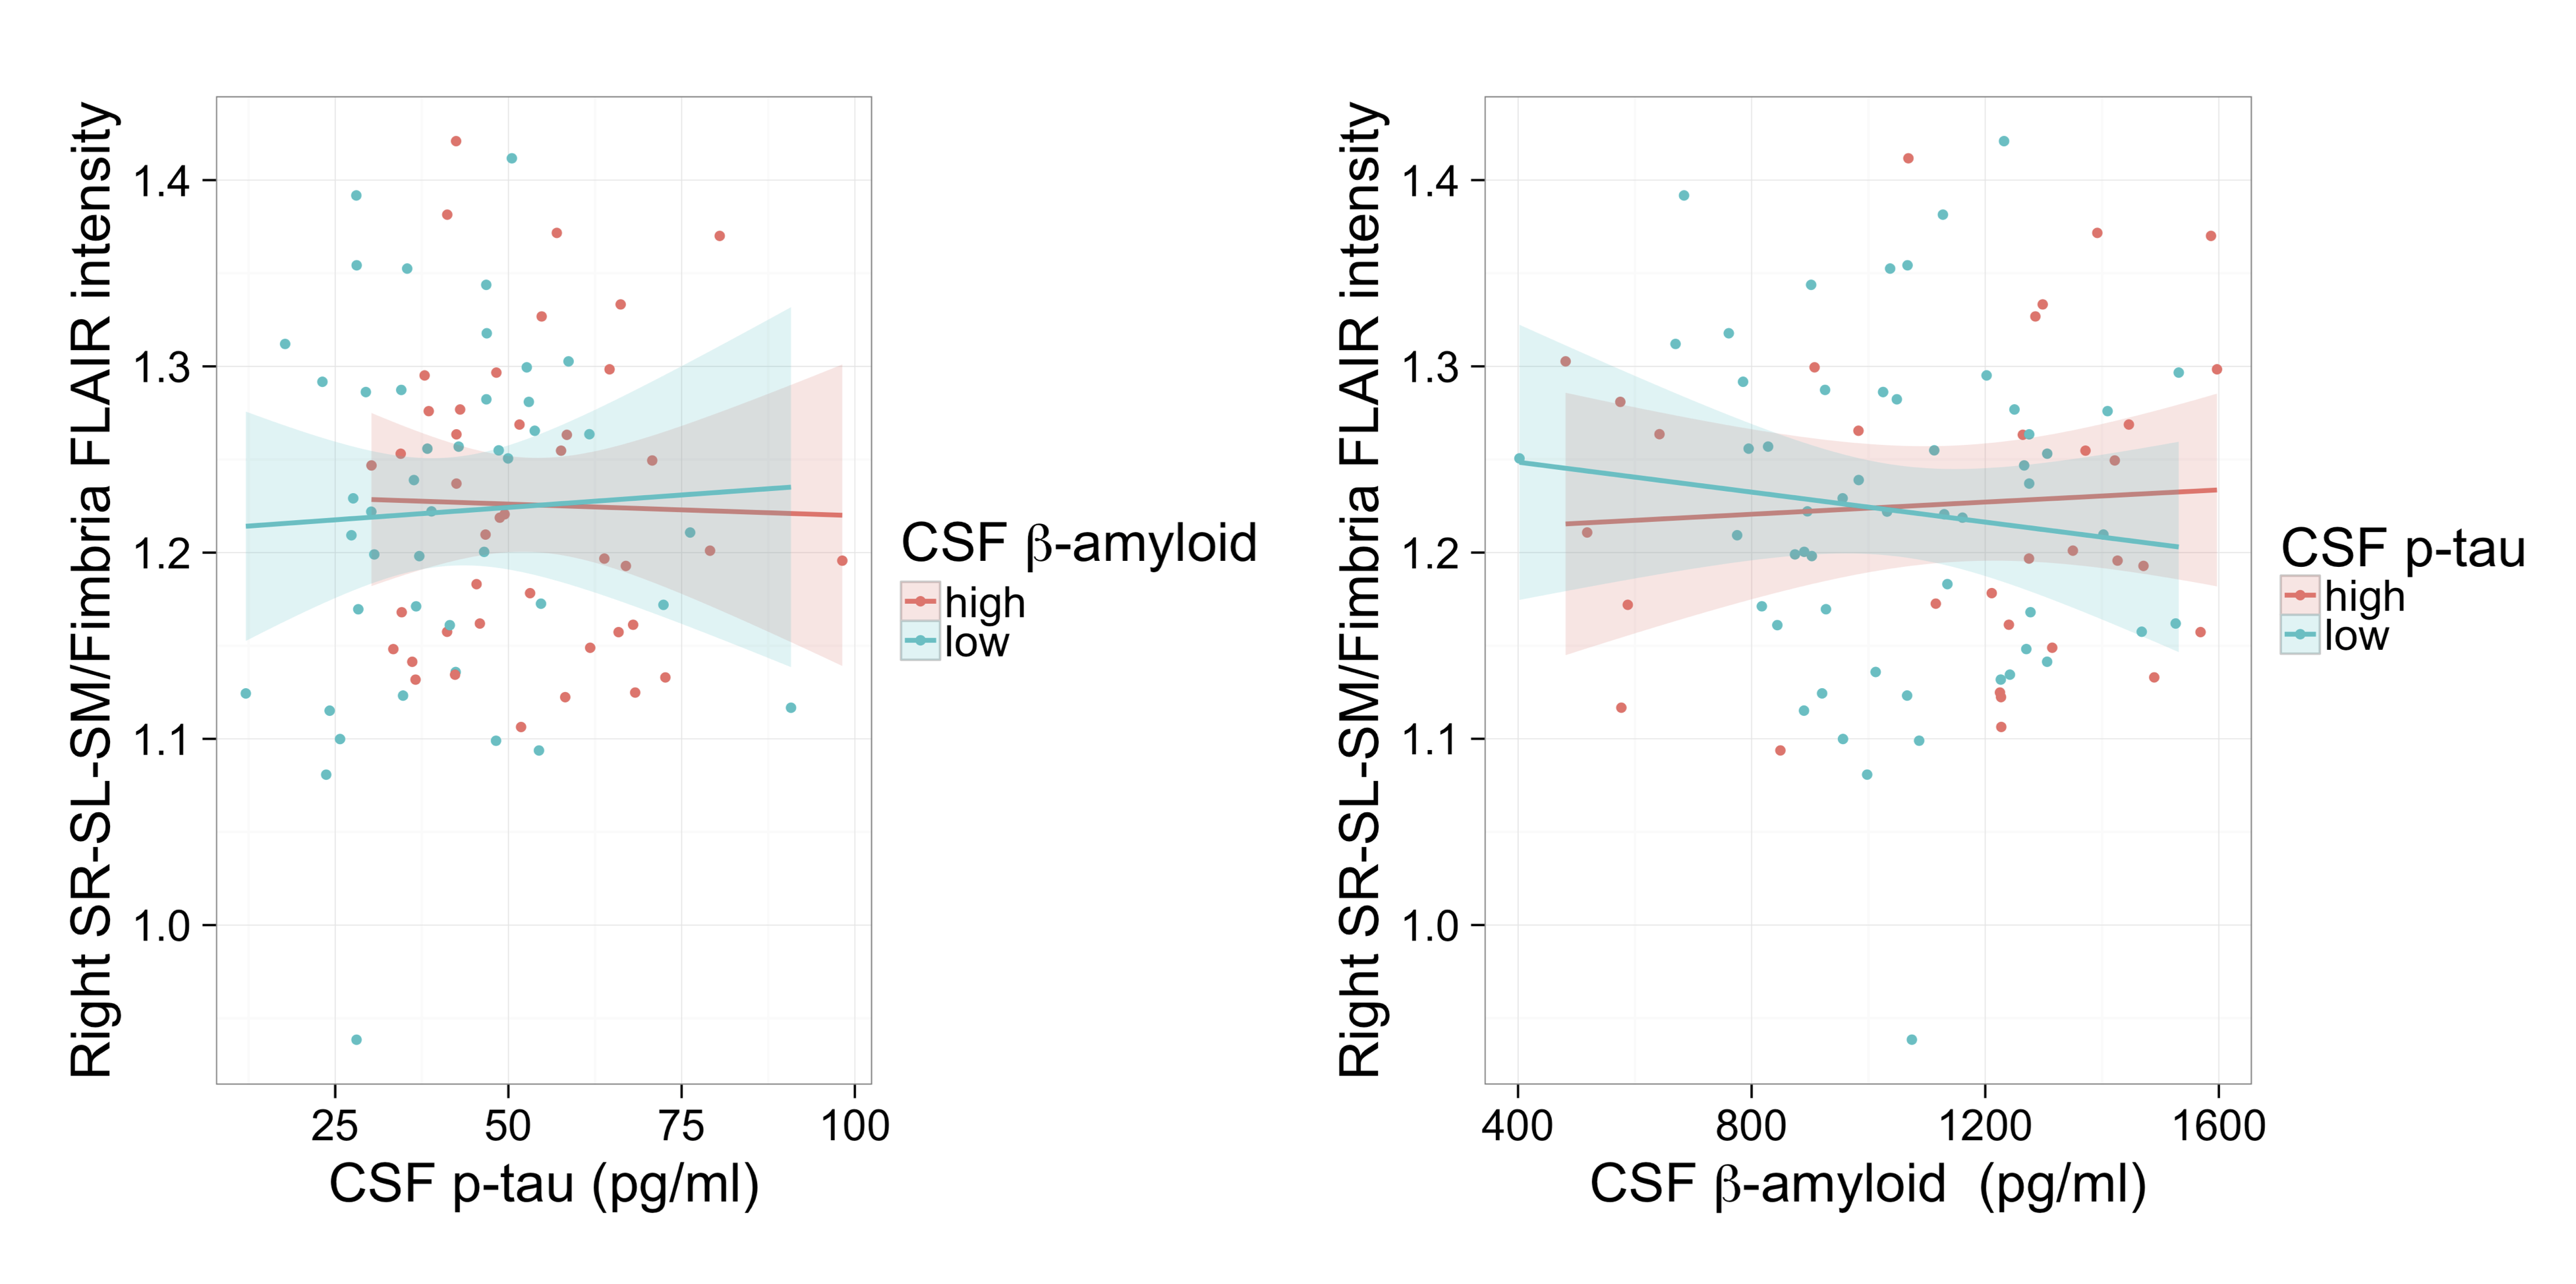
The resulting t-statistics for each linear model are represented as a row in Figure 2. The significant terms are indicated by overlaying (1-p-value). ApoE4 was significant for the left and right subiculum/fimbria FLAIR contrast and subiculum T1w/FLAIR ratio. As shown in Figure 3, ApoE4 carriers have a higher subiculum/fimbria FLAIR contrast as well as a lower subiculum T1w/FLAIR ratio than ApoE4 non-carriers. In the left hemisphere, there was a significant association of CA1/fimbria T1w contrast with Aβ and Aβ:p-tau interaction. We dichotomized the subjects into groups of high/low Aβ (Aβcutoff=1125 pg/ml) and high/low p-tau (p-taucutoff=50 pg/ml). In subjects with low CSF Aβ (i.e. high brain tissue Aβ), CA1/fimbria T1w contrast increases with p-tau (Figure 4). In the right hemisphere, there was a similar association of SL-SR-SM/fimbria FLAIR contrast with Aβ and Aβ:p-tau interaction. SL-SR-SM/fimbria FLAIR contrast increases with p-tau in low-CSF Aβ subjects, and increases with CSF Aβ in high-p-tau subjects (Figure 5). The association between MR contrasts and CSF biomarkers were not significant for the other subfields. We did not detect an association between T1w/FLAIR ratio and CSF biomarkers.Discussion
The findings from our MR contrast analyses (T1w and FLAIR) complements our previous volumetric analysis of the HC and its subfields. Our FLAIR and T1w results suggest the presence of neuroinflammation causing oedema in the CA1 and molecular layers (SR-SL-SM) of the hippocampus in subjects with high brain Aβ burden as tau pathology increases. The data also show that the T1w contrast decreases in subjects with low brain Aβ, putatively due to neurodegeneration. While the T1w/FLAIR data trends were consistent with the T1w and FLAIR contrast results, T1w/FLAIR contrast was less sensitive. This is likely because both T1w and FLAIR signal increase with inflammation (FLAIR being most sensitive). A limitation of our study is the use of the fimbria signal intensity for normalization. We assumed that in this asymptomatic young cohort, AD pathology (if present) would minimally affect the fimbria, but this may not be the case and would mislead the interpretation of our results.Conclusion
HC subfield T1w and FLAIR contrasts appear to be sensitive biomarkers of pathology in the early asymptomatic phase of AD. Future work will focus on whether these baseline MR biomarkers will predict future neuroanatomical degeneration and cognitive decline. This work also motivates the acquisition of quantitative MR contrasts at high resolution (<1mm) to further elucidate the early pathogenesis of the disease and potentially to evaluate with improved sensitivity and specificity the impact of preventative interventions.Acknowledgements
No acknowledgement found.References
1. Tardif C L, Devenyi G A, Rosa-Neto P, et al. Hippocampus and subfield volumes are associated with CSF β-amyloid and phospho-tau and their interaction in asymptomatic individuals with parental history of Alzheimer’s disease. Society for Neuroscience Annual Meeting, San Diego, 2016.
2. minc-bpipe-library for image preprocessing: https://github.com/CobraLab/minc-bpipe-library
3. Pipitone J, Park M T M, Winterburn J, et al. Multi-atlas segmentation of the whole hippocampus and subfields using multiple automatically generated templates. NeuroImage 101, 494-512 (2014).
4. Winterburn J L, Pruessner J C, Chavez S, et al. A novel in vivo atlas of human hippocampal subfields using high-resolution 3 T magnetic resonance imaging. NeuroImage 74, 254-265 (2013).
5. Amaral R S C, Park M T M, Devenyi G A, et al. Manual segmentation of the fornix, fimbria, and alveus on high-resolution 3T MRI: Application via fully-automated mapping of the human memory circuit white and grey matter in healthy and pathological aging. NeuroImage (2016).
Figures