2362
Demonstration of Abnormal Cortical Layers In Alzheimer's Disease Using Subtracted Tissue Attenuated Inversion Recovery (STAIR) Pulse Sequences1Radioliogy, Univ. of California, San Diego, San Diego, CA, United States
Synopsis
The use of subtracted STIR images designed to null white and gray matter respectively is illustrated in formalin fixed brain samples at 11.7T. The images show the normal layers of the cerebral cortex with high contrast. The layers were less well seen, or not seen at all in Alzheimer’s Disease samples. Use of MT pulses with the STIR sequences produces high positive and negative contrast on difference images. The STIR subtraction technique made have general application, and be used with different forms of data acquisition. It may also be useful in other clinical situations for demonstrating changes due to small differences in T1 in the presence of long T1 fluids.
Introduction
One of the interesting features about the inversion recovery (IR) pulse sequence is that contrast for small differences in T1 is maximal about the null point. This property was exploited in short inversion time inversion recovery (STIR) pulse sequences where fat is nulled. This has the advantages that imaging contrast is high for tissues with T1 somewhat longer than that of fat and that T1 and T2 contrast is additive in this range.
Another possibility is to null white matter in one image with a short TI, and null gray matter in a second image with a longer TI, then use magnitude reconstruction with both images and subtract the first image from the second (or vice versa). The resulting difference image has a contrast range covering the magnitude of the gray matter signal at the first TI added to the magnitude of the white matter signal at the second TI. This is greater than that obtained with a single nulled image at either TI. In addition, long T1 fluids have zero or near zero signal on the subtraction images and do not impact on the image display characteristics.
As a supplement, magnetization transfer (MT) pulses can be applied before or after the inversion pulse (or at both times) and these change the available longitude magnetization and the effective T1 of the tissue free pool and so can change its nulling time (2). This can create both positive and negative MT contrast relative to the non-MT prepared image. Application of these approaches to produce high contrast images of the layers of the cerebral cortex is illustrated in normal and Alzheimer’s’ disease (AD) tissue samples imaged at 11.7T.
Material and Methods
Four histologically verified normal and AD neocortical brain formalin fixed samples immersed in Fomblin were imaged at 11.7T using a Bruker Biospin (Billerica, MA) 117/16 system. The samples were imaged in an 8mm custom TX/RX solenoid as well as the system 60mm birdcage resonator.
2D multi slice sequences (TR=1500ms, TI1=300ms or TI2=400ms, TE=7.63ms were used with 50x50x500 μm3) (8mm coil) and 100x100x500 μm3 (60mm coil) voxel sizes. NEX was 8-15 giving a total scan time of approximately 30 mins for each sequence.
An MT pulse (Gaussian, 6ms duration, 1500°, 1500 Hz off-resonance) was also applied prior to the inversion pulse as a supplement. The sequences had TI=350ms but otherwise used the same parameters as described previously. Scans were performed without, and with MT.
Magnitude reconstruction was used for all the images and subtraction of the later image (longer TI) from the first (or vice versa) or with from without MT (or vice versa) was then performed.
Results
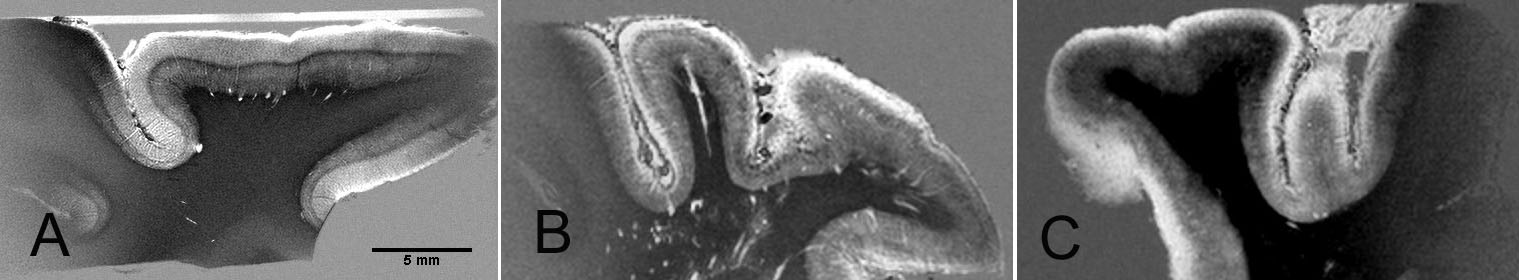
Difference images obtained from images with TIs of 300ms and 400ms respectively are shown in Figures 1 A, B, and C. (Normal, AD sample 1, AD sample 2). In the normal image (Fig 1A) high signal is seen in the outer layers of the cortex. A reduced signal is seen in layer IV with intermediate signal elsewhere in the cortex. Very low signal is seen in the most superficial layer of the underlining white matter, and slightly higher signal than this is seen in the remaining white matter. These signals are negative relative to the zero signal of the surrounding background. In image 1B (AD) there is poorer definition of the cortical layers and in image 1C (AD) the layers appear even more blurred.
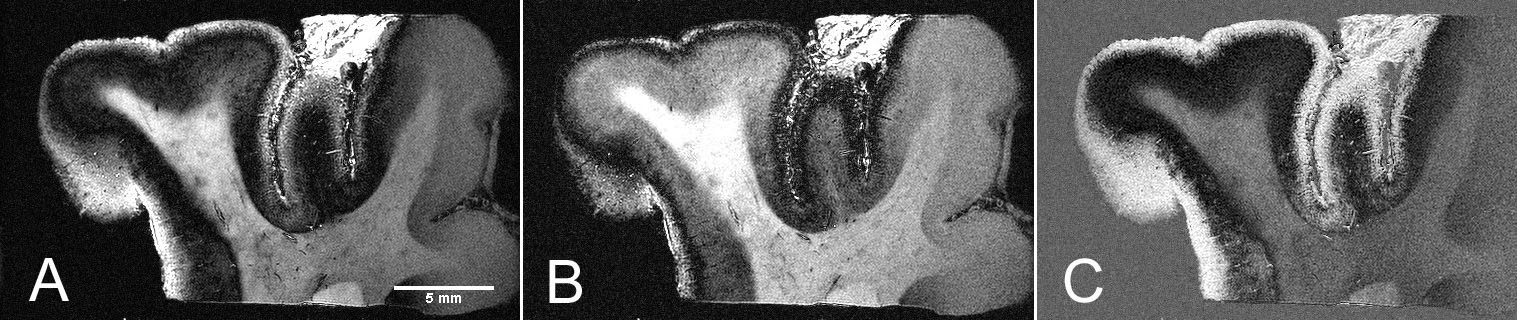
In Fig 2A (TI=350ms image of AD, sample 2) high contrast in
the cortex is shown. Fig 2B is an image with the same parameters but MT
applied. Fig 2C is the difference image obtained from Fig 2A and Fig 2B. This
shows high signal in the outer cortex and low signal in the inner cortex as a
consequence of the MT pulse. The signal from white matter shows little change.
Discussion
The results show that high contrast images of the cerebral cortex and white matter can be obtained by subtraction of two STIR images that are nulled for white matter and gray matter. The MT effect is an additional contrast mechanism because of its effect on the observed magnetization (reduced) and the observed T1 (reduced) of the free pool. The sequence may have wider applications in demonstrating small changes due to differences in T1 in the presence of long T1 fluids such as imaging articular cartilage and the liver. It is also likely to be well suited to use with other forms of data acquisition, including fast spin echo and rapid acquisition with gradient echoes (RAGE) (3).Acknowledgements
No acknowledgement found.References
1. Bydder GM, Young IR, J Comput Assist Tomogr 1985;9:659-75.
2. Hajnal JV, Baudouin CJ, Oatridge A, Young IR, Bydder GM, J Comput Assist Tomogr 1992;16:7-18.
3. Marques JP, Gruetter R, 2013; PLoS ONE 8(7): e69294. doi:10.1371/journal.pone.0069294.
Figures