2359
Hippocampal atrophy is correlated to cerebrospinal fluid levels of ceruloplasmin, neuroinflammation and total tau in Alzheimer’s diseaseAzhaar Ahmad Ashraf1 and Dr Po-Wah So1
1Neuroimaging, Institute of Psychiatry, Psychology and Neuroscience, King's College London, London, United Kingdom
Synopsis
The aim of the study was to characterise the relationship between cerebrospinal fluid (CSF) iron regulatory proteins (ferritin, ceruloplasmin), neuroinflammation and MRI-derived hippocampal volume in healthy controls, mild cognitive impairment and Alzheimer’s disease subjects. Ceruloplasmin positively correlated with neuroinflammation and ferritin in MCI and AD while in the latter group, it was negatively correlated with hippocampal volume. Ferritin positively correlated with neuroinflammation in HC and AD but also with tau levels in MCI. Iron dyshomeostasis, neuroinflammation and tau metabolism may increase hippocampal atrophy and aggravate AD pathogenesis.
Introduction
Hippocampal atrophy is recognised as a specific marker for tracking disease progression in Alzheimer’s disease (AD)1. Cerebrospinal fluid (CSF) ferritin2 and ceruloplasmin3, cellular proteins that store iron and export iron, respectively, are associated with AD pathology, suggesting iron dysregulation operates in AD. The aim of this study was to determine the relationship between iron regulatory proteins, Aβ and tau (AD biomarkers), neuroinflammation indicated by glial fibrillary acidic protein (GFAP), an astrocyte marker, and osteopontin (expressed by reactive astrocytes and microglia)4, with hippocampal volumes.Methods
The following ADNI data was downloaded from age-matched 84 healthy control (HC), 124 mild cognitive impairment (MCI) and 55 AD subjects: CSF ceruloplasmin, ferritin, GFAP, osteopontin, Aβ, total tau and phosphorylated tau, MRI-derived volumes of hippocampus, entorhinal cortex, fusiform and ventricles acquired at 1.5T-MRI. Pearson’s correlation analysis was used to elucidate the relationship between CSF ceruloplasmin or ferritin with the other CSF measures and hippocampal volumes. If significant correlation was observed (p < 0.05) between ceruloplasmin or ferritin with hippocampal volume, a two-stage hierarchical multiple regression model was applied with ceruloplasmin at stage one of regression followed by GFAP, osteopontin, Aβ, total tau and phosphorylated tau at stage two, and hippocampal volume as the dependent variable.Results and Discussion
CSF ceruloplasmin was not correlated with neuroinflammation, AD biomarkers or hippocampal volume in HC. Ceruloplasmin positively correlated with ferritin (R2 = 0.036, p = 0.031), GFAP (R2 = 0.052, p = 0.009) and osteopontin (R2 = 0.048, p =0.012) in MCI and also in AD (figure 1). However, in the latter, ceruloplasmin also negatively correlated with hippocampal atrophy (R2 = 0.132, p = 0.002). Hierarchical multiple regression testing demonstrated that ceruloplasmin significantly contributed to the regression model accounting for 12.3% of the variation in hippocampal volume, with GFAP (β = -0.535, p = 0.005) and total tau (β = 0.471, p = 0.019) explaining an additional 22.4% of the variation. Ferritin positively correlated with GFAP (R2 = 0.141, p < 0.001) and osteopontin (R2 = 0.116, p <0.001) in HC but also correlated to ceruloplasmin, total tau (R2 = 0.093, p < 0.001) and phosphorylated tau (R2 = 0.068, p = 0.003) in MCI whereas ferritin positively correlated to ceruloplasmin (R2 = 0.152, p = 0.002), GFAP (R2 = 0.279, p < 0.001) and osteopontin (R2 = 0.194, p = 0.001) in AD. Increased CSF ferritin seems to be associated with inflammation in the elderly and may interact with tau metabolism to drive early AD pathology4. CSF ceruloplasmin, on the other hand, appears to act in synergy with astrogliosis and tau metabolism in AD to increase hippocampal atrophy and enhance AD pathology.Conclusion
Ceruloplasmin and ferritin are involved in iron metabolism which appears dysregulated in AD5 and supports therapies to restore metal homeostasis may be beneficial to AD.Acknowledgements
No acknowledgement found.References
(1) Schröder J, Pantel J. Psychiatry Res. 2016; 247: 71-78 (2) Ayton S, et al. Nat.Commun. 2015; 6: 6760 (3) Loeffler D.A., et al. Alzheimer Dis.Assoc.Disord. 1994; 8: 190-197 (4) Park J.-M, et al. J.Histochem.Cytochem (2012); 60: 550-559 (5) Zheng W, Monnot AD. Pharmacol Ther. 2012; 133: 177-188.Figures
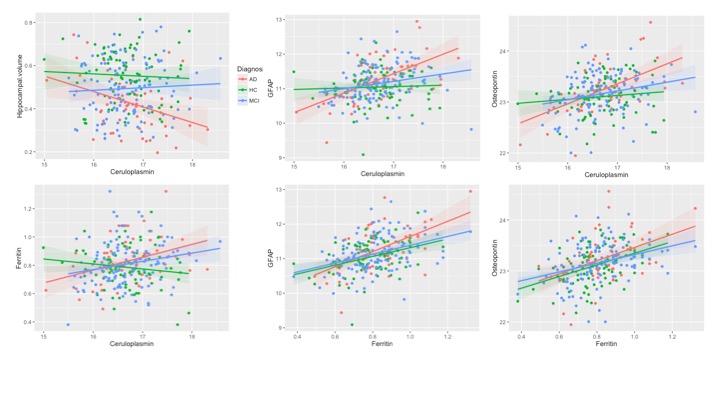
Figure
1. Top: left to right: Significant Pearson’s correlations (p < 0.05) between
CSF ceruloplasmin and hippocampal volume in AD (R2 = 0.132); CSF ceruloplasmin
and CSF GFAP in MCI (0.052) and AD (0.573); CSF ceruloplasmin and CSF osteopontin
in MCI (0.048) and AD (0.577). Bottom: left to right: CSF ceruloplasmin and CSF
ferritin in MCI (0.036) and AD (0.152); CSF ferritin and CSF GFAP in HC (0.365),
MCI (0.376) and AD (0.279); CSF ferritin and CSF osteopontin in HC (0.433), MCI
(0.340) and AD (0.194).