2358
A Potential Biomarker of Alzheimer's Disease: T1sat of the Thalamus1Department of Computer Science, State University of New York at Binghamton, Binghamton, NY, United States, 2Department of Radiation Oncology, Washington University, St Louis, MO, United States, 3Center of Neuroscience, University of Pittsburgh, PA, United States, 4Department of Psychology, University of Pittsburgh, PA, United States, 5Department of Psychiatry and Neurology, University of Pittsburgh, PA, United States
Synopsis
Biomarkers for Alzheimer’s disease (AD) are crucial for early diagnosis and treatment monitoring once therapies become available. In this study, the spin-lattice relaxation time in the rotating frame with (T1sat) and without (T1nosat) off-resonance saturation was measured at 1.5 T in the cardiovascular health study cognition study cohort. Cross-sectional and longitudinal studies of the normalized difference (ΔT1RF) between T1sat and T1nosat revealed regions of statistical significance in the brain that are associated with dementia pathogenesis. ΔT1RF changes in the thalamus were consistent for the cross-sectional and longitudinal studies, indicating that ΔT1RF could be a promising imaging biomarker for AD.
Purpose
Biomarkers for Alzheimer’s disease (AD) are crucial for early diagnosis and treatment monitoring. T1sat is T1 in the rotating frame measured using RF irradiation with a frequency offset that is typically higher than T1ρ measurements1,2. T1sat and T1ρ sample macromolecular and chemical exchange phenomena3. T1sat and T1 without off-resonance saturation (T1nosat) were measured in an elderly cohort to determine their relationship with AD progression.
Methods
T1sat and T1nosat were measured in 63 age-matched elderly volunteers from the cardiovascular health study cognition study including 20 normal cognition (NC), 18 mild cognitive impairment (MCI), and 25 early AD volunteers in a cross-sectional study. T1sat and T1nosat were also measured during follow-up MRIs typically performed every two years. The subject groups included 15 stable NC, 11 stable MCI and 14 NC-to-MCI/AD subjects in the longitudinal study. The cognitive status of each volunteer was determined periodically by an adjudication committee4. All MRIs were performed on a GE Signa 1.5 T MRI at the University of Pittsburgh MR research center after informed consent. T1sat (10 kHz offset) and T1nosat were measured using inversion recovery and echo planar imaging [19 slices, Thickness/Spacing: 5/0 mm, TE/TR: 21 ms/8000 ms, 90o, 1000 Hz/pixel, twelve inversion times (TIs) from 0.02-2.6 s].
T1sat and T1nosat were calculated using a noniterative algorithm and the TIs pertaining to each slice. For each subject, the T1 maps were transferred to the standard brain template using SPM8. The relative changes of T1 (ΔT1RF) was calculated in the standard space using:
ΔT1RF indirectly measures the forward magnetization transfer rate between blood and tissue protons1. We hypothesize ΔT1RF to: 1) Decrease in tissues affected by neurodegeneration versus health tissues; and 2) Longitudinally decrease in tissues that are degenerating compared to stable (healthy) tissues. Regional T1sat, T1nosat, and ΔT1RF values (from gray matter, white matter, CSF and whole brain) were compared among NC, MCI and AD groups. Because ΔT1RF is more sensitive to the change between different groups, ΔT1RF maps were compared voxel-by-voxel among the three groups using SPM8's general linear model (GLM), controlling for age and gender.
The longitudinal change of ΔT1RF for each subject was calculated between the baseline and folllow-up scans and compared voxel-by-voxel among the three longitudinal groups using SPM8's GLM, controlling for age, gender and years between baseline and follow-up scans. For both the cross-sectional and longitudinal analyses, a voxel-level p-value of 0.01 was used to threshold the statistical maps and a cluster-level p-value of 0.05 was used to guard against false positives from multiple comparisons.
Results
For the region-based comparisons, T1nosat was not significantly different for the studied regions between cognitive groups. However, T1sat was significantly higher (p=0.025) in white matter in ADs versus MCIs.
ΔT1RF was more sensitive to the disease states. Compared to the NCs, we observed a significant decrease of ΔT1RF in the ADs for the white matter region (p=0.021). Compared to the MCIs, a significant decrease of ΔT1RF was also observed in the ADs for the white matter region (p=0.0089) and the whole brain (p=0.050).
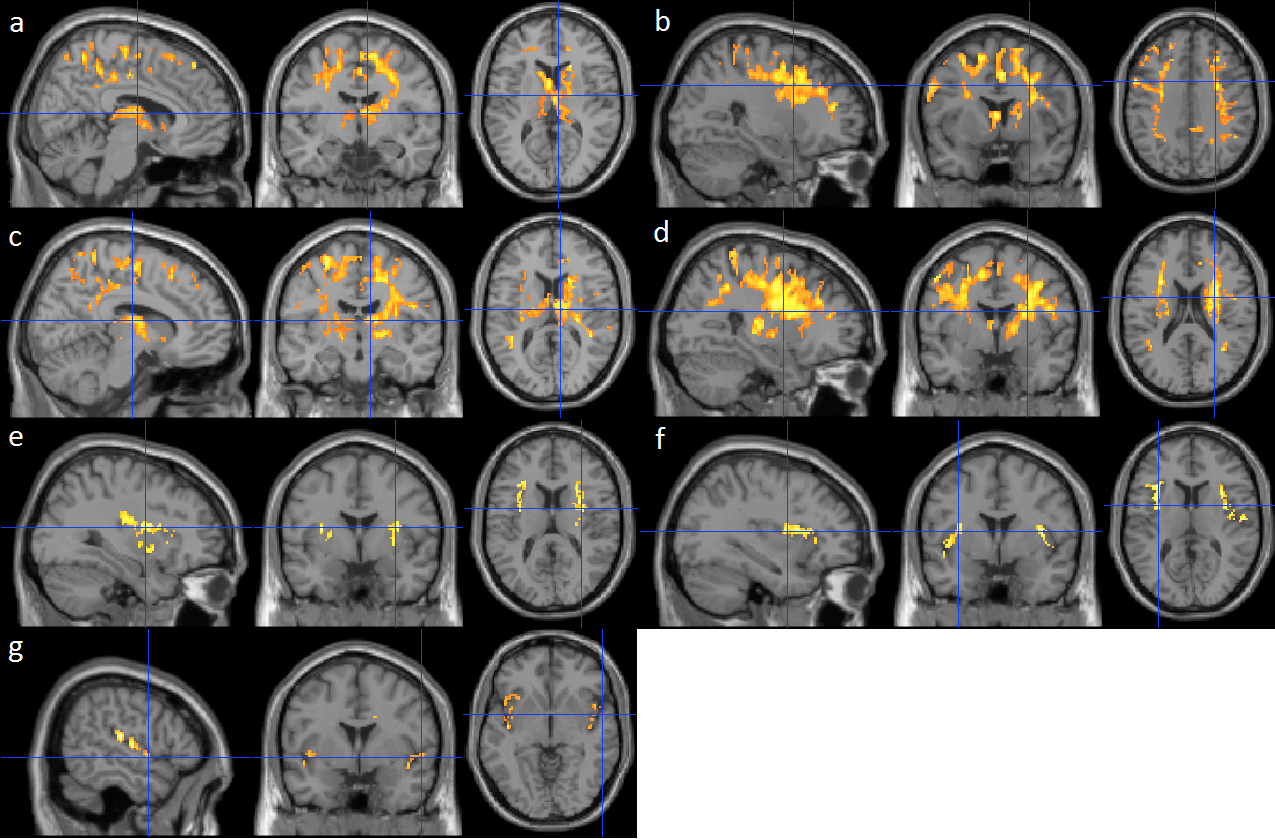
In the cross-sectional analysis, both decreases and increases of ΔT1RF were observed in MCIs and ADs. Compared to the NCs, the ADs exhibited a significant decrease of ΔT1RF values at the caudate, thalamus, precuneus and inferior parietal, superior and middle frontal, precentral, paracentral, middle cingulate, supplemental motor and internal capsule areas (Fig. 1a-1b). Compared to the MCIs, the ADs also exhibited a significant decrease of ΔT1RF values at putamen and pallidum, postcentral, superior parietal areas in addition to the aforementioned regions (Fig. 1c-1d). Compared to the NCs, the MCIs and ADs exhibited significantly higher ΔT1RF values in the insular and putamen, and insula and inferior frontal areas respectively (Fig. 1e-1f). Compared to the MCIs, ADs exhibited significantly higher ΔT1RF values in the insular area (Fig. 1g).
Compared to the stable NC subjects, both the stable MCIs and NC-to-MCI/ADs exhibited a significantly higher longitudinal decrease of ΔT1RF in the thalamus, posterior cingulate and precuneus, inferior and superior parietal, superior and middle temporal, hippocampus and parahippocampus, superior and middle occipital, and internal capsule areas (Fig. 2a and 2b).
Discussion
ΔT1RF correlated with the development and diagnosis of AD in this study. ΔT1RF changes in the large portion of thalamus were consistent for the cross-sectional and longitudinal studies, indicating that ΔT1RF could be a promising imaging biomarker for AD. The results were generally consistent with our hypotheses on ΔT1RF and its longitudinal decrease during neurodegeneration.Acknowledgements
This work was supported by grants AG20098 and AG15928 from the National Institute of Aging (NIA) and by contracts N01-HC-85239, N01-HC-85079 through N01-HC-85086, N01-HC-35129, N01-HC-15103, N01-HC-55222, N01-HC-75150, N01-HC-45133, and grant HL080295 from the National Heart, Lung, and Blood Institute (NHLBI), with additional contributions from the National Institute of Neurological Disorders and Stroke (NINDS). The research was also supported by the State University of New York at Binghamton, Nevada Cancer Institute, the University of Pittsburgh, and Washington University in St. Louis.References
1. Zhang W, Silva AC, Williams DS, Koretsky AP. NMR measurement of perfusion using arterial spin labeling without saturation of macromolecular spins. MRM 33:370-376 (1995).
2. Borthakur A, Sochor M, Davatzikos C, Trojanowski JQ, Clark CM. T1rho MRI of Alzheimer's diseases. Neuroimage 41:1199-1205 (2008).
3. Gilani IA, Sepponen R. Quantitative rotating frame relaxometry methods in MRI. NMR in Biomedicine 29: 841-861 (2016).
4. Lopez O.L, Becker JT, Chang YF, Sweet RA, Dekosky ST, Gach HM, Carmichael OT, McDade E, Kuller LH. Incidence of mild cognitive impairment in the CHS cognition study. Neurology 79(15): 1599-1606 (2012).
Figures