2355
Disrupted brain connectivity networks in Alzheimer's Disease1Center for Biomedical Imaging Research, Tsinghua University, Beijing, People's Republic of China, 2Institute of Affective and Social Neuroscience, Shenzhen University, Shenzhen, People's Republic of China, 3Neuroimaging Center, University Medical Center Groningen, University of Groningen, Groningen, Netherlands, 4Department of Radiology, University of Washington, Seattle, WA, United States
Synopsis
In this study, we used graph theory-based approaches to explore the topological organization of whole brain network in Alzheimer’s Disease. We performed resting state fMRI on 6 AD patients and 19 normal controls. Topological properties such as small-world, efficiency and nodal centrality were calculated and nonparametric permutation tests were further used for group comparisons. The results showed that high-level cognitive regions including parietal cortex, vmPFC, precuneus and emotional regions including caudate and thalamus were changed in the topological metrics, this may be a biomarker for AD classification.
Introduction
Alzheimer’s Disease (AD) is a progressive neurodegeneration disorder characterized by cognitive function declining1. This disease affects millions of people. Recently, some researches showed graph theoretical analysis with resting state fMRI data provides a powerful framework for characterizing topological properties of network2,3. It had been used to investigated many neurodegenerative and psychiatry disease, such as the major disorder depressive (MDD)4. Here we tried to use this method to explore the topological organization of whole brain network in AD.Method
Participants:6 AD patients (2 females/4 Male, age 71.33±11.67 years old) and 19 health controls (10 females/9 Male, age 74.39±5.38 years old) were recruited in this study.
MRI Acquisition:All subjects were performed with echo planner imaging (EPI) and T1-weighted 3D gradient-recalled sequence on a Philips 3-T Achieva scanner.
Data Preprocessing: Imaging preprocessing was performed using DPARSF software (Yan and Zang, 2010, http://www.restfmri.net), included removing the first 10 volumes for signal stabilization, slice-timing, realignment to correct head motion, normalizing into a standard stereotaxic space with a resolution of 3 × 3 × 3 mm3, smoothing with an isotropic Gaussian kernel (FWHM=6mm), linear detrend and filtering (0.01-0.08Hz). Nuisance signals (6 head motion parameters, cerebrospinal fluid signals and white matter signals) were regressed out. At last, the scrubbing was used to correct head motion.
Network analysis: A prior atlas of Automated Anatomical Labeling (AAL) was used to divide the brain to 116 regions. They were defined as the nodes used in the analysis. After that we extracted the mean time courses of each ROI and calculated the Pearson correlation coefficiency between paired regions as the edges. Then, both global and regional network measures (small world parameters, network efficiency, nodal centrality metrics: degree, efficiency, and betweenness) were calculated. We still did network based statistic test between groups to specifically understand which functional connectivity was changed between AD patients and healthy people. Nonparametric permutation tests were performed on the AUC of each network metric to examine whether there are any differences between two groups.
Results
AD-related alterations in small-world properties and network efficiency
There were statistically significant differences in small-world parameters and network efficiency between AD and control group. As Figure 1 showed AD patients had increased values of normalized shortest path length for small-world compared with normal control subjects and low value of normalized global efficiency for network efficiency.
AD-related alterations in regional node properties
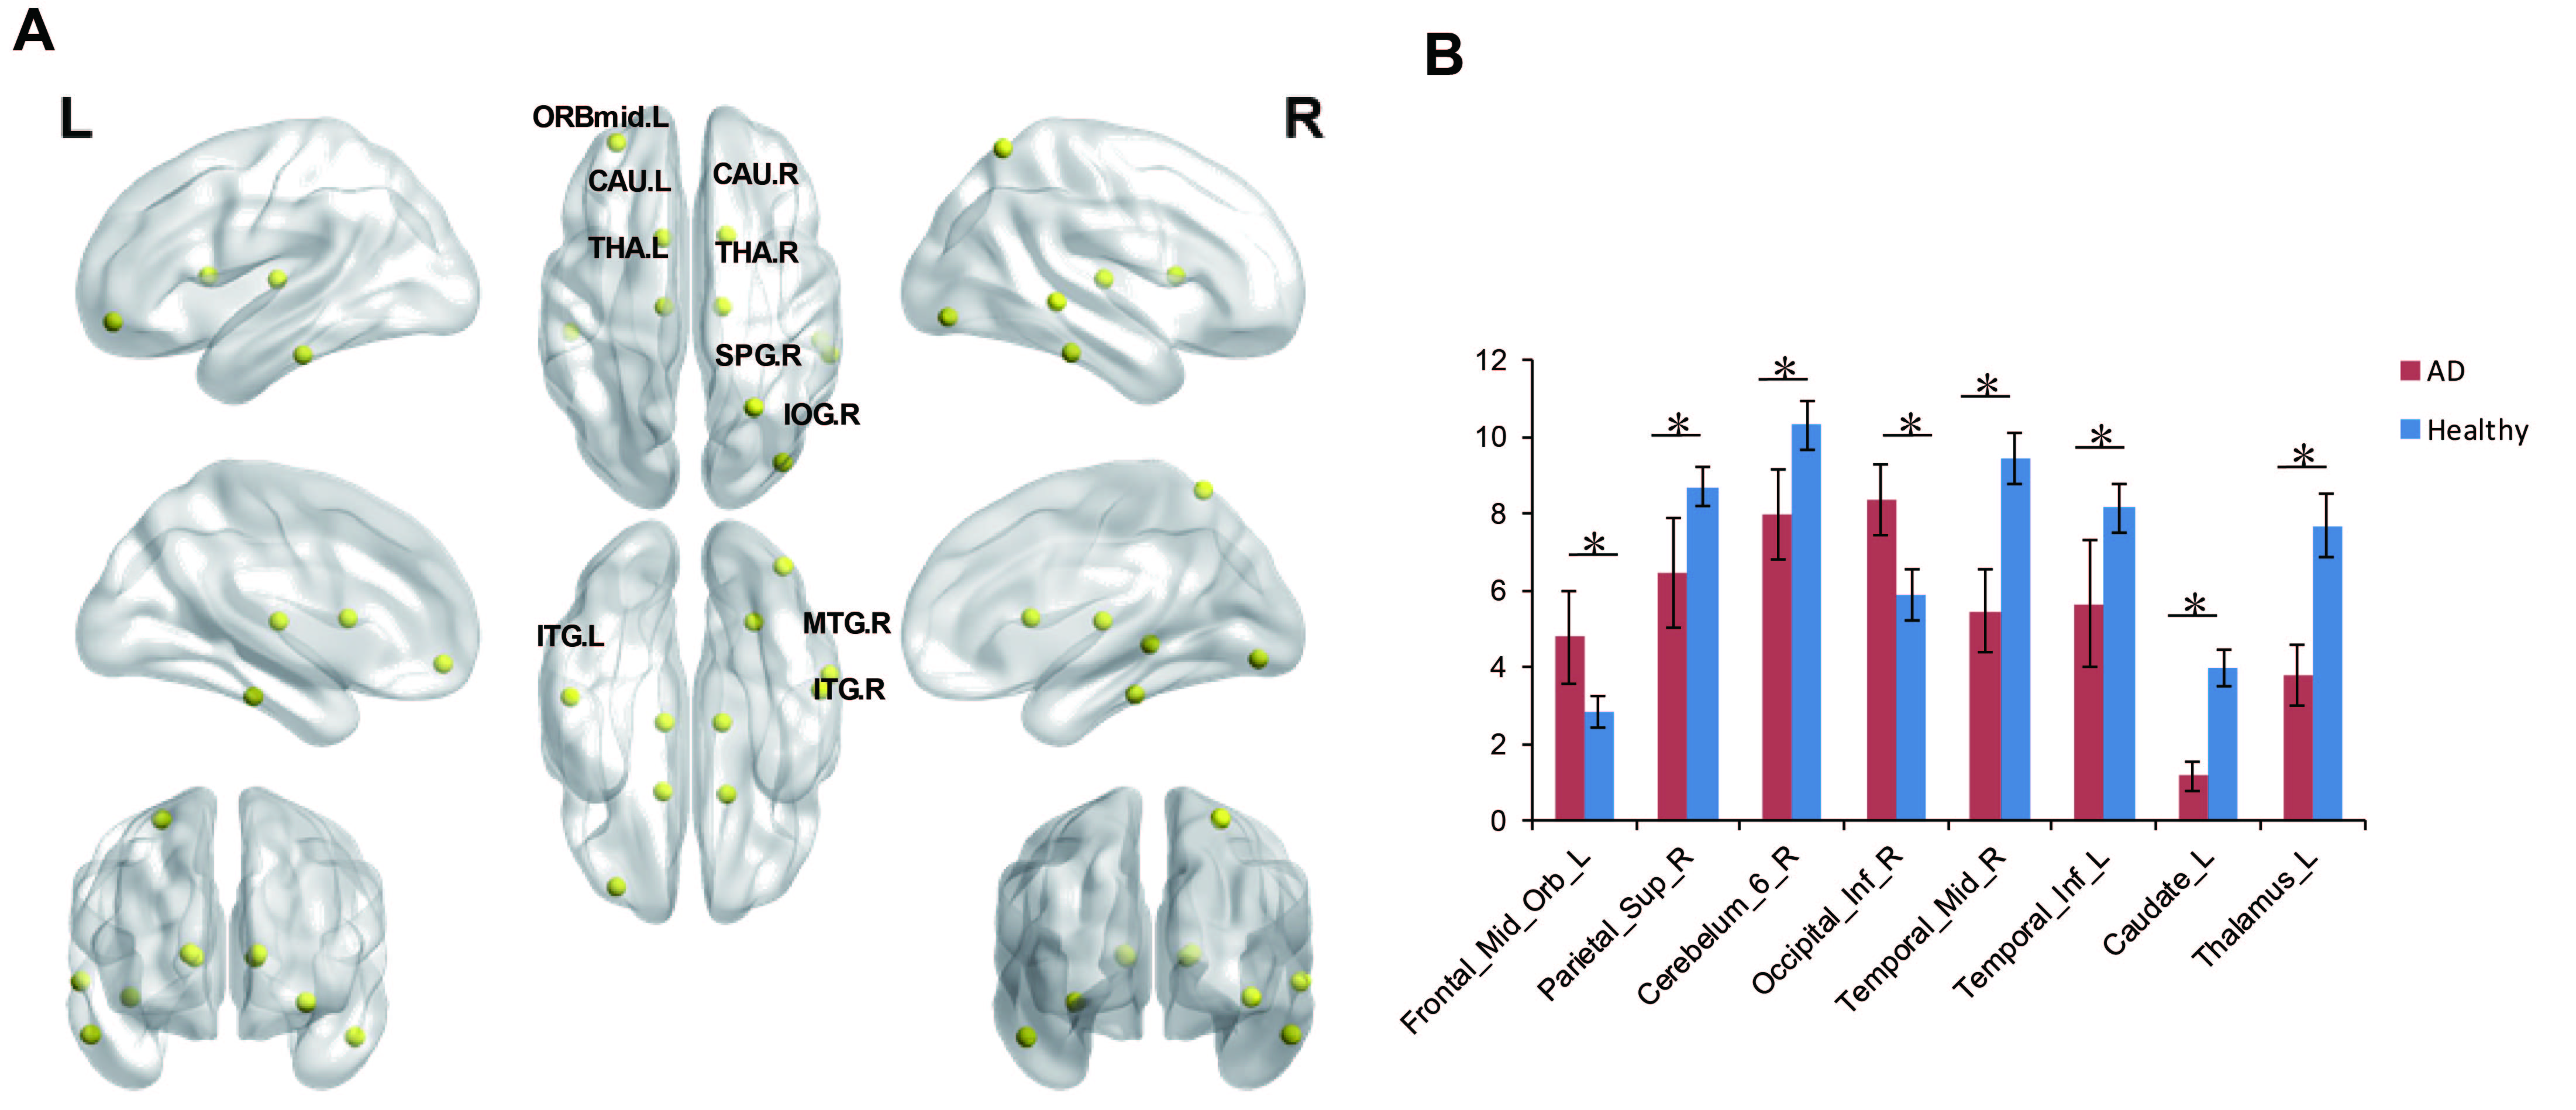
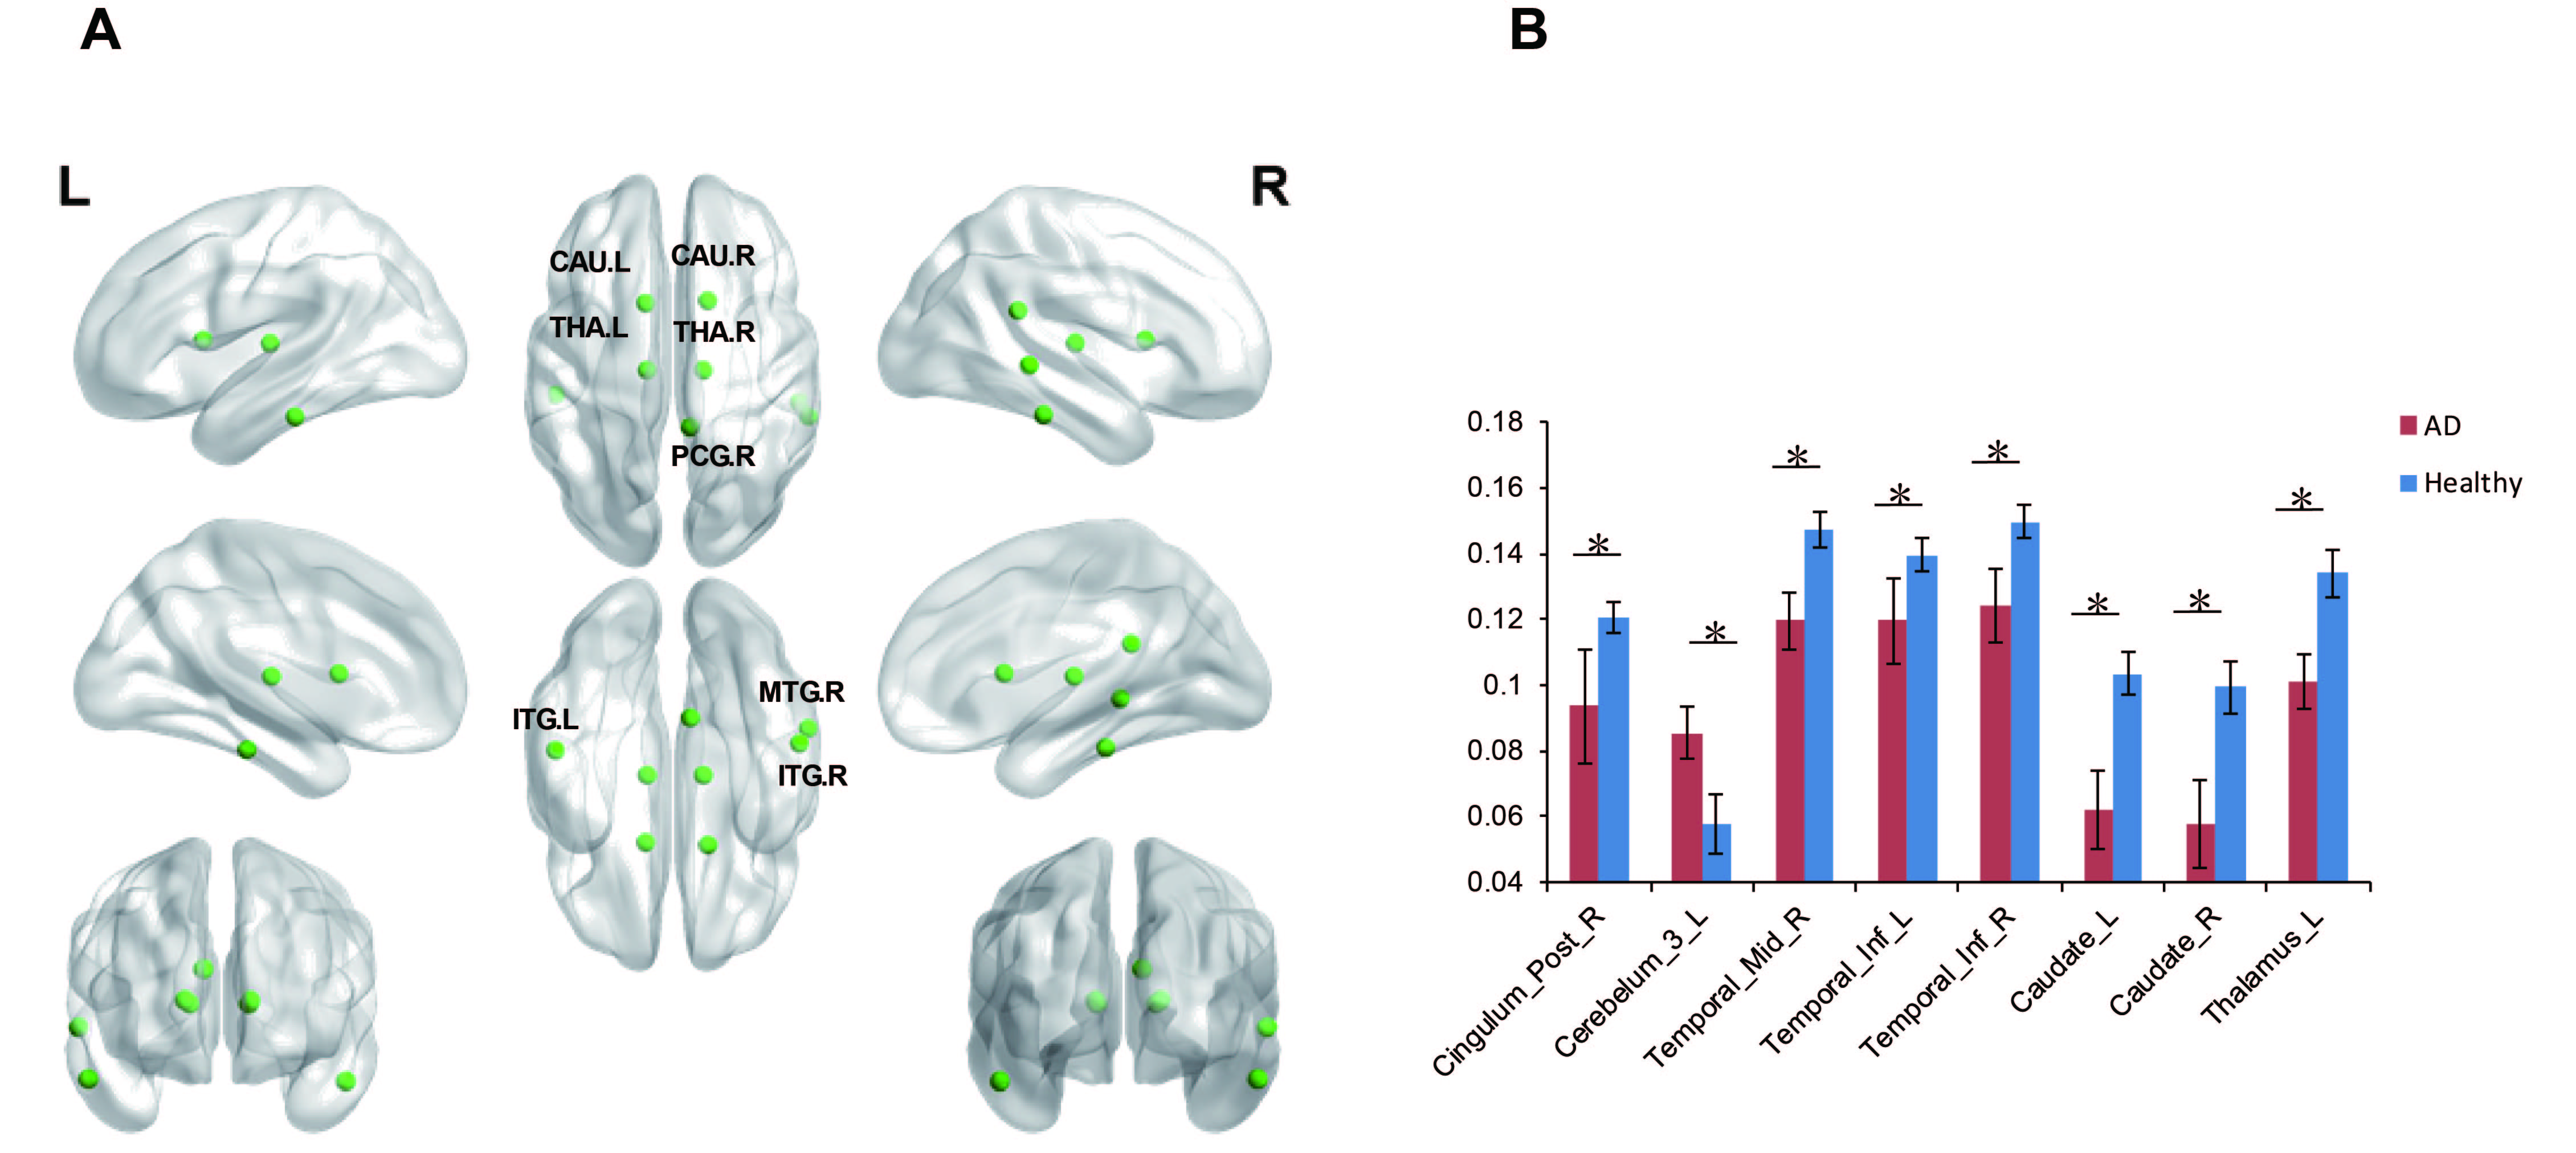
There were significant group differences among brain regions in node betweenness, degree and efficiency. Figure 2 displayed the differences of node betweenness in two groups. AD group showed decreased node centralities in many brain regions including superior frontal cortex, supplement motor area, temporal cortex and cerebellum regions, increased mainly in default mode network. In terms of degree, Figure 3 showed AD group distributed decreased in high-level cognitive cortex including superior parietal cortex and temporal cortex and emotion processing regions including caudate and thalamus; only vmPFC increased. For node efficiency, as Figure 4 displayed, AD showed similar pattern with degree.
AD-related alterations in functional connectivity
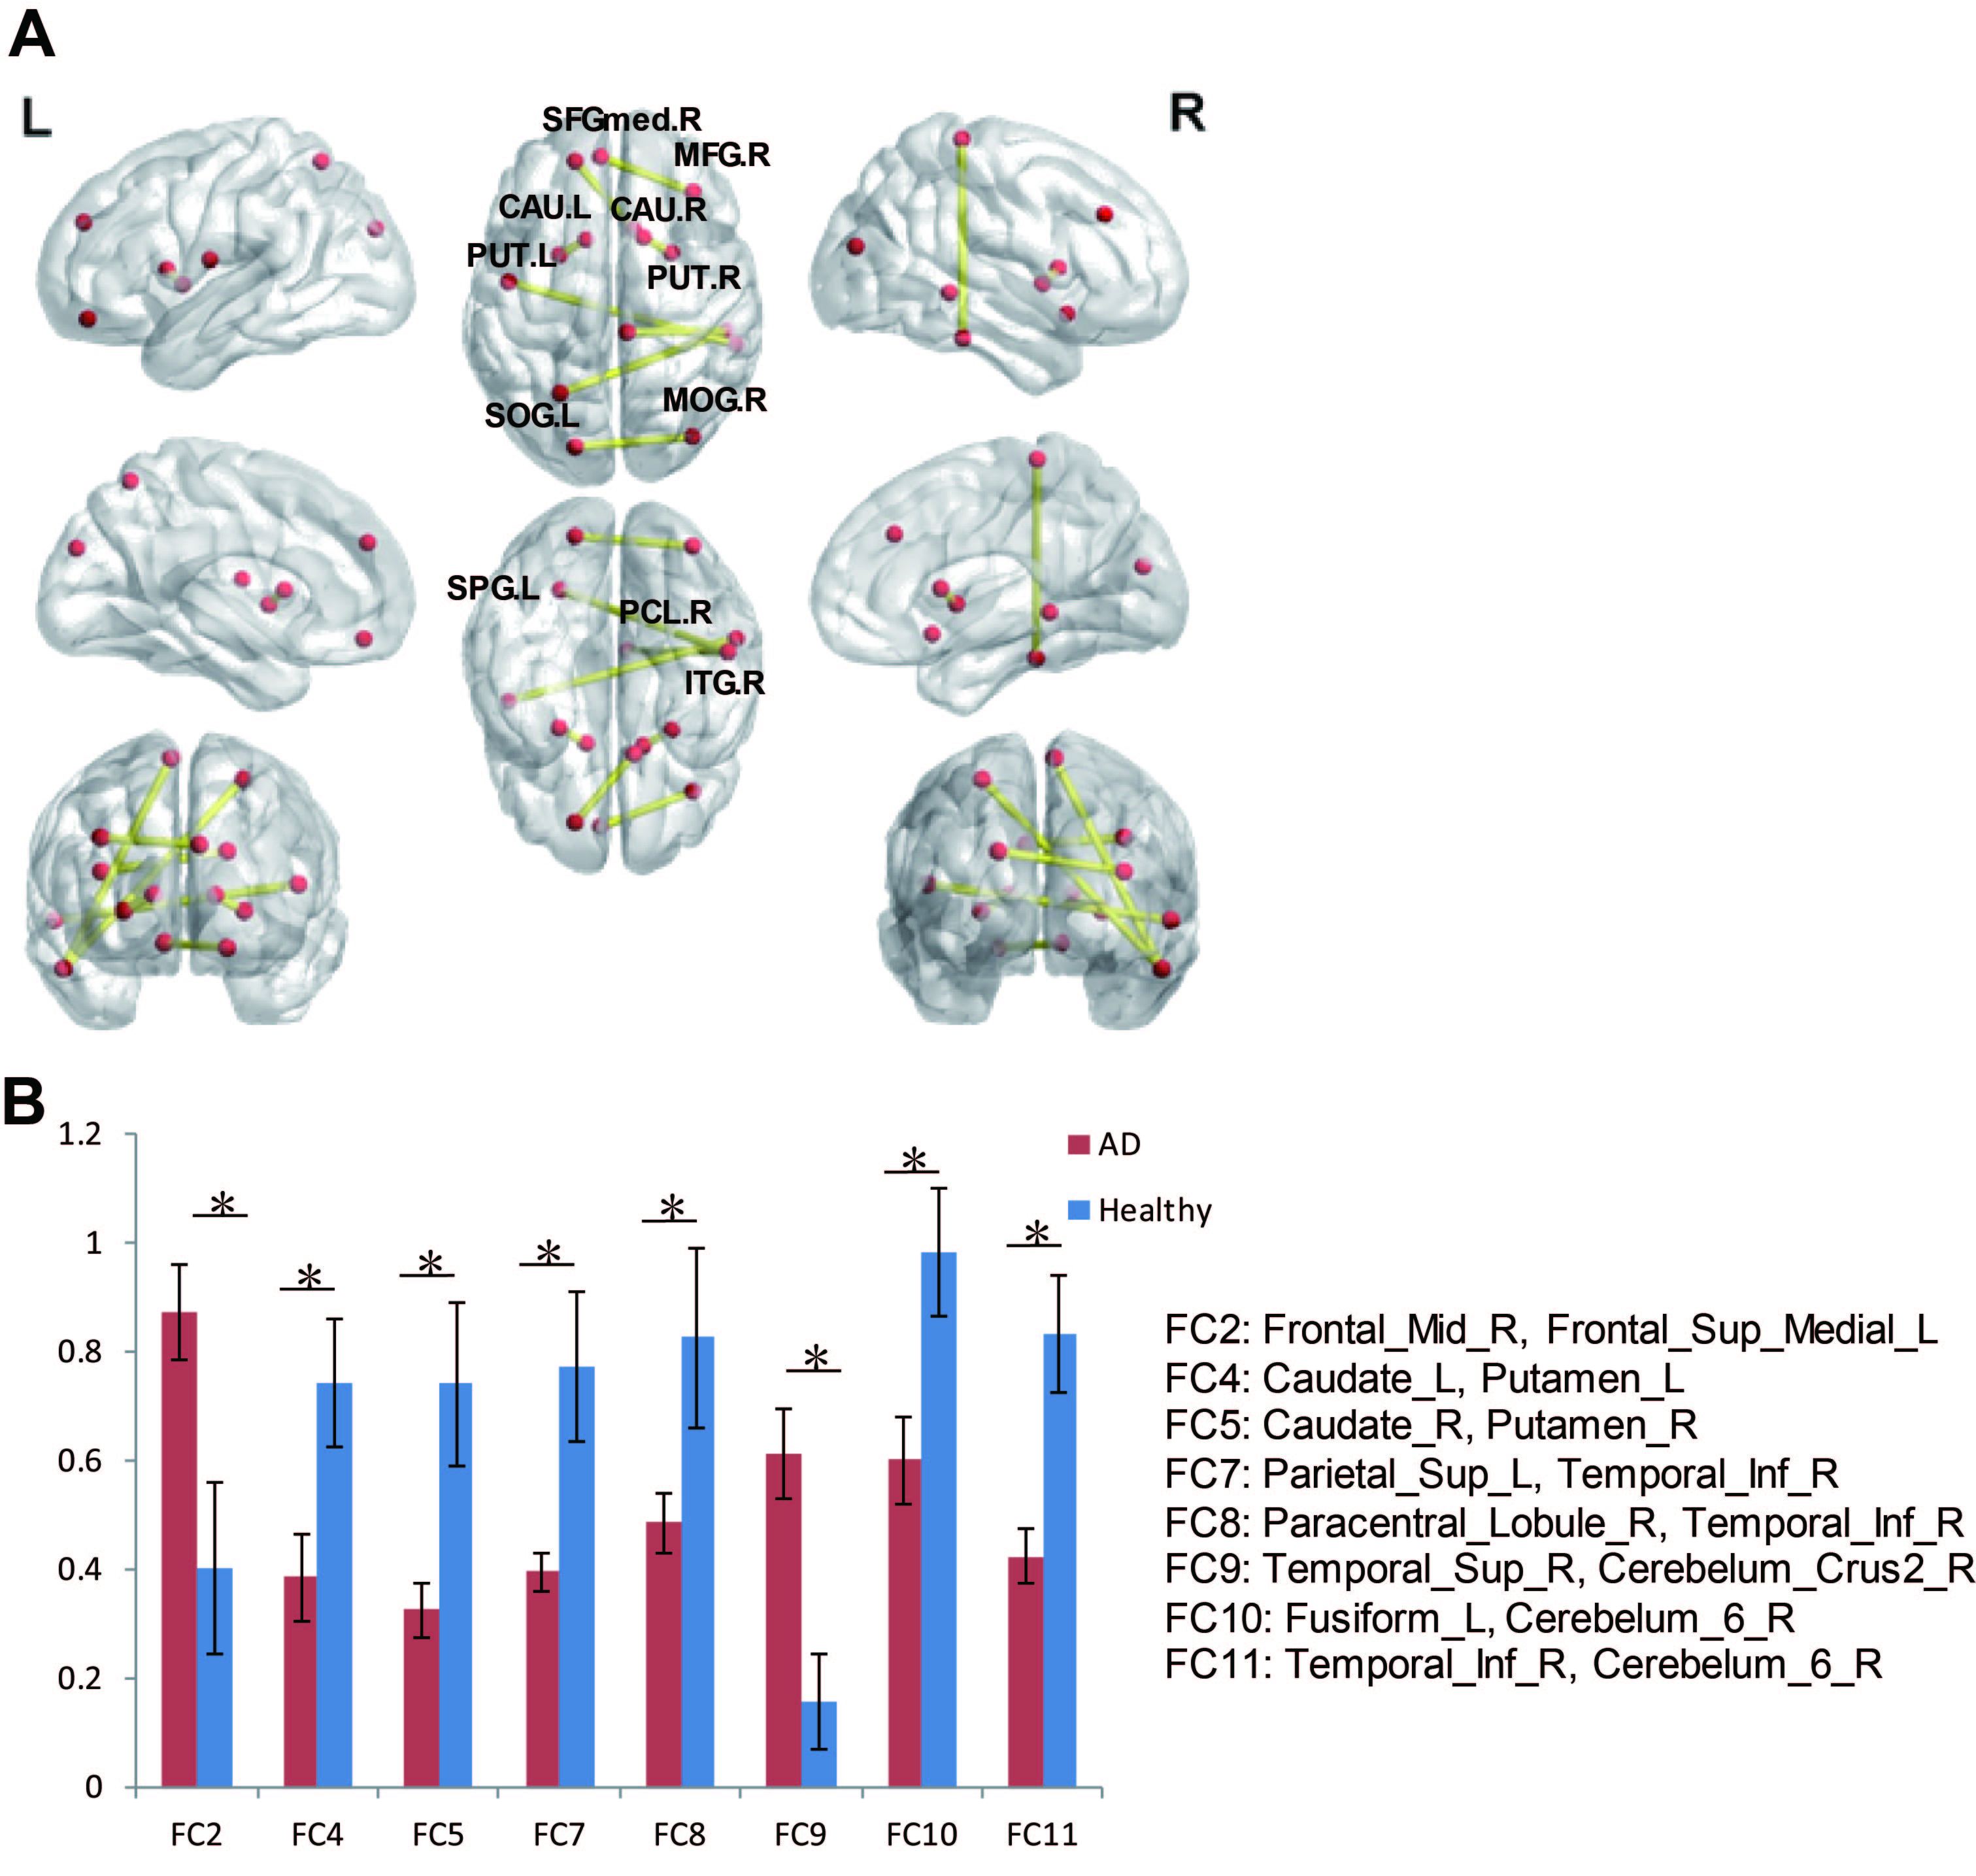
Network based statistic approach was used to identify significant alterations of functional connectivity in whole brain. The results in Figure 5 showed that AD own significant decreased connections including paracentral cortex-inferior temporal cortex, caudate-putamen, increased connections including superior frontal cortex-olfactory cortex, cerebellum crus-Vermis, and superior temporal cortex-cerebellum.
Discussion
The present study examined the topological organization of whole brain functional networks in AD patients from global network and local node level. The results revealed that AD patients had decreased global efficiency and increased shortest path length, which indicated that integration of whole-brain network was disrupted. Additionally, multiple local regions showed alterations in AD patients including decreased centrality in high-level cognitive cortex, emotional and reward-related neural circuit, increased centrality in the default mode network. Finally, in the middle level between whole-brain network and local node, we investigated the alteration of functional connectivity between regions in AD, distributed connection involved in frontal cortex and emotional circuits were altered in AD compared to healthy control. Taken together, we used graph theory approach to explored altered global network, local nodes and connections between regions in AD patients. Our findings suggested that abnormal global integration of whole brain, altered commutation and centrality of key high-level cognitive regions including parietal cortex, vmPFC, precuneus and emotional regions including caudate and thalamus may be regarded as the potential neural underlying and a biomarker for AD.Acknowledgements
Thanks a lot for all the AD and healthy participants.References
1. Blennow K, de Leon MJ, Zetterberg H. Alzheimer’s disease. Lancet. 2006; 368(9533):387–403a. doi:10.1016/S0140-6736(06)69113-7
2. Bullmore, Ed, and Olaf Sporns. Complex Brain Networks: Graph Theoretical Analysis of Structural and Functional Systems. Nature Reviews Neuroscience. 2009;10(3): 186–198.
3. Bassett DS, Bullmore ET. Human brain networks in health and disease. Curr Opin Neurol 2009; 22:340 –347.
4. Zhang, Junran, Jinhui Wang, Qizhu Wu, et al. Disrupted Brain Connectivity Networks in Drug-Naive, First-Episode Major Depressive Disorder. Biological Psychiatry.2011;70(4): 334–342.
Figures
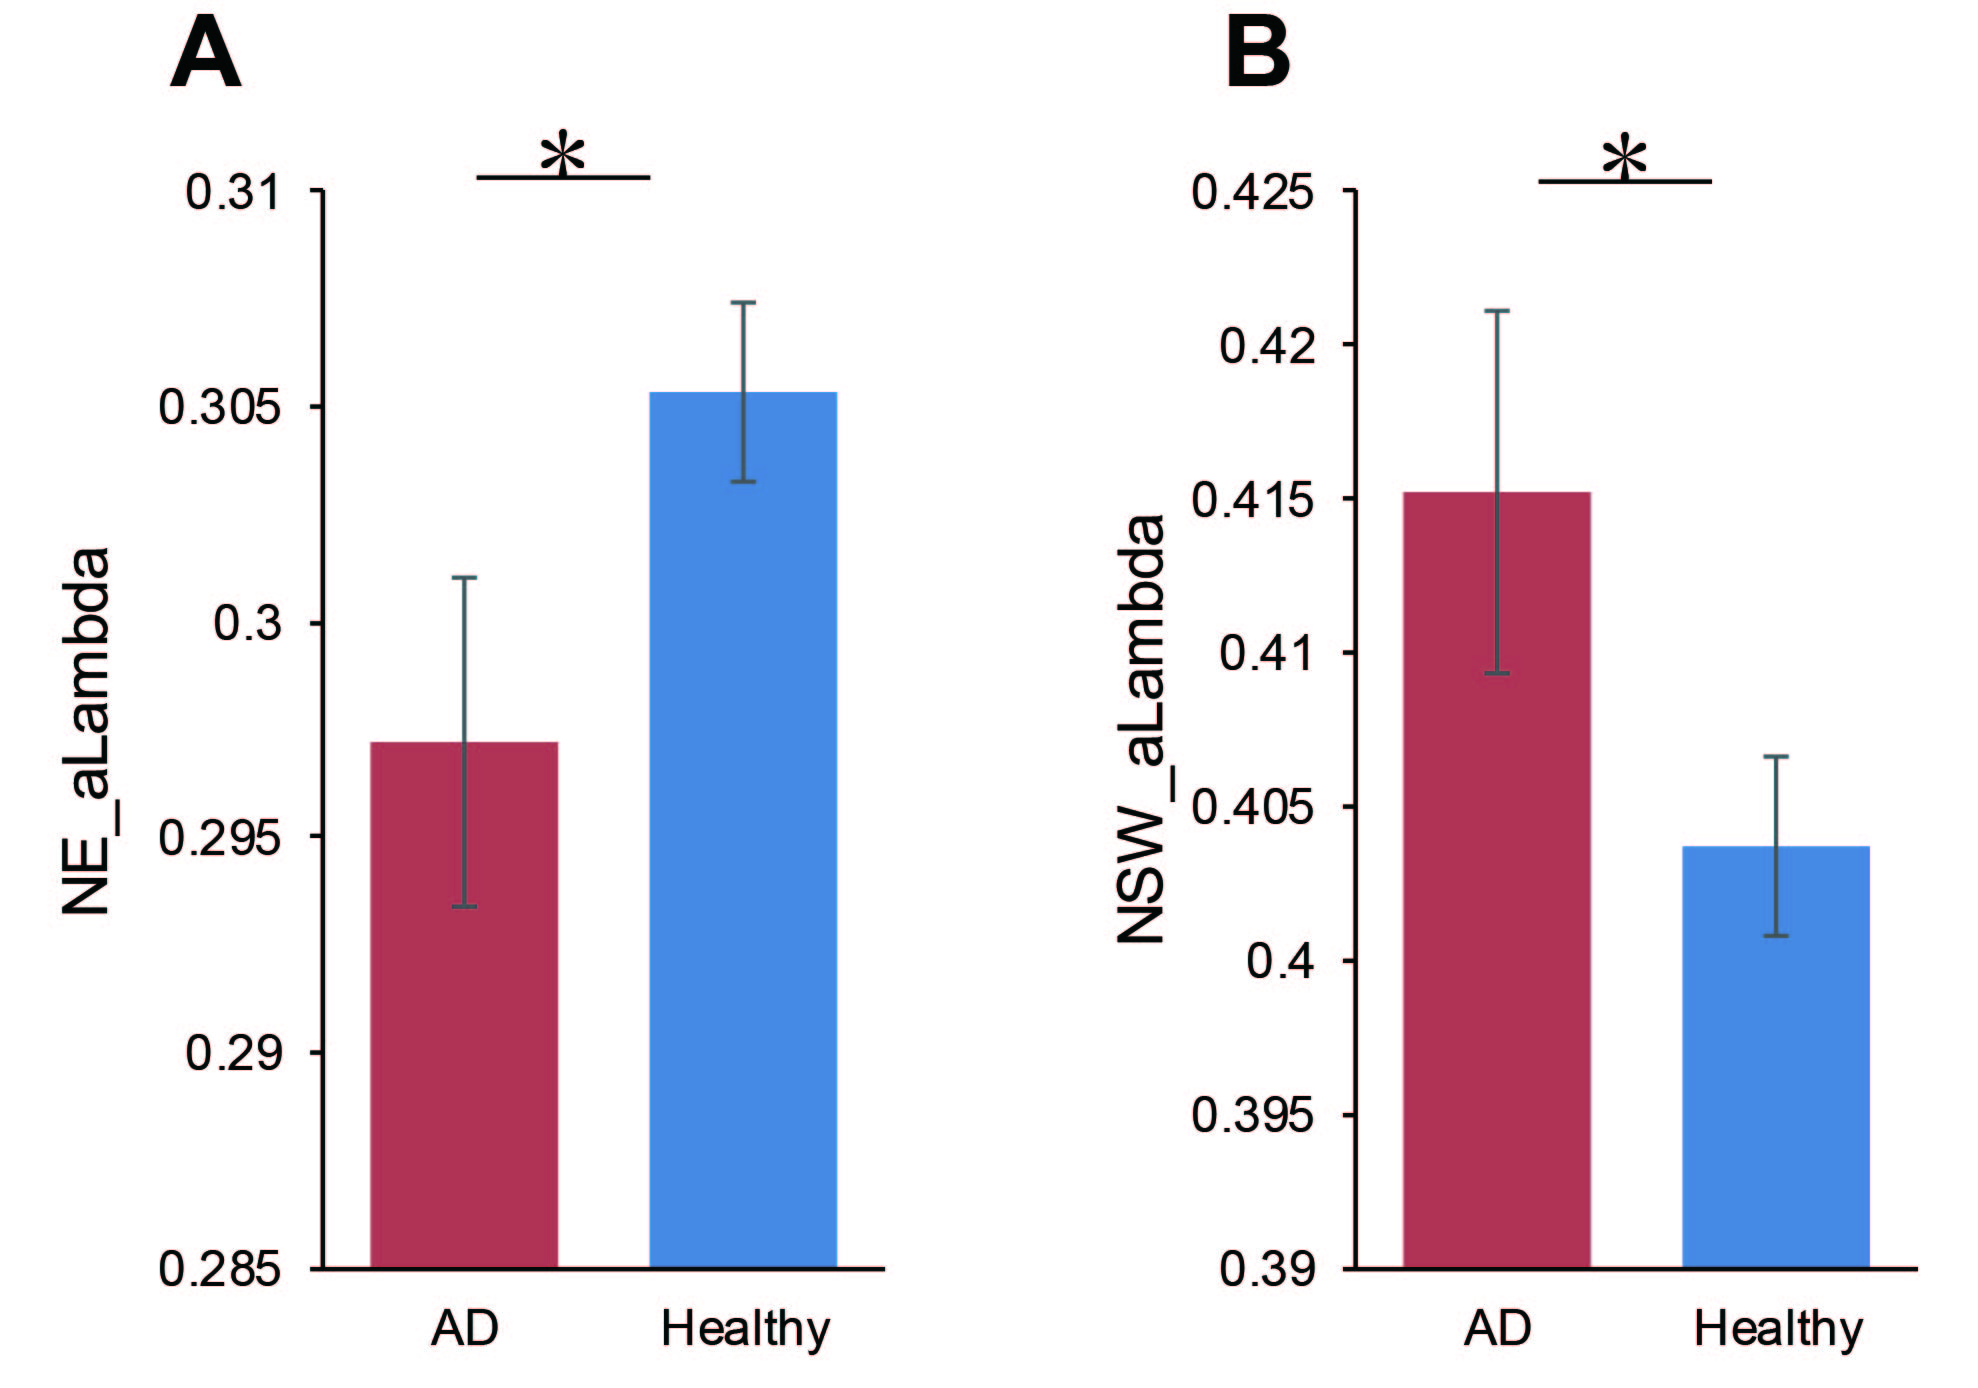
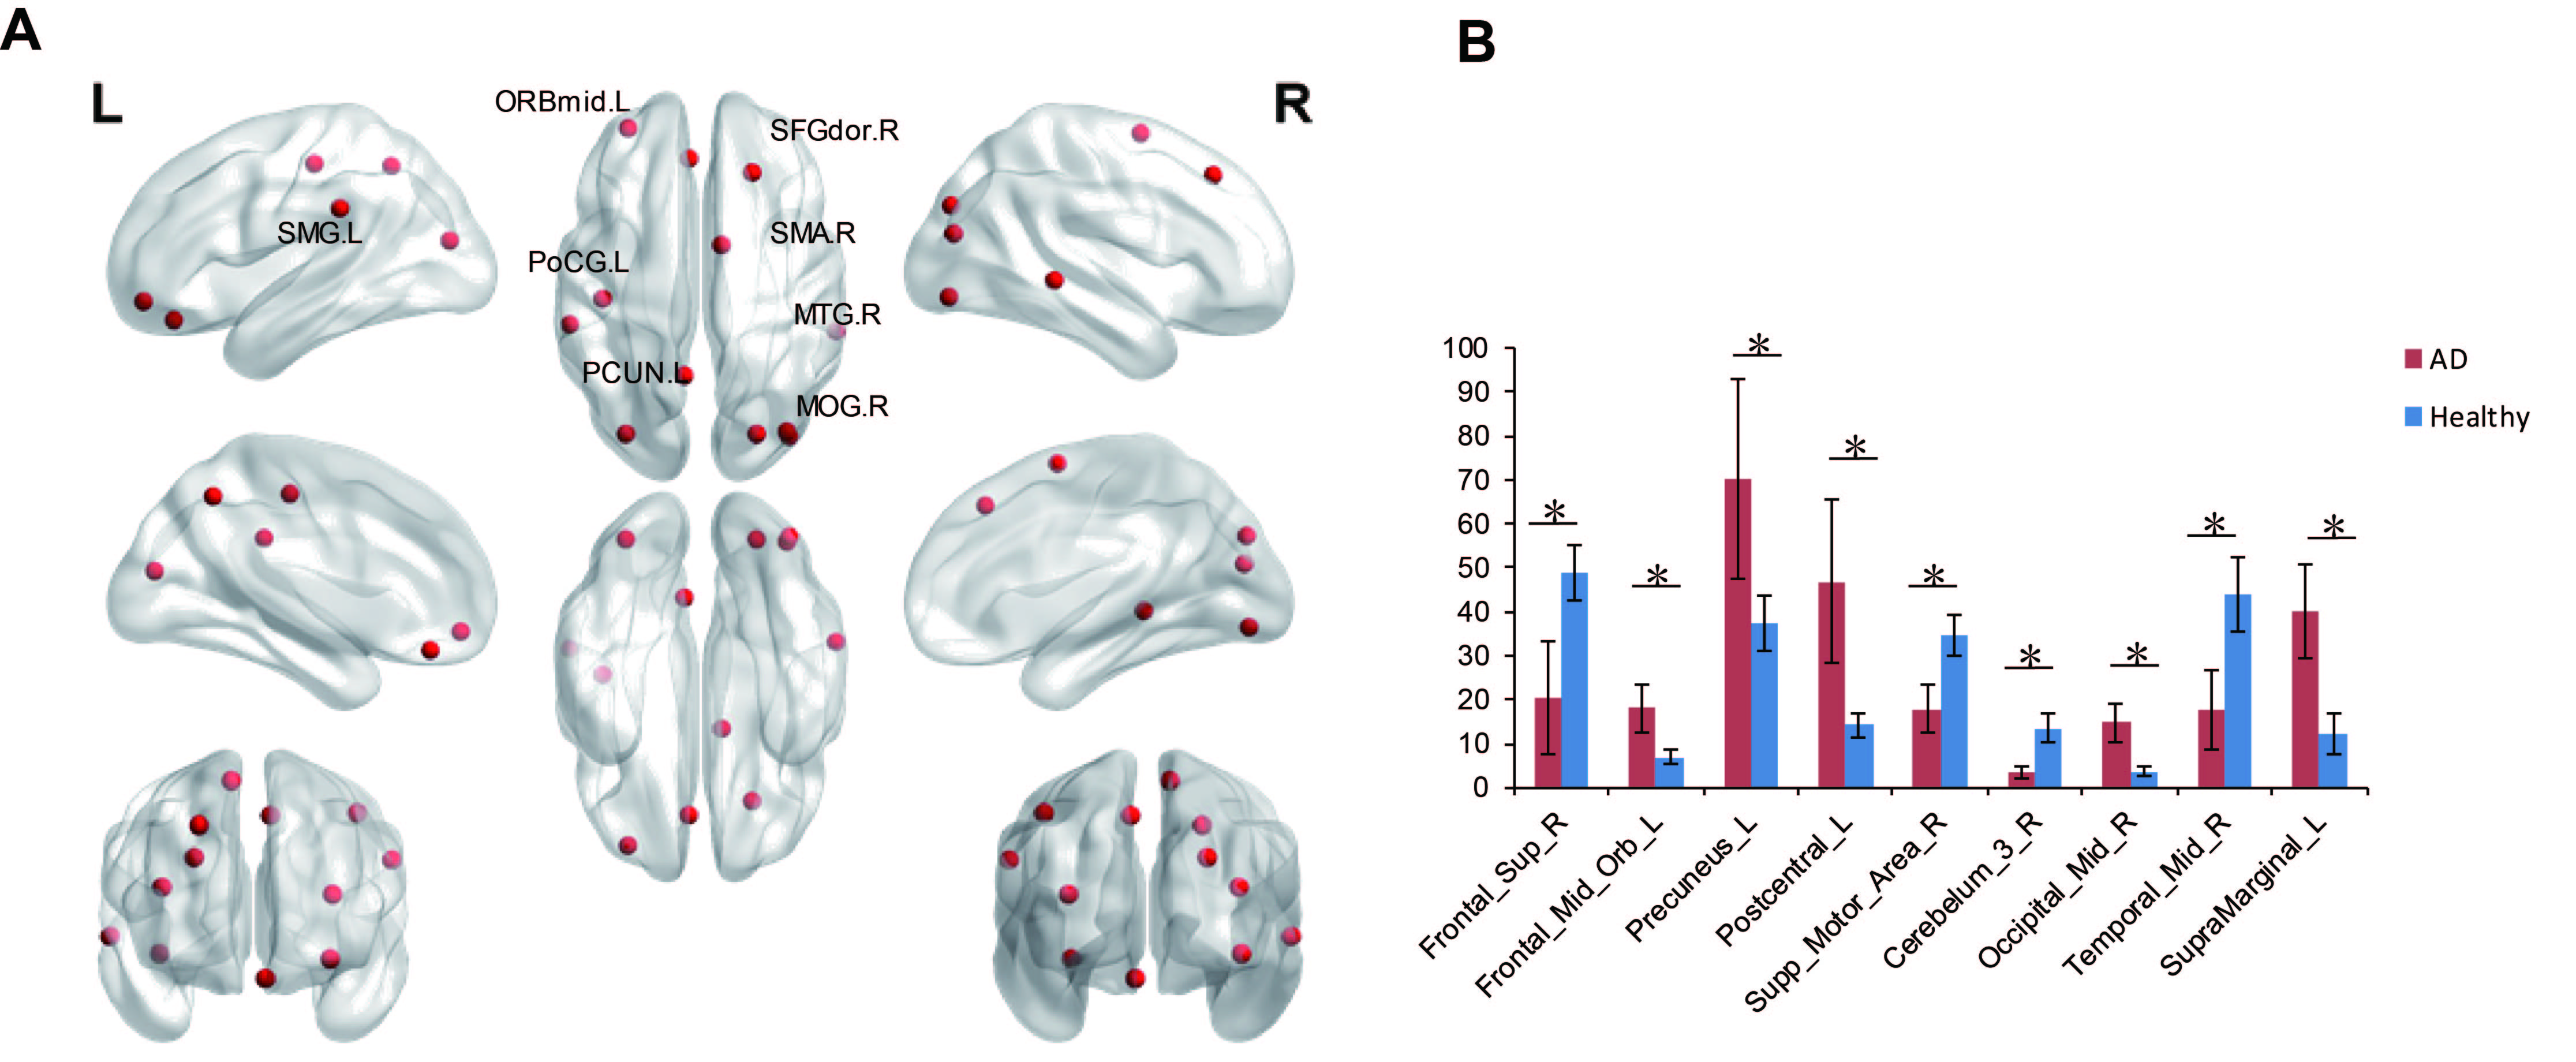
Figure 2. Node betweenness difference between AD and healthy people.(A) Regions with abnormal nodal centralities in AD. (B) Bar plot of node betweenness in AD and healthy people. Notes: SMG.L, left supramarginal, ORBmid.L, left middle orbital frontal gyrus; SFGdor.R, right superior frontal gyrus; SMA.R, right supplementary motor area; PoCG.L, left postcentral gyrus; MTG.R, right middle Temporal gyrus; PCUN.L, left precuneus; MOG.R, right middle Occipital gyrus.* means p < 0.05