2352
Use of population-specific atlases for brain morphometry: benefits in Alzheimer’s Disease diagnosis decision support for Chinese patients1Advanced Clinical Imaging Technology, Siemens Healthcare HC CEMEA SUI DI PI, Lausanne, Switzerland, 2Department of Radiology, CHUV, Lausanne, Switzerland, 3LTS5, EPFL, Lausanne, Switzerland, 4Department of Radiology, Xuanwu Hospital, Capital Medical University, Beijing, China, 5Research Center for Medical Image Computing, Department of Imaging and Interventional Radiology, The Chinese University of Hong Kong, Shatin, New Territories, Hong Kong, China, 6Shenzhen Research Institute, The Chinese University of Hong Kong, Shenzhen, China, 7Department of Medicine and Therapeutics, The Chinese University of Hong Kong, Shatin, NT, Hong Kong, 8MR Collaboration Northeast Asia, Siemens Healthcare, Beijing, China
Synopsis
We investigate the potential of a Chinese-specific brain atlas derived from a large MR database of healthy Chinese subjects to accurately support Alzheimer’s Disease diagnosis using automated brain volumetry in the Chinese population. Our experiments show that disease detection sensitivity is higher than when using either a Westerner-specific atlas and normative ranges or combining a Westerner atlas with Chinese-specific normative ranges. These findings suggest that population-specific models improve the reliability of medical decision support systems based on automated brain volumetry.
Purpose
Significant differences in brain morphometry between Chinese and Western populations have been demonstrated by several groups [1,2]. As shown in [3,4], Chinese brain atlases enable more accurate volumetric studies of normal or abnormal brain anatomy [3] in the Chinese population. In this work, we assessed the impact of using a Chinese atlas [4] compared to a Westerner atlas with regard to Alzheimer’s Disease (AD)-related brain atrophy evaluation in a Chinese patient population.Material and methods
The study enrolled 27 AD patients and 27 gender- and age-matched healthy controls (HC). The diagnosis of AD fulfilled the Diagnostic and Statistical Manual of Mental Disorders (Fourth Edition) criteria for dementia and the National Institute of Neurological and Communicative Disorders and Stroke/Alzheimer’s Disease and Related Disorders Association criteria for possible or probable AD.All subjects were scanned on a Magnetom Trio Tim 3T MR scanner (Siemens Healthcare, Erlangen, Germany) using a 3D MPRAGE sequence (TR=2300ms, TI=900ms, matrix size=256x256x176; voxel size=1×1×1mm3). All MPRAGE scans were then processed with the MorphoBox prototype [5] using either a Westerner template (based on N=306 controls scanned with MPRAGE 3T ADNI protocol [6, 7], 66.4±19yo, age range: 19-90yo, 49% healthy female subjects) or a Chinese one (based on N=1089 controls scanned with MPRAGE 1.5T protocol [4], 44.2±14yo, age range: 18-76yo, 51.5% healthy female subjects), both built using the procedure described in [5].
Deviations from normative ranges of resulting volume estimates for global and cortical gray matter, white matter, CSF, lateral ventricles, temporal lobe GM and hippocampus were assessed by z-scores. Westerner and Chinese normative ranges were calibrated on the respective healthy volumes estimated by MorphoBox with the corresponding population-specific atlas using a log-linear regression model taking into account the confounding effects of age, sex, voxel size, GM/CSF and WM/CSF contrast-to-noise ratios as covariates [8].
In order to assess the respective impact of the atlas and the normative population, we compared three different AD detection scenarios: (1) Westerner atlas-based morphometry using Westerner normative ranges (WES-WES); (2) Westerner atlas-based morphometry using Chinese normative ranges (WES-CHN); (3) Chinese atlas-based morphometry using Chinese normative ranges (CHN-CHN).
The statistical significance of the difference of z-scores between AD and controls across the three scenarios was assessed using Mann-Whitney one-sided rank tests. Differences in z-scores between scenarios were tested using Wilcoxon tests.
Results
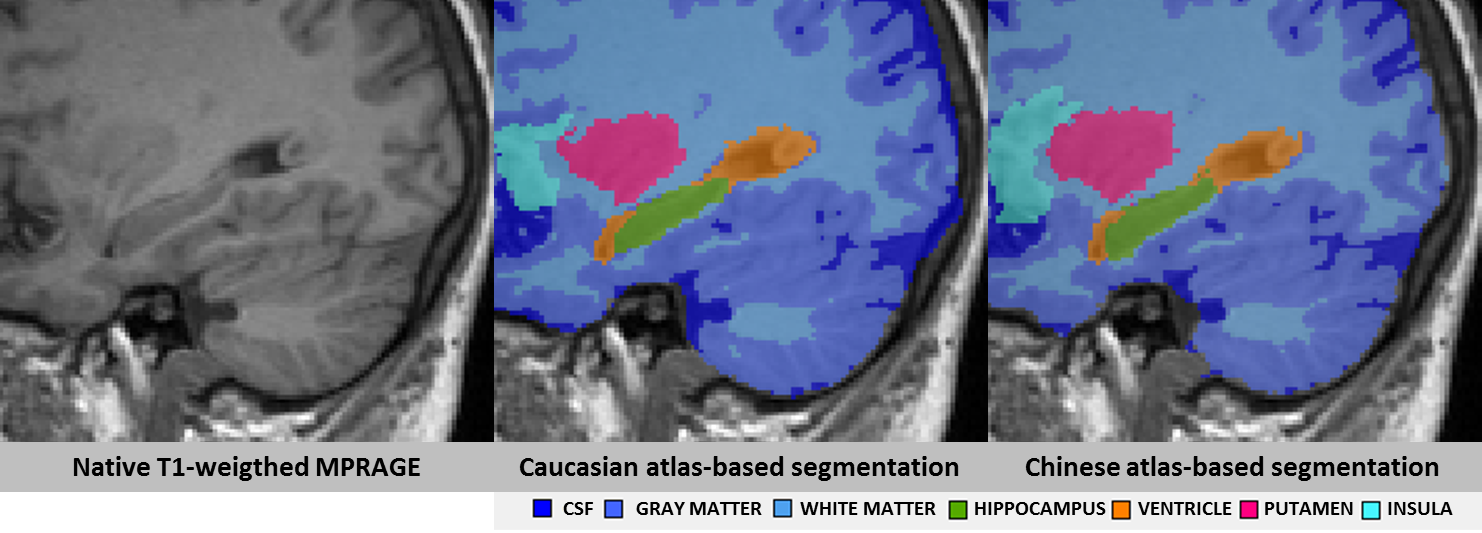
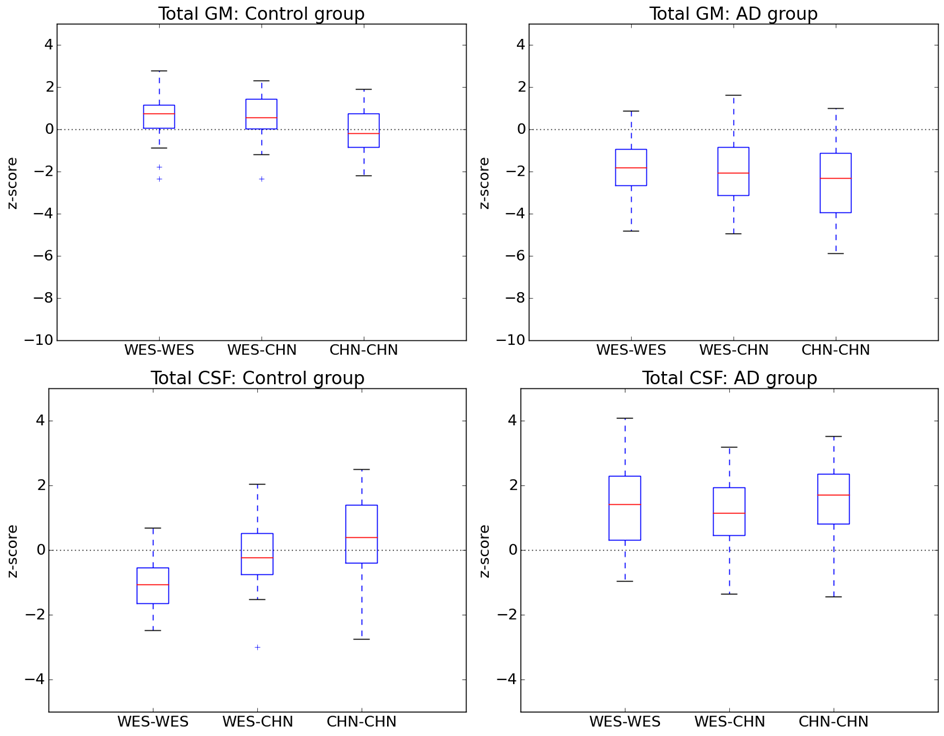
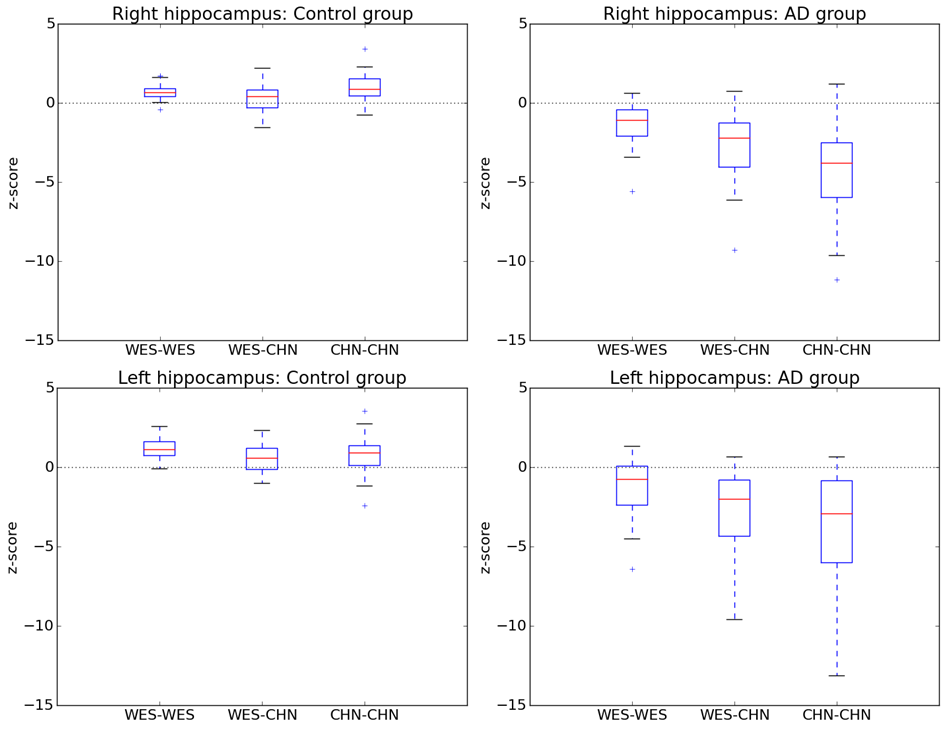
For all structures and all AD detection scenarios, the z-scores of AD patients were significantly different from those of controls (reduced for GM structures and increased for CSF structures, Bonferroni-corrected p < 5%), except for both lateral ventricles using the WES-WES strategy (see Figures 2 and 3). Z-scores of AD patients were found to be significantly lower at a Bonferroni-corrected significance level of 5% using CHN-CHN compared to WES-WES for the total GM (p=0.04) and both hippocampi (p<0.0001). AD patients’ z-scores were significantly lower using CHN-CHN than using CHN-WES for the total GM (p=0.002), both hippocampi (left, p=0.003; right, p=0.0007), the right temporal GM (p=0.0008), and significantly larger for the total CSF (p=0.02). Both hippocampi also yielded significantly reduced z-scores using WES-CHN compared to WES-WES (p<0.0001). No other significant differences were found. Figure 1 shows an exemplary segmentation of the right hippocampus which is visually similar using both atlases.Discussion
Our results show that the CHN-CHN scenario is the one that enables the best detection of AD-related atrophy in Chinese subjects using the MorphoBox prototype, confirming the benefits of population-matched brain morphometry for cross-sectional analyses [1,2,3]. Also, the observation that Chinese AD patients had significantly reduced z-scores for the hippocampi in the WES-CHN compared to the WES-WES scenario suggests hippocampal atrophy in Chinese AD patients is better detected using normative ranges derived from Chinese subjects, even if a Westerner-based brain atlas is employed. These findings confirm the existence of differences in healthy brain aging between Asians and Westerners, which could be due to environmental rather than genetic factors [1]. They show that employing appropriate population-specific atlases can significantly improve their value for AD clinical decision support. Further research should investigate whether similar trends are observed for other neurodegenerative diseases.Acknowledgements
No acknowledgement found.References
1. Chee, Michael Wei Liang, et al. "Brain structure in young and old East Asians and Westerners: comparisons of structural volume and cortical thickness." Journal of Cognitive Neuroscience 23.5 (2011): 1065-1079
2. Kochunov, P., et al. "Localized morphological brain differences between English-speaking Caucasians and Chinese-speaking Asians: new evidence of anatomical plasticity." Neuroreport 14.7 (2003): 961-964
3. Tang, Yuchun, et al. "The construction of a Chinese MRI brain atlas: A morphometric comparison study between Chinese and Caucasian cohorts." Neuroimage 51.1 (2010): 33-41
4. Liang, Peipeng, et al. "Construction of brain atlases based on a multi-center MRI dataset of 2020 Chinese adults." Scientific reports 5 (2015)
5. Schmitter, Daniel, et al. "An evaluation of volume-based morphometry for prediction of mild cognitive impairment and Alzheimer's disease." NeuroImage: Clinical 7 (2015): 7-17
6. http://adni.loni.usc.edu/methods/documents/mri-protocols/
7. Jack, Cliff, et al. « The Alzheimer’s disease neuroimaging initiative (ADNI) : MRI methods. Journal of Magnetic Resonance Imaging 27.4 (2008):685-6918. Falkovskiy, Pavel. PhD Dissertation, EPFL (2016)
Figures