2350
Neuroanatomical substrates that account for worsening performance in the Clock-Drawing Test in mild cognitive impairment1Radiology, Johns Hopkins University School of Medicine, Baltimore, MD, United States, 2Diagnostic Imaging and Nuclear Medicine, Kyoto University Graduate School of Medicine, Kyoto, Japan, 3F. M. Kirby Research Center for Functional Brain Imaging, Kennedy Krieger Institute, Baltimore, MD, United States
Synopsis
The Clock-Drawing Test (CDT) is used to screen and select cognitively impaired individuals for further evaluation. For the clinical interpretation of the CDT, an understanding of the neuroanatomical substrates that account for a decline in the CDT score is essential. We investigated the relationships between regional volume loss and a decline in the CDT score in two years. Atrophy in the left prefrontal and middle-occipital gyri was correlated with a decline in the CDT score. The result validated the use of the CDT, combined with memory tests that evaluate parieto-temporal functions, as part of an overall cognitive screening.
Introduction
The Clock-Drawing
Test (CDT) is a simple cognitive test that is commonly used in dementia
practice1,2, which
typically takes 1-2 minutes to complete. The Alzheimer’s Association recommended
the use of several cognitive screening batteries, which include the CDT, to
screen/select cognitively impaired individuals for further evaluation3. The CDT
score reflects global cognitive status, especially executive and visuospatial
functions4. However,
the neuroanatomical substrates that account for the CDT score, which are
important for the clinical interpretation of the score, are still controversial5, reflecting differences in the diseases that have
been studied and the lack of longitudinal studies. To
investigate local brain areas that account for the lower CDT scores in mild
cognitive impairment (MCI), we
employed the Alzheimer’s Disease Neuroimaging Initiative (ADNI)
longitudinal database (adni.loni.usc.edu) to see the relationships between regional volume
loss and a decline in the CDT score over two years.Methods
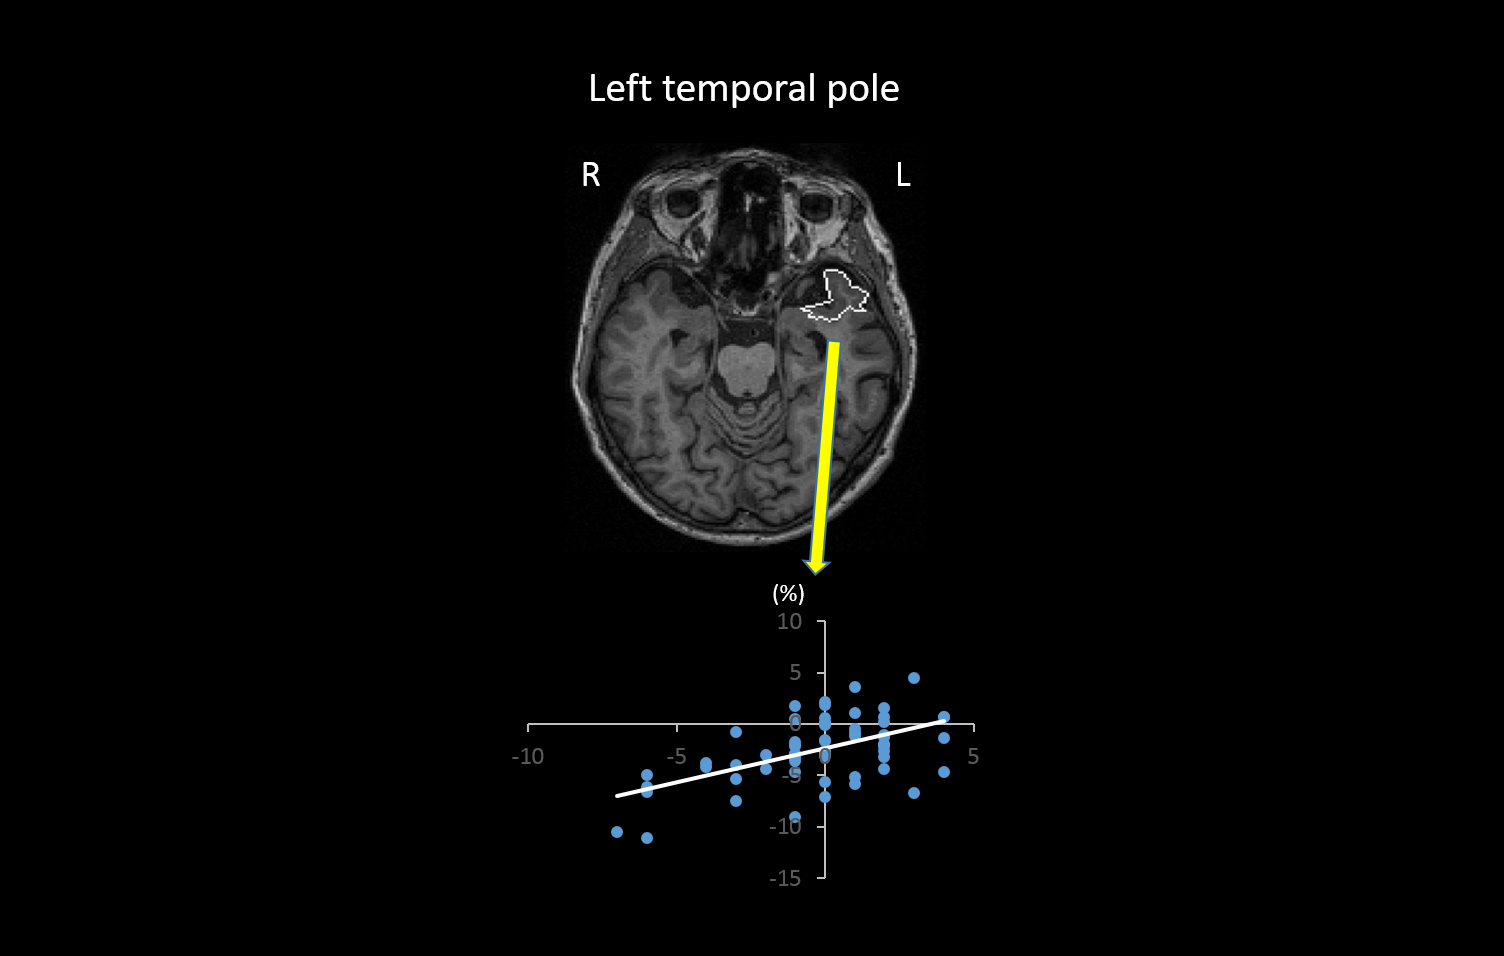
Correlations between percentage changes in local brain volume (%ΔLBV) and changes in the CDT score (ΔCDT) during two years were investigated. Participants: 65 MCI selected from the ADNI-2 cohort with whole-brain 3D magnetization-prepared rapid gradient-echo T1-weighted imaging obtained on 3T scanners (resolution: 1.0×1.0×1.2mm3). Image parcellation: A multi-atlas label fusion method6,7, based on 19 atlases (50–90-year-old brains), implemented in MRICloud (https://braingps.mricloud.org/), was used to parcellate each image into 76 anatomical structures and measure the volume of each structure. Cognitive evaluation: In addition to the CDT, we evaluated the scores of the Boston Naming Test (BNT) and the changes over two years (ΔBNT), to validate our method. Since the relationship between left temporal pole atrophy and a lower BNT score is well established in both cross-sectional and longitudinal studies8,9, we tested whether we could replicate this relationship using our method. Statistics: Partial correlations between %ΔLBV of 76 anatomical structures and ΔCDT or ΔBNT were investigated. Control variables were age, gender, education period, baseline performance (CDT or BNT), and change in the Clinical Dementia Rating Scale Sum-of-Boxes score. A p-value of 0.05, corrected for multiple comparisons (false discovery rate), was used as the threshold.Results
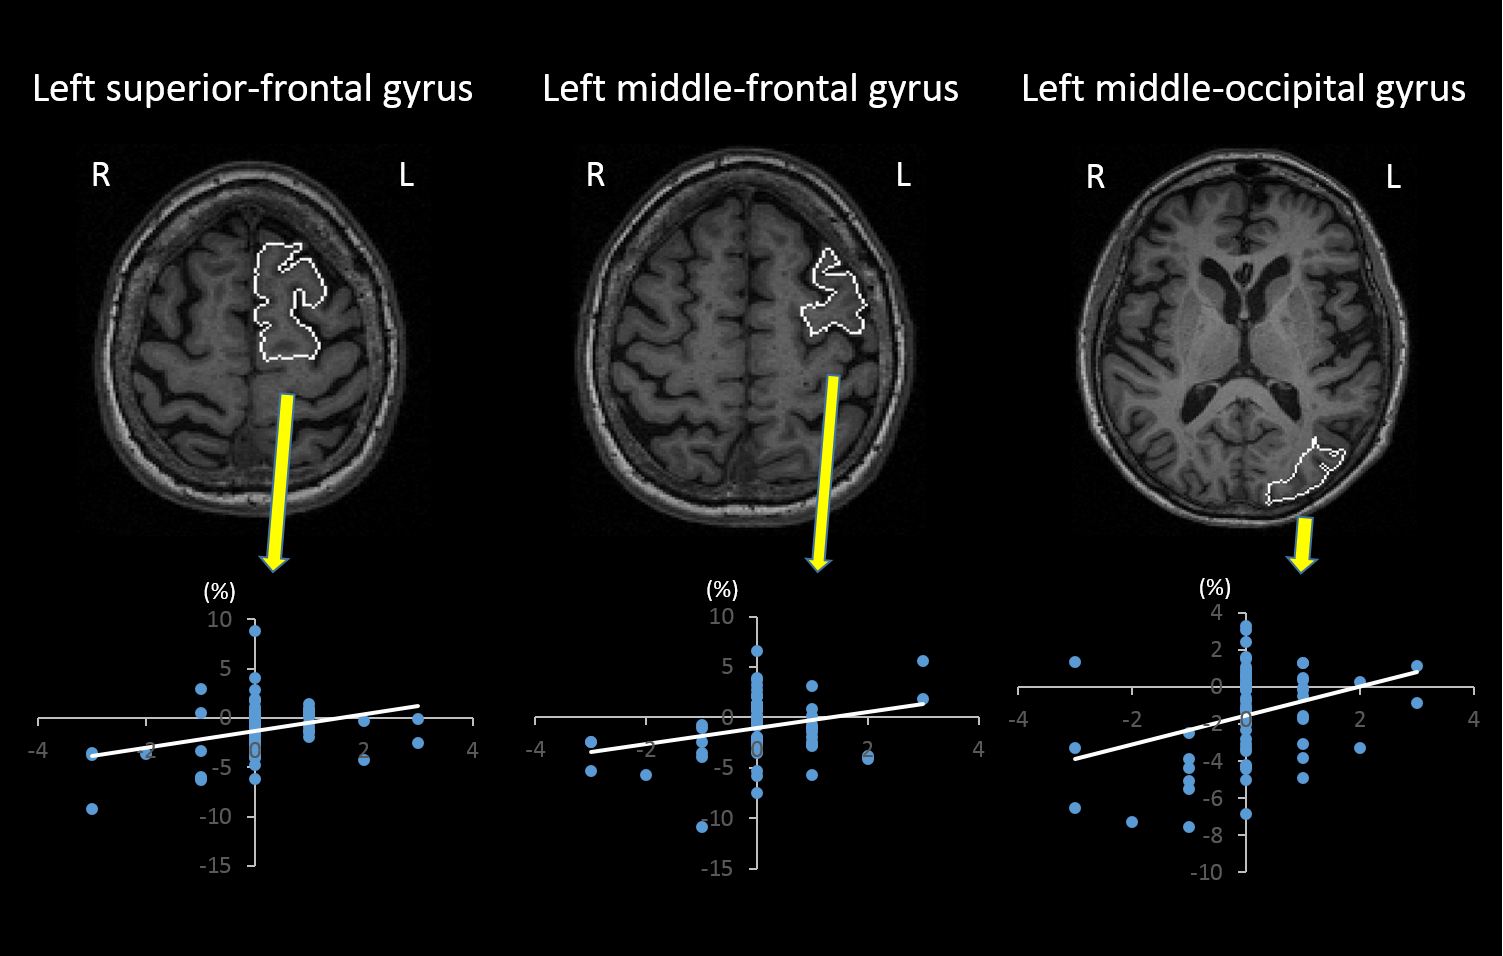
Method validation study using BNT: Among 76 anatomical structures, significant correlation was observed only between %ΔLBV of the left temporal pole and ΔBNT (r=0.44, p=0.043) (Fig. 1). CDT: Significant correlations between %ΔLBV and ΔCDT were observed in the left superior-frontal gyrus (r=0.50, p=0.0039), the left middle-frontal gyrus (r=0.41, p=0.029), and the left middle-occipital gyrus (r=0.42, p=0.029) (Fig. 2).Discussion
We could replicate the established relationship between left temporal pole atrophy and worsening of the BNT score, which indicated that the image analysis method based on the multi-atlas label fusion employed in this study was valid. Novel %ΔLBV-ΔCDT relationships were identified in the left prefrontal area and the left middle-occipital gyrus. This finding could be partially explained by a previous functional MRI study that indicated activations in bilateral prefrontal and parietal areas during the CDT10, and a relationship between prefrontal resting-state connectivity and the CDT score in MCI11. The designation of the prefrontal area as responsible for executive functions12,13 and the middle-occipital gyrus as responsible for visuospatial functions14 also supports our findings, since the CDT score is closely related to executive and visuospatial functions. Previous cross-sectional volumetric studies identified widely distributed brain areas that were related to the CDT score15-17. By introducing a longitudinal study design, we could specify the area directly related to the CDT decline.Conclusion
Atrophy
within the left prefrontal area and the left middle-occipital gyrus might cause
worsening of the CDT score.Acknowledgements
This research was made possible by a grant support from the Johns Hopkins Individualized Health Initiative (inHealth). Data used in preparation of this article were obtained from the Alzheimer’s DiseaseNeuroimaging Initiative (ADNI) database (adni.loni.usc.edu). As such, the investigatorswithin the ADNI contributed to the design and implementation of ADNI and/or provided databut did not participate in analysis or writing of this report. A complete listing of ADNIinvestigators can be found at: http://adni.loni.usc.edu/wp-content/uploads/how_to_apply/ADNI_Acknowledgement_List.pdf.References
1. Ehreke L, Luppa M, Konig HH, Riedel-Heller SG. Is the Clock Drawing Test a screening tool for the diagnosis of mild cognitive impairment? A systematic review. International psychogeriatrics. 2010;22(1):56-63.
2. Pinto E, Peters R. Literature review of the Clock Drawing Test as a tool for cognitive screening. Dementia and geriatric cognitive disorders. 2009;27(3):201-213.
3. Cordell CB, Borson S, Boustani M, et al. Alzheimer's Association recommendations for operationalizing the detection of cognitive impairment during the Medicare Annual Wellness Visit in a primary care setting. Alzheimer's & dementia : the journal of the Alzheimer's Association. 2013;9(2):141-150.
4. Paula JJ, Miranda DM, Moraes EN, Malloy-Diniz LF. Mapping the clockworks: what does the Clock Drawing Test assess in normal and pathological aging? Arquivos de neuro-psiquiatria. 2013;71(10):763-768.
5. Eknoyan D, Hurley RA, Taber KH. The clock drawing task: common errors and functional neuroanatomy. The Journal of neuropsychiatry and clinical neurosciences. 2012;24(3):260-265.
6. Liang Z, He X, Ceritoglu C, et al. Evaluation of Cross-Protocol Stability of a Fully Automated Brain Multi-Atlas Parcellation Tool. PloS one. 2015;10(7):e0133533.
7. Tang X, Oishi K, Faria AV, et al. Bayesian Parameter Estimation and Segmentation in the Multi-Atlas Random Orbit Model. PloS one. 2013;8(6):e65591.
8. Domoto-Reilly K, Sapolsky D, Brickhouse M, Dickerson BC, Alzheimer's Disease Neuroimaging I. Naming impairment in Alzheimer's disease is associated with left anterior temporal lobe atrophy. NeuroImage. 2012;63(1):348-355.
9. McDonald CR, Gharapetian L, McEvoy LK, et al. Relationship between regional atrophy rates and cognitive decline in mild cognitive impairment. Neurobiology of aging. 2012;33(2):242-253.
10. Ino T, Asada T, Ito J, Kimura T, Fukuyama H. Parieto-frontal networks for clock drawing revealed with fMRI. Neuroscience research. 2003;45(1):71-77.
11. Liang P, Wang Z, Yang Y, Jia X, Li K. Functional disconnection and compensation in mild cognitive impairment: evidence from DLPFC connectivity using resting-state fMRI. PloS one. 2011;6(7):e22153.
12. du Boisgueheneuc F, Levy R, Volle E, et al. Functions of the left superior frontal gyrus in humans: a lesion study. Brain : a journal of neurology. 2006;129(Pt 12):3315-3328.
13. Adcock RA, Constable RT, Gore JC, Goldman-Rakic PS. Functional neuroanatomy of executive processes involved in dual-task performance. Proceedings of the National Academy of Sciences of the United States of America. 2000;97(7):3567-3572.
14. Mandal PK, Joshi J, Saharan S. Visuospatial perception: an emerging biomarker for Alzheimer's disease. Journal of Alzheimer's disease : JAD. 2012;31 Suppl 3:S117-135.
15. Thomann PA, Toro P, Dos Santos V, Essig M, Schroder J. Clock drawing performance and brain morphology in mild cognitive impairment and Alzheimer's disease. Brain and cognition. 2008;67(1):88-93.
16. Matsuoka T, Narumoto J, Shibata K, et al. Neural correlates of performance on the different scoring systems of the clock drawing test. Neuroscience letters. 2011;487(3):421-425.
17. Han Y, Lui S, Kuang W, Lang Q, Zou L, Jia J. Anatomical and functional deficits in patients with amnestic mild cognitive impairment. PloS one. 2012;7(2):e28664.
Figures