2348
No significant increase of magnetic susceptibility found in subcortical gray matter of patients with Alzheimer’s Disease1Philips Research Europe, Hamburg, Germany, 2University of Sheffield
Synopsis
Quantitative Susceptibility Mapping (QSM) and volumetry are used to study the deep gray-matter nuclei of patients with Alzheimer’s Disease (AD) and healthy control subjects. QSM is performed using “Joint background-field removal and segmentation-Enhanced Dipole Inversion” (JEDI), which leverages the information from automated model-based segmentation and allows the compact single-step formulation of the ill-posed inversion problem of QSM. For comparison QSM is also performed using L1-MEDI from the MEDI-Toolbox. The tissue magnetic susceptibility shows no significant difference between the Alzheimer group compared to the healthy control group. In contrast, the normalized volume of segmented gray-matter regions is significantly reduced in AD patients.
Purpose
Disturbed iron regulation and increased iron levels in specific brain regions have long been associated with Alzheimer’s Disease (AD) (see, e.g., [1]). The specific role of iron in the framework of AD, its causes and its consequences, are, however, still widely unclear, particularly due to the lack of reliable in vivo measurements. In recent years, MR-based Quantitative Susceptibility Mapping (QSM) has become available to estimate in vivo iron concentration in deep gray matter quantitatively, assuming that magnetic susceptibility of deep gray matter is predominantly determined by ferritin.Methods
21 patients (age: 62±7 yrs) with AD and 32 healthy controls (HC) (age: 68±11 yrs) were scanned on a 3T scanner (Ingenia, Philips Healthcare, Best, The Netherlands) using a 32-channel head-coil after obtaining informed consent from IRB. Data from one AD patient was excluded due to severe motion artifacts. The scans are part of an ongoing prospective study within the framework of the EU VPH-DARE@IT project and included a multi-echo gradient-echo sequence for QSM (FOV: (AP, FH, RL) 240×145×210 mm3, acq voxel 0.6×0.6×2.0 mm3, FA=14°, TE=3.5 ms, ΔTE=4 ms, 7 echoes, TR=31 ms, bipolar readout, BW=275.9 Hz/vx, SENSE (P/S) 1.8×1.2) and a T1-weighted magnetization-prepared TFE sequence, used for model-based segmentation (FOV: (AP, FH, RL) 240×240×170 mm3, acq voxel 0.94×0.94×1.0 mm3, FA=8°, TR=8 ms, TFE factor=222, inversion delay 1000 ms, BW=191.5 Hz/vx, SENSE (P/S) 1.0×2.2). - To solve the ill-posed inverse problem of QSM, the algorithm dubbed “Joint background-field removal and segmentation-Enhanced Dipole Inversion” (JEDI) [2] was chosen, which uses a priori knowledge from automated anatomical segmentation within a single step formulation of the inverse field-to-source problem. In previous studies, JEDI demonstrated improved accuracy and less long-range modulations in numerical simulations and in vivo volunteer data. Reconstruction parameters were identical for all subjects. In addition to using edge-information from the segmentation, edge-information from intermediate iterations of the susceptibility was derived using Sobel filters and further employed in the regularization term. Within the segmented regions, the mean of the susceptibility was computed, referencing to the mean of the susceptibility in the corpus callosum. For comparison, QSM reconstruction was performed using L1-MEDI in combination with the Laplacian Boundary Value (LBV) method as implemented in the MEDI toolbox with the default settings [3]. In addition, the volume of the segmented regions normalized to total brain volume was computed.Results
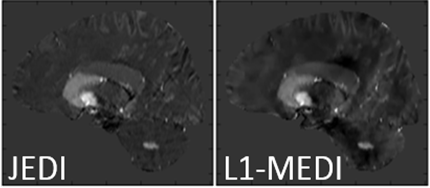
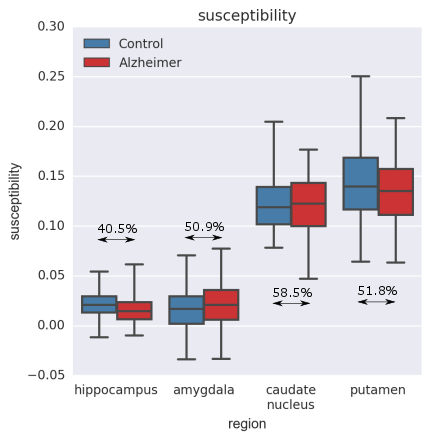
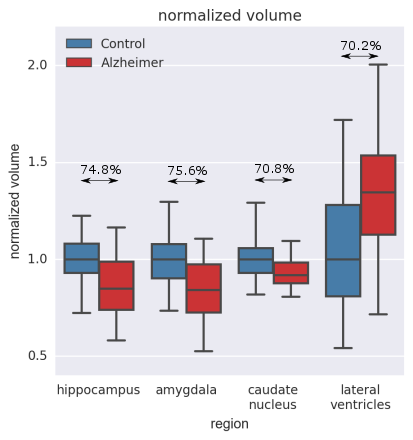
Figure 1 exemplarily shows sagittal slices of the susceptibility maps for an AD patient reconstructed using JEDI and L1-MEDI, respectively. Figure 2 shows box-and-whisker plots of the mean susceptibility in different segmented brain regions for the AD and the HC groups, reconstructed using JEDI. In none of the segmented regions a statistically significant difference between groups is observed, for both JEDI and L1-MEDI (i.e., AUC of ROC below 60% for all cases). In contrast, as shown in Figure 3, a statistically significant difference between groups (AUC of ROC up to 75%) is observed for the normalized size of the segmented brain regions (normalized size of all brain regions is lower in the AD group than in the HC group except for the ventricles, where larger size is found for the AD group, see Fig. 3).Discussion / Conclusion
Using a fully automated approach for QSM reconstruction and region-specific evaluation, which is compatible with a clinical setting, the tissue magnetic susceptibility between a group of AD patients and a group of age-matched controls has been studied. In contrast to expectations (see, e.g., [4]), no significant difference has been found in the mean susceptibility between the AD group and the HC group. This result is confirmed by using an independent reconstruction program, using a different approach for background-field removal and dipole inversion. The variability of mean susceptibility values within the subject groups is unlikely to be caused by the QSM reconstruction, for example due to excessive sensitivity to noise, and rather reflects substantial, subject-specific biological variations. The reproducibility of the QSM reconstruction method used here has been assessed by repeatedly scanning two volunteers over several months, finding a standard deviation of the mean below 0.01 ppm for all brain regions. Working without a reference region does not change these results. This excludes the possibility of disease-related changes to the chosen reference tissue, the corpus callosum, potentially masking changes to the studied regions. The volume changes of the brain regions of the AD group confirm numerous previous findings, and, in this study, shows a higher discriminative power between AD and HC groups.Acknowledgements
This project has received funding from European Union’s Seventh Framework Programme, grant no. 601055.References
[1] Tao Y et al., Perturbed iron distribution in Alzheimer's disease serum, cerebrospinal fluid, and selected brain regions: a systematic review and meta-analysis, Journal of Alzheimer’s Disease: 42 (2014): 679–90
[2] Meineke J et al., Quantitative Susceptibility Mapping Using Segmentation-Enabled Dipole Inversion, ISMRM 25 (2015) 3321
[3] MEDI toolbox, Cornell MRI Research Lab, http://weill.cornell.edu/mri/pages/qsm.html
[4] Acosta-Cabronero J et al., In Vivo Quantitative Susceptibility Mapping (QSM) in Alzheimer’s Disease, PLoS ONE 8, (2013): e81093.
Figures