2347
Demyelination in Mild Cognitive Impairment1National Institute on Aging (NIA), National Institutes of Health (NIH), Baltimore, MD, United States
Synopsis
An emerging hypothesis suggests that the underlying pathophysiology of mild cognitive impairment (MCI) involves alterations in brain myelination. These alterations may represent an important correlate of dementia. Several studies have examined this correlation; however, these earlier analyses were performed using non-myelin-specific methods such as relaxation times, magnetization transfer and diffusion. This greatly complicates the interpretation of such imaging results in terms of myelin content. Our results show direct evidence of MWF alterations and loss in MCI using a direct measure of myelin-bound water.
PURPOSE:
Mild cognitive impairment (MCI) is a neurological disease characterized by progressive decline in cognitive abilities, including memory, language, and judgment. Further, MCI may represent a prodromal phase of Alzheimer's disease (AD). An emerging hypothesis for the underlying pathophysiology of MCI and AD implicates alterations in myelination as an important correlate.1-4 Studies in which these correlations have been explored have relied upon conventional indirect and inferential measurements of brain myelin content.5-10 Indeed, although most quantitative imaging outcomes such as apparent diffusion coefficient, magnetization transfer (MT), longitudinal relaxation time (T1) and transverse relaxation time (T2) are believed to provide information related to myelin content, they are highly indirect measures of tissue properties; this greatly complicates the interpretation of such imaging results. In this study, we show evidence of MWF alterations and loss in MCI using a new, relatively direct, measure of myelin-bound water. The present work builds on the studies of MacKay et al.11 and Deoni et al.12 for multicomponent brain mapping.EXPERIMENTAL DESIGN & METHODS:
Six subjects were studied: two healthy young controls (one female, age 35, and one male, age 45), two healthy old controls (two males, ages 85 and 94), and two old subjects with documented MCI (two males ages 75 and 83). Scans were performed on a 3T Philips Achieva MRI system equipped with an eight-channel phased-array head coil. For each volunteer, the imaging protocol included:
· BMC-mcDESPOT12-13 for direct myelin water fraction (MWF) and T1 and T2 mapping: 3D SPGR and bSSFP images were acquired over a sequence of flip angles (FAs) and with very short TRs. The bSSFP images were acquired twice with phase increment of 0o or 180o to correct for off-resonance effects.13 Two fast spin-echo (SE) images with different excitation FAs were acquired to correct for B1 inhomogeneity.13 For each volunteer, MWF maps were then calculated using the Bayesian Monte Carlo (BMC) analysis of the two-component echo-time-corrected mcDESPOT signal model.14-17 We also generated corresponding T1 and T2 maps from the SPGR and bSSFP images.12-17
· Paired 3D spin-echo (SE) images with (Sw) and without (Swo) a radiofrequency off-resonance prepulse (1100 Hz and B1 = 13.5 µT) were acquired for MT ratio (MTR) mapping. Images were obtained with TR = 100 ms, TE = 2.1 ms and FA = 18o. MTR maps were generated from corresponding intensities through MTR = 1 - Sw/Swo.
All images were acquired with SENSE factor of 2 and an identical large field-of-view of 240 mm x 208 mm x 150 mm, and reconstructed to an isotropic voxel volume of 1 mm3. In addition to visual inspection, we calculated the mean and standard deviation (SD) for each estimated parameter over several white matter regions of the brain.
RESULTS & DISCUSSION:
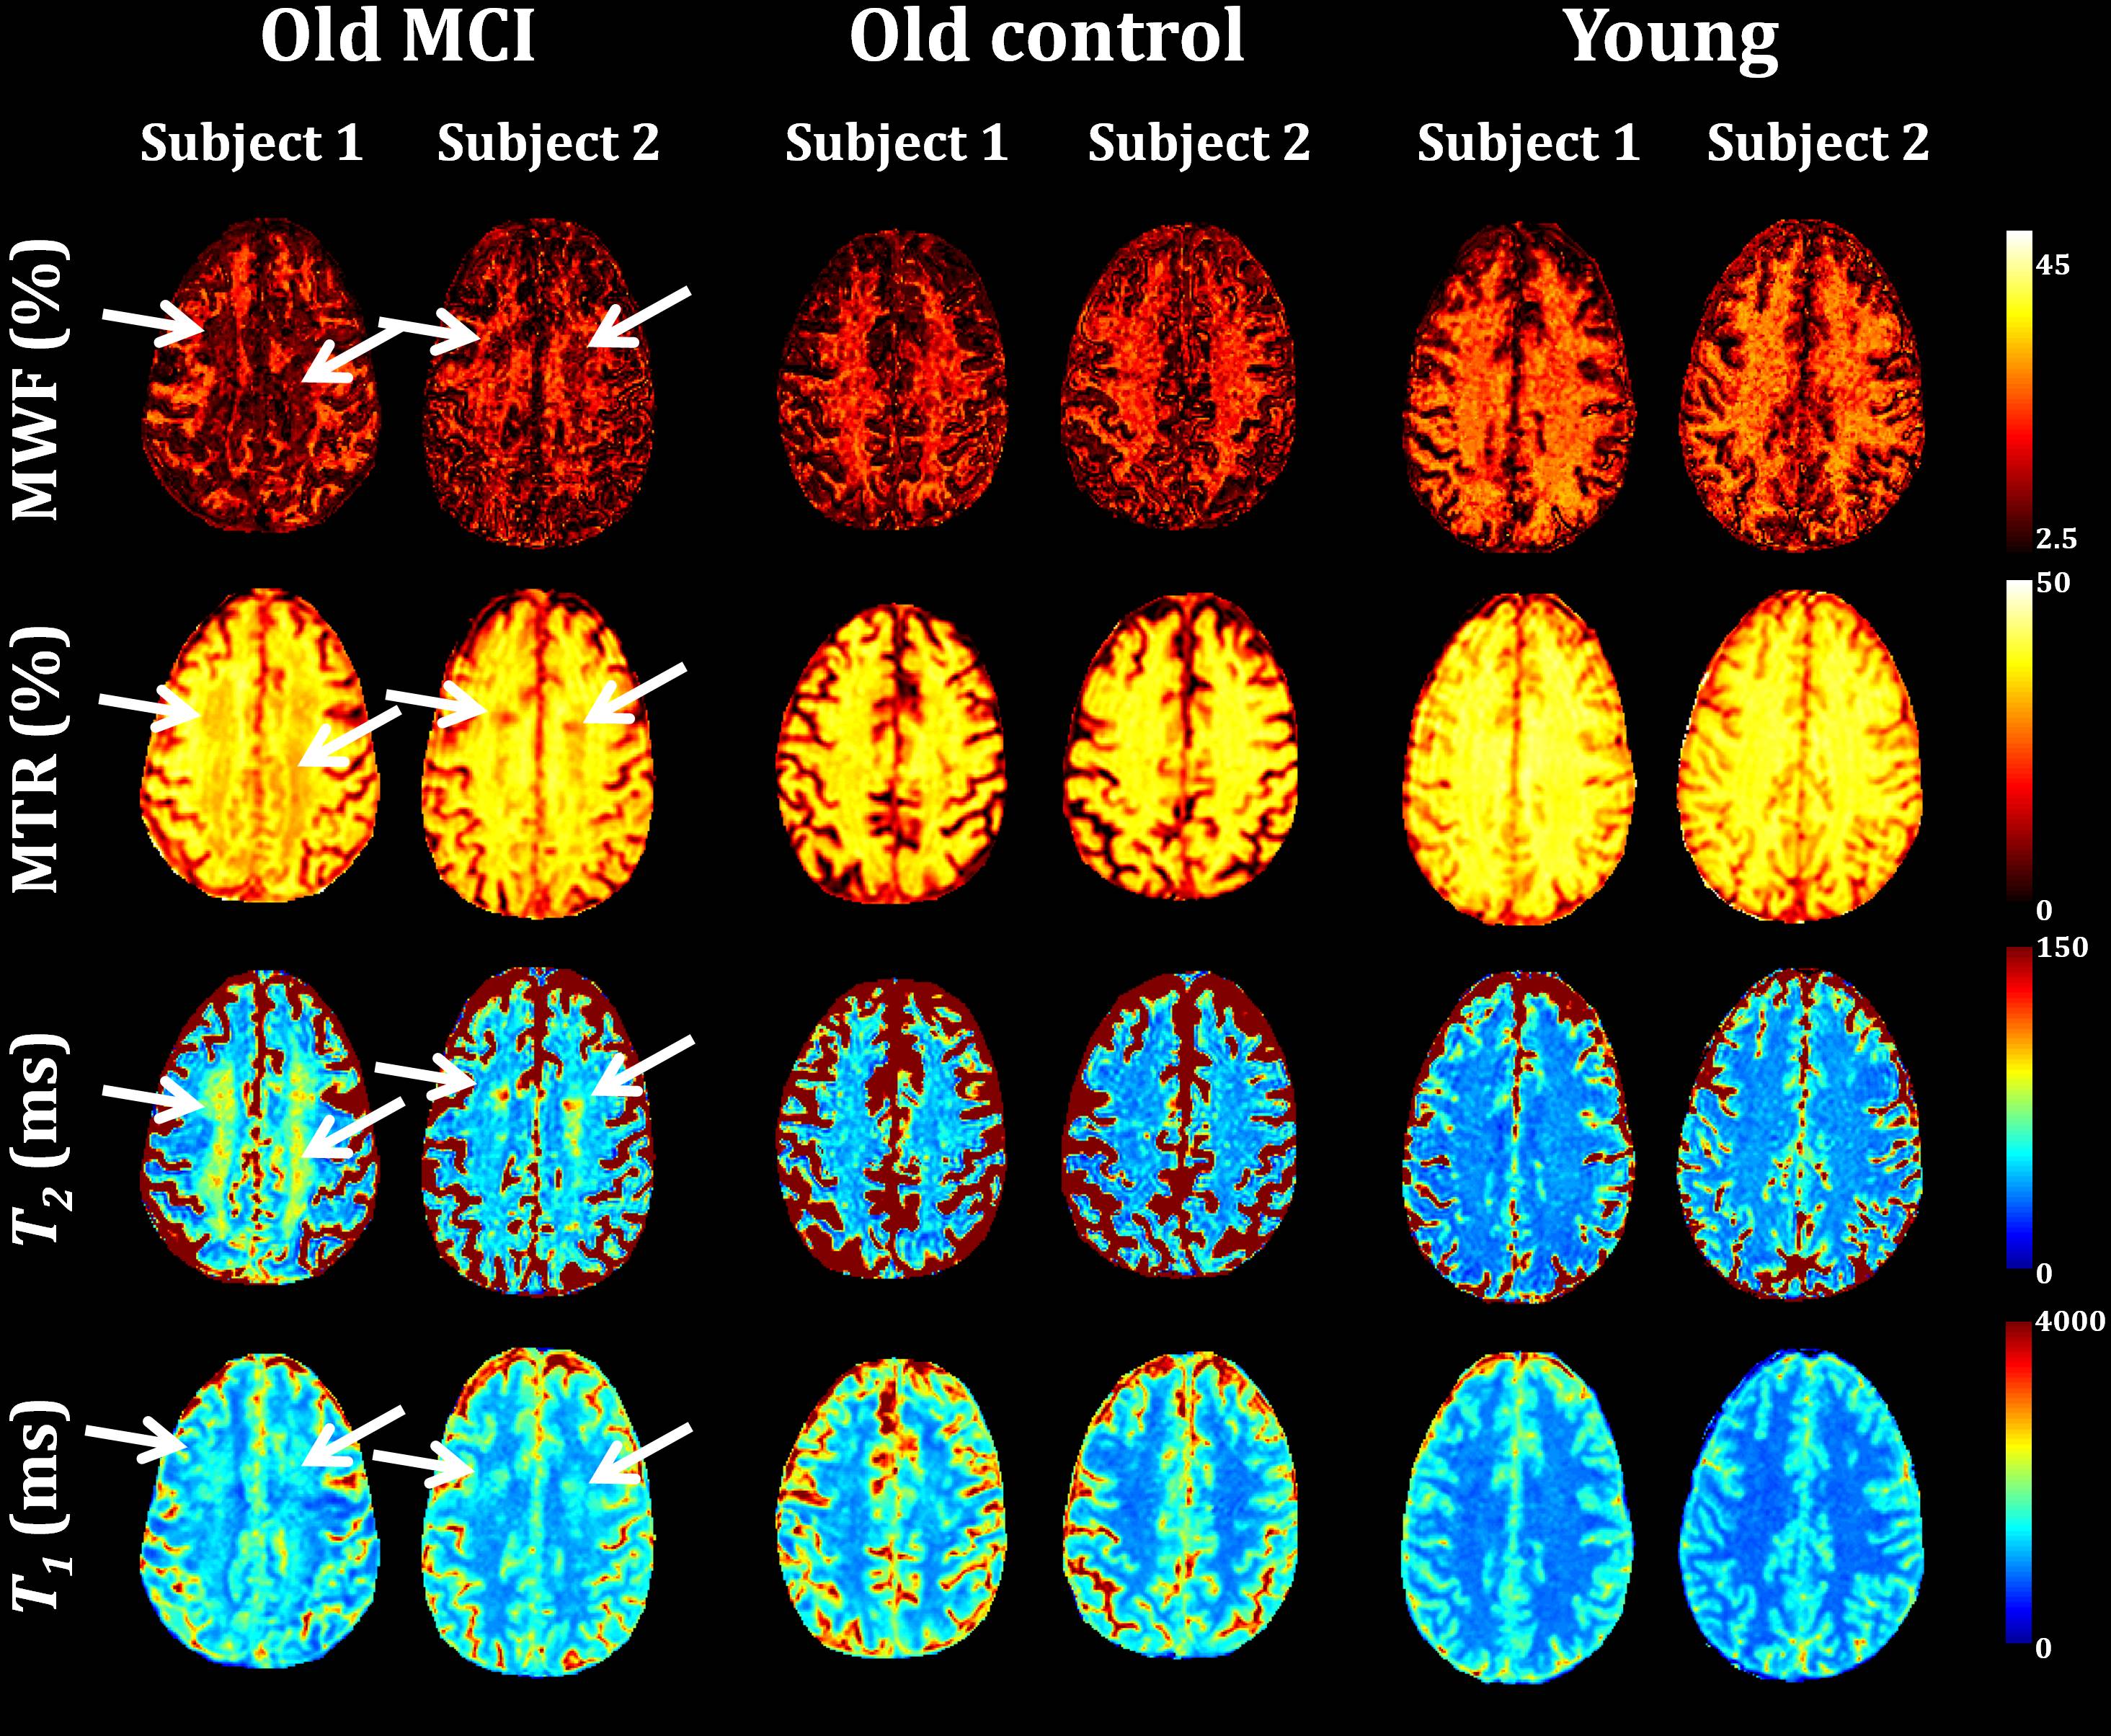
The figures below summarize the results obtained from the six volunteers. Visual inspection of parameter maps (Fig. 1) and quantitative analysis (mean ± SD) (Fig. 2) showed a substantial decrease in MWF with age, in good agreement with recent literature.18 Moreover, parameter maps showed a substantial decrease in MWF in several brain regions of the subjects diagnosed with MCI in comparison with the old healthy control subjects. As expected, the MWF decrease was accompanied by a decrease in MTR and an increase in both T1 and T2, although these conventional measures cannot readily be interpreted in terms of myelin concentration. The decrease in MTR, indicating decreased local myelin content, is attributable to decreased proton exchange between a more restricted macromolecular environment and the less-restricted intra- and extra-cellular water environments.5-6,19 Concomitant increases in T1 and T2 are likely associated with the accompanying decrease in the lipid-rich myelin sheath and associated proteins, and replacement of myelin by less-restricted cellular water.7,9-10,19 These results of non-myelin-specific measurements are in excellent agreement with the literature.5-10,19 However, BMC-mcDESPOT permits a much more direct quantification of regional myelin content than is possible with these other indirect measures, and provides high quality whole brain MWF mapping.16-17CONCLUSIONS:
Our results show what we believe to be the first demonstration of MWF alterations and loss in MCI using a direct measure of MWF. In addition, we found lower MWF in the old as compared to the young subjects. The confirmatory, non-myelin-specific, techniques of MTR, T1 and T2 measurements were all fully consistent with our direct MWF maps.Acknowledgements
This work was supported by the Intramural Research Program of the NIH, National Institute on Aging.References
1. Carmeli C, Donati A, Antille V, et al. Demyelination in mild cognitive impairment suggests progression path to Alzheimer’s disease. PlosOne. 2013;8:e72759.
2. Gold BT, Jiang Y, Powell DK, et al. Multimodal imaging evidence for axonal and myelin deterioration in amnestic mild cognitive impairment. J Alzheimers Dis. 2012;31(3):S19-31.
3. Bartzokis G, Lu PH, Mintz J. Human brain myelination and amyloid beta deposition in Alzheimer’s disease. Alzheimers Dement. 2007;3:122-125.
4. Desai MK, Sudol KL, Janelsins MC, et al. Triple-transgenic Alzheimer’s disease mice exhibit region-specific abnormalities in brain myelination patterns prior to appearance of amyloid and tau pathology. Glia. 2009;57:54-65.
5. van der Flier WM, van den Heuvel DM, Weverling-Rijnsburger AW, et al. Magnetization transfer imaging in normal aging, mild cognitive impairment, and Alzheimer's disease. Ann Neurol. 2002;52(1):62-67.
6. Kabani NJ, Sled JG, Chertkow H. Magnetization transfer ratio in mild cognitive impairment and dementia of Alzheimer’s type. NeuroImage. 2002 ;15604-610.
7. Haris M, McArdle E, Fenty M, et al. Early marker for Alzheimer’s disease: Hippocampus T1rho (T1ρ) estimation. J Magn Reson Imaging. 2009;29(5):1008-1012.
8. Mascalchi M, Ginestroni A, Bessi V, et al. Regional analysis of the magnetization transfer ratio of the brain in mild Alzheimer disease and amnestic mild cognitive impairment. AJNR Am J Neuroradiol. 2013.
9. Arfanakis K, Gui M, Ashish A, et al. Investigating the medial temporal lobe in Alzheimer’s disease and mild cognitive impairment, with turboprop diffusion tensor imaging, MRI-volumetry, and T2-relaxometry. Brain Imaging Behav. 2007;1(1):11-21.
10. Dawe RJ, Bennett DA, Schneider JA, et al. Ex vivo T2 relaxation: associations with age-related neuropathology and cognition. Neurobiol Aging. 2014;35(7):1549-1561.
11. Mackay A, Whittall K, Adler J, et al. In vivo visualization of myelin water in brain by magnetic resonance. Magn Reson Med. 1994;31(6):673-677.
12. Deoni SCL, Rutt BK, Arun T, et al. Gleaning multicomponent T1 and T2 information from steady-state imaging data. Magn Reson Med. 2008;60(6):1372-1387.
13. Deoni SCL. Correction of main and transmit magnetic field (B0 and B1) inhomogeneity effects in multicomponent-driven equilibrium single-pulse observation of T1 and T2. Magn Reson Med. 2011;65(4):1021-1035.
14. Bouhrara M, Reiter DA, Celik H, et al. Analysis of mcDESPOT- and CPMG-derived parameter estimates for two-component nonexchanging systems. Magn Reson Med. 2016;75(6):2406-2420.
15. Bouhrara M, Spencer RG. Incorporation of nonzero echo times in the SPGR and bSSFP signal models used in mcDESPOT. Magn Reson Med. 2015;74(5):1227-1235.
16. Bouhrara M, Spencer RG. Improved determination of the myelin water fraction in human brain using magnetic resonance imaging through Bayesian analysis of mcDESPOT. NeuroImage. 2016;127:456-471.
17. Bouhrara M, Spencer RG. Rapid Simultaneous High-resolution Mapping of Myelin Water Fraction and Relaxation Times in Human Brain using BMC-mcDESPOT. NeuroImage. 2016; dx.doi.org/10.1016/j.neuroimage.2016.09.064.
18. Arshad M, Stanley JA, Raz N, et al. Adult age differences in subcortical myelin content are consistent with protracted myelination and unrelated to diffusion tensor imaging indices. NeuroImage. 2016;143:26-39.
19. Deoni SCL. Quantitative Relaxometry of the Brain. Top Magn Reson Imaging. 2010;21(2) 101-113.
Figures