2346
Global Change of Intrinsic Functional Networks as an Imaging biomarker of Alzheimer’s disease1Translational Imaging Research Center, College of Medicine, Taipei Medical University, Taipei, Taiwan, 2Department of Radiology, School of Medicine, College of Medicine, Taipei Medical University, Taipei, Taiwan, 3Department of Biomedical Imaging and Radiological Sciences, National Yang-Ming University, Taipei, Taiwan, 4Department of Medical Imaging, Taipei Medical University Hospital, Taipei, Taiwan, 5Department of Medical Research, Taipei Medical University Hospital, Taipei, Taiwan, 6School of Biomedical Engineering, College of Biomedical Engineering, Taipei Medical University, Taipei, Taiwan
Synopsis
The change of whole-brain connectivity during resting state can be a reliable feature in discriminating patients with Alzheimer’s disease (AD) from patients with mild cognitive impairment and cognitively healthy elders. Significant correlations between resting-state functional connectivity and cognitive decline measured by Mini-Mental State Examination (MMSE) were further identified.
Background and Purpose
Resting-state functional MRI (rs-fMRI) is a non-invasive technique that can measure subtle functional changes in the brain. In addition to existing biomarkers, growing evidence show that the alterations of brain intrinsic connectivity networks can be potential imaging biomarkers of AD1. The hippocampus and posterior cingulate cortex (PCC) are two foci that most frequently reported in rs-fMRI studies when comparing AD to cognitively normal elders2,3. The hippocampus is one of the neuropathological origins of AD, and the hippocampus as well as the PCC are essential to the function of episodic memory. From a different aspect of the whole-brain functional organization, the changes of the large-scale network parameters were suggested to be useful in discriminating AD from controls4. In this study, we aim to determine whether the focal change of functional connectivity (hippocampus and PCC associated connectivity) or the global change of intrinsic functional networks (whole-brain connectivity) can be a reliable imaging biomarker for the discrimination between AD, mild cognitive impairment (MCI), and normal controls (NC).Materials and Methods
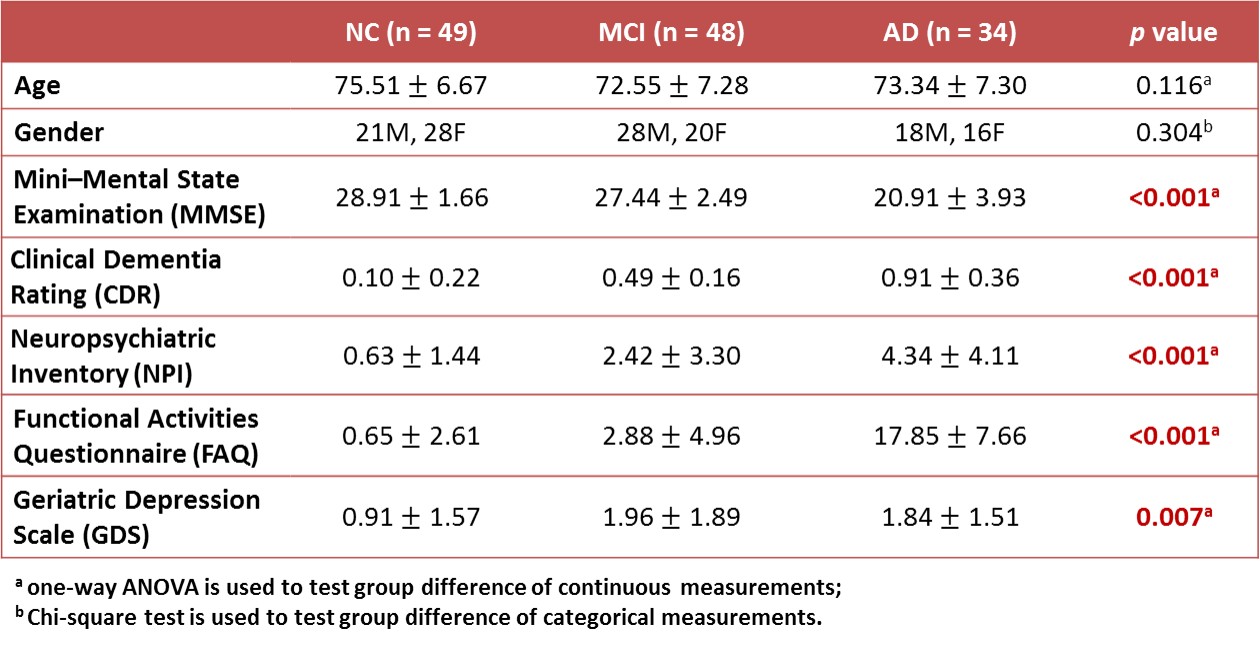
MR data and relevant clinical assessments of 131 subjects, including 49 NC, 48 patients with MCI, and 34 patients with diagnosed AD, were obtained from the Alzheimer’s Disease Neuroimaging Initiative (ADNI) database (Table 1). MRI data, including 3D T1-weighted images and BOLD rs-fMRI, acquired using 3T MR scanners were used for the subsequent analyses. The detailed imaging protocols are given on the ADNI website (http://adni.loni.usc.edu/methods/documents/mri-protocols).
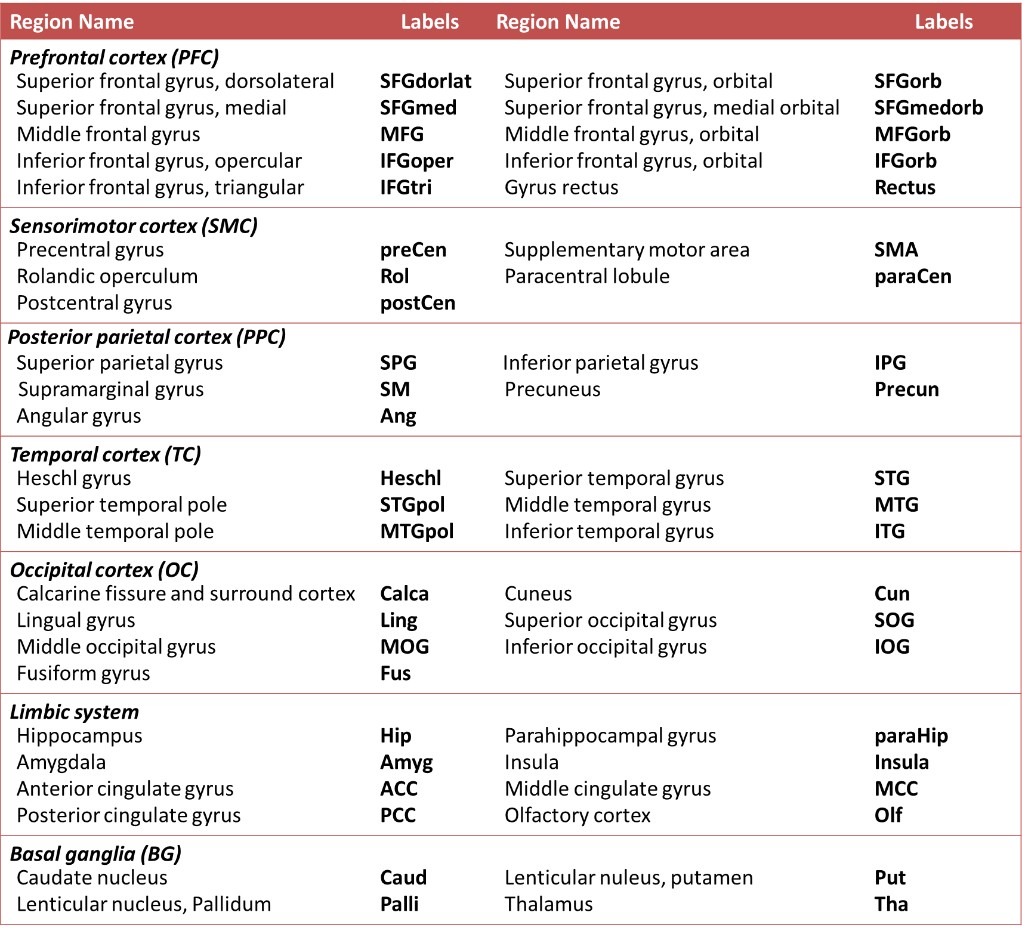
The standard preprocessing steps were applied to the fMRI data using SPM8 to correct for slice timing, realign, spatially normalize, and spatially smooth (FWHM of 6 mm). The cerebral gray matter was partitioned into 90 brain regions using Automatic Anatomical Labeling (Table 2)5. The confounding effects of head motion, white-matter and ventricle signals were regressed out, and the Pearson’s correlation coefficient between regional BOLD signals (0.01-0.10 Hz) was applied to measure the functional connectivity followed by Fisher’s r-to-z transform. One-sample t-test was employed to determine the significance of functional connectivity (p<0.05, with FDR correction). Insignificant connectivity was excluded from the subsequent classification.
Two sets of functional connectivity were used for classifying AD, MCI and NC. The first set included the functional connectivity associated with the hippocampus, parahippocampus, and PCC. The second one contained whole-brain functional connectivity without any preference. For each dataset, the connectivity was sorted based on the importance score6, and the first 90 connections were selected as the most informative features to train the linear discriminant classifier7. Model performance was evaluated using the receiver operator characteristics in differentiating between three groups.
Results and Discussion
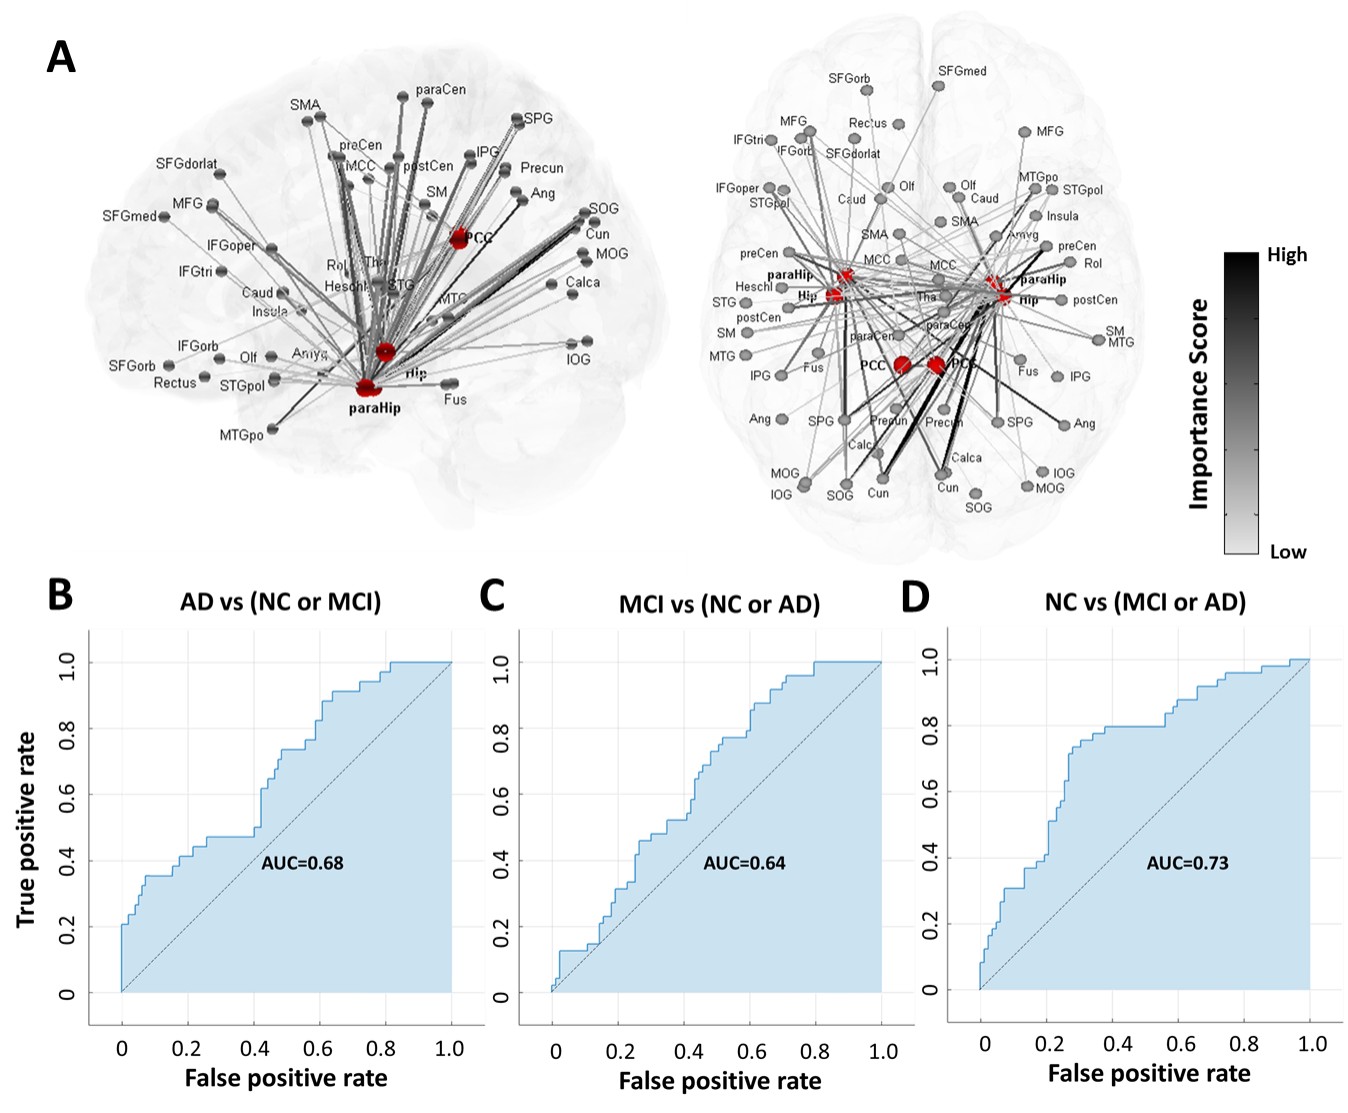
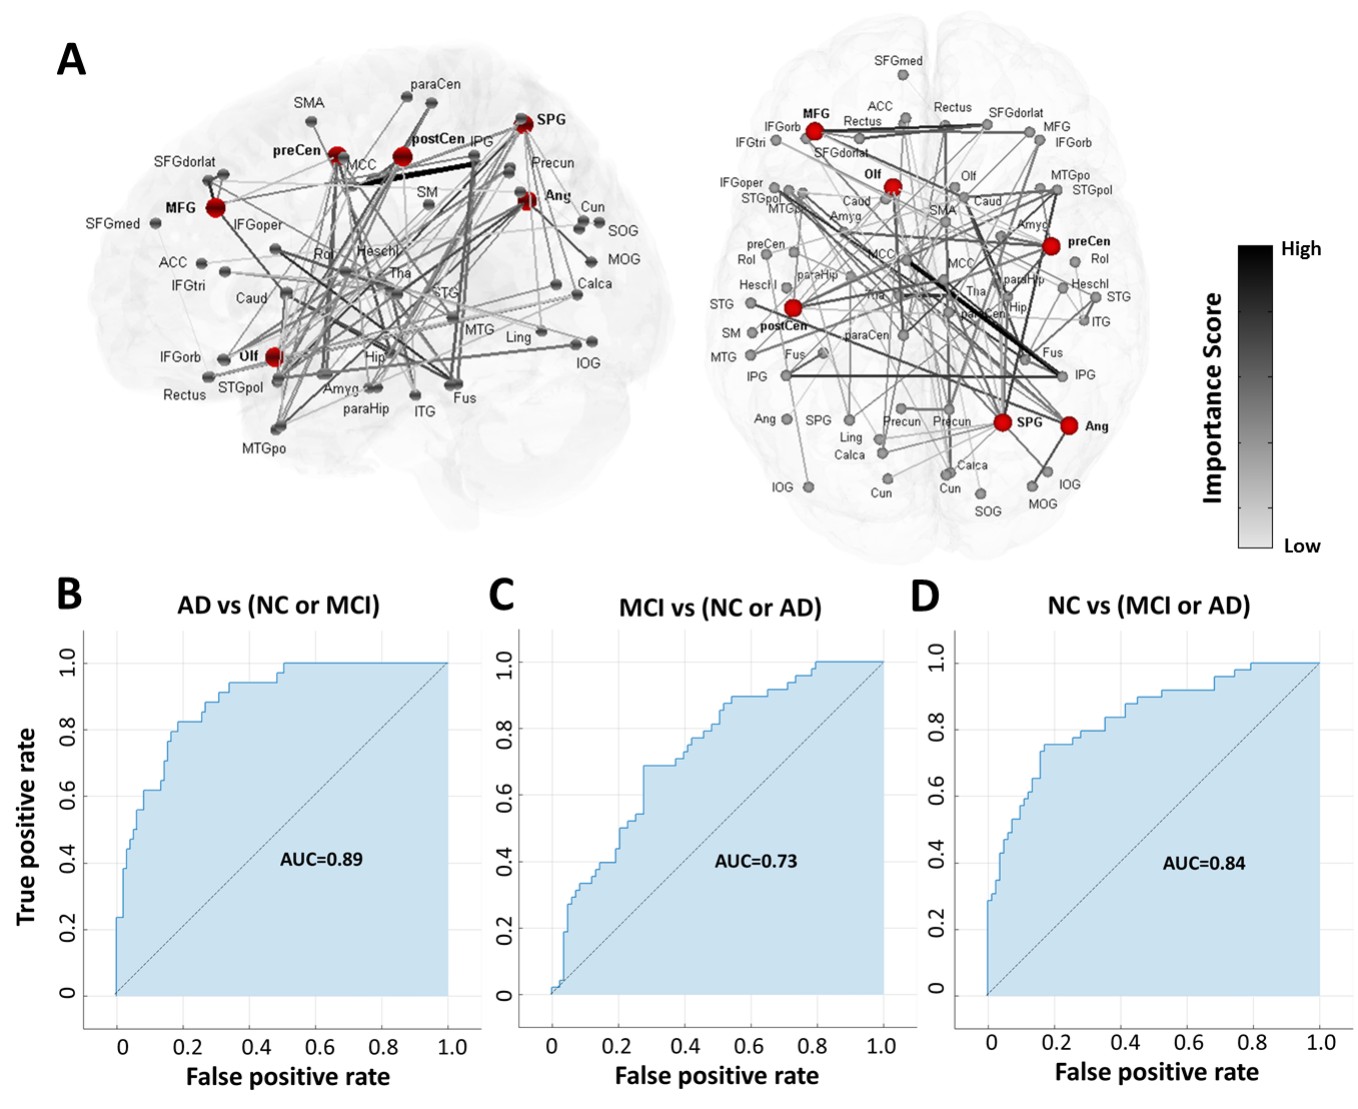
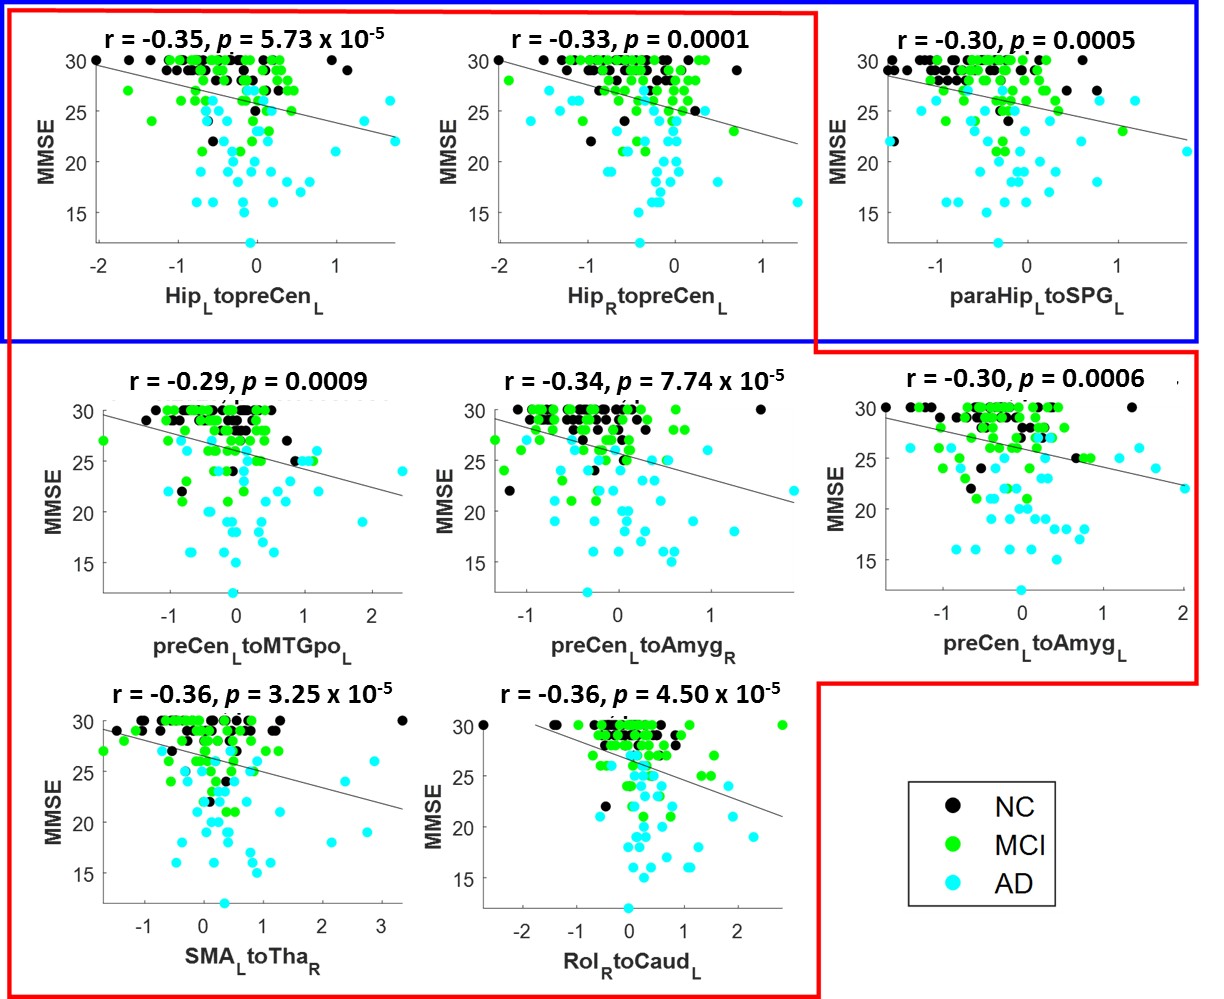
Figure 1A illustrates the selected connectivity in the first feature set associated with the hippocampus, parahippocampus, and PCC. Long-distance functional connectivity, such as the connections between hippocampal regions and sensorimotor, posterior parietal, and occipital regions, presented higher importance scores (potential probes of group difference). Only 0.68, 0.64, and 0.73 of the Area Under the Curve (AUC) can be achieved in differentiating AD, MCI, and NC from other groups, respectively (Fig.1B to 1D). For the second dataset using the whole-brain connectivity, the distribution of the selected functional connectivity is distinct from the first one. Only a small group of connectivity related to the hippocampus and parahippocampus was preserved (Fig.2A), and regions with the most selected connectivity are located in the posterior parietal, sensorimotor, olfactory regions, and middle frontal gyrus. With these selected features, the classifier can reach 0.89, 0.73, and 0.84 of AUC in differentiating AD, MCI, and NC from other groups, respectively (Fig.2B to 2D). It is noted that the AUCs for the classification of MCI are lowest for both feature sets because the MCI is a transition state between NC and AD, and therefore easily to be misclassified into two other groups. We further performed a partial correlation analysis with control of age and gender effects to investigate the relations between the selected functional connectivity and Mini-Mental State Examination (MMSE). Three hippocampus- and parahippocampus-related functional connections in the first dataset were significantly correlated to the MMSE (blue box in Fig.3). For the whole-brain connectivity dataset, significant correlations with MMSE were identified in seven functional connections (red box in in Fig.3). The connectivity from bilateral hippocampi to the left precentral gyrus (primary motor cortex) was included in both feature sets suggesting its critical role in the classification between AD, MCI, and NC. Our results indicated that functional connectivity associated with hippocampal regions is essential for the transition from NC to AD and cognitive decline measured by MMSE. Furthermore, employment of widely distributed functional connectivity can further provide a reliable image biomarker in identifying patients with AD.Acknowledgements
This study was funded in part by the Taipei Medical University (TMU103-AE1-B20) and the Ministry of Science and Technology (MOST 105-2314-B-038-014), Taipei, Taiwan.References
1. Weiner MW, Veitch DP, Aisen PS, Beckett LA, Cairns NJ, Cedarbaum J, Green RC, Harvey D, Jack CR, Jagust W, Luthman J. 2014 Update of the Alzheimer's disease neuroimaging initiative: a review of papers published since its inception. Alzheimer's & Dementia. 2015;11(6):e1-20.
2. Zhang HY, Wang SJ, Liu B, Ma ZL, Yang M, Zhang ZJ, Teng GJ. Resting Brain Connectivity: Changes during the Progress of Alzheimer Disease 1. Radiology. 2010;256(2):598-606.
3. Sorg C, Riedl V, Mühlau M, Calhoun VD, Eichele T, Läer L, Drzezga A, Förstl H, Kurz A, Zimmer C, Wohlschläger AM. Selective changes of resting-state networks in individuals at risk for Alzheimer's disease. Proceedings of the National Academy of Sciences. 2007;104(47):18760-5.
4. Supekar K, Menon V, Rubin D, Musen M, Greicius MD. Network analysis of intrinsic functional brain connectivity in Alzheimer's disease. PLoS Comput Biol. 2008;4(6):e1000100.
5. Tzourio-Mazoyer N, Landeau B, Papathanassiou D, Crivello F, Etard O, Delcroix N, Mazoyer B, Joliot M. Automated anatomical labeling of activations in SPM using a macroscopic anatomical parcellation of the MNI MRI single-subject brain. Neuroimage. 2002;15(1):273-89.
6. Liu H, Motoda H. Feature selection for knowledge discovery and data mining. Springer Science & Business Media; 2012.
7. Izenman AJ. Linear discriminant analysis. InModern Multivariate Statistical Techniques. Springer New York; 2013 (pp. 237-280).
Figures