2344
The profile pattern of white matter hyperintensities (WMH) has a primary role on discriminating the cognitive function.1brain & cognitive sciences, Seoul national university, Seoul, Korea, Republic of, 2Psychiatry, Seoul National University Budang Hospital, Budang, Korea, Republic of, 3Asan Medical Center, Korea, Republic of
Synopsis
The areas in cerebral white matter appearing hyperintense on T2-weighted and fluid-attenuated inverse recovery (FLAIR) MRI are commonly referred to as white matter lesions (WMLs). Diverse scores and rating systems have been used for evaluating WMLs. However, these visual rating scales are still qualitative and subjective, leading to low reliability and reproducibility. The purpose of this study is to investigate the relation between cognitive functions and WMLs clustered by their profiles of distance from the ventricle, establishing the quantitative and objective evaluation of WMLs.
INTRODUCTION
The areas in cerebral white matter appearing hyperintense on T2-weighted and fluid-attenuated inverse recovery (FLAIR) magnetic resonance imaging (MRI) are commonly referred to as white matter lesions (WMLs). WMLs are frequently found in healthy elderly people, but reported to influence mental and physical function in relation with various diseases. According to their form and location, WMLs are divided into two broad types: periventricular and deep WMLs. Diverse scores and rating systems have been used for evaluating WMLs [1]. However, the heterogeneity of terminology and definitions in WMLs make it difficult to compare lesions and clinical findings. Furthermore, these visual rating scales are still qualitative and subjective, leading to low reliability and reproducibility. The purpose of this study is to investigate the relation between cognitive functions and WMLs clustered by their profiles of distance from the ventricle, establishing the quantitative and objective evaluation of WMLs.METHODS
Human Subjects: MRI data and neuropsychological (NP) test scores of 632 participants from Korean Longitudinal Study on Cognitive Aging and Dementia (KLOSCAD) [2] and visitors to Dementia Clinic of Seoul National University Bundang Hospital were analyzed. The total participants consisted of 326 cognitively normal (NC) elderly volunteers, 218 mild cognitive impairment (MCI), and 88 Alzheimer’s disease (AD) patients (mean age: 73.86 ± 7.44years, male: 267, female: 365).
MRI Data Acquisition: 3D T1-weighted Turbo Field Echo MR images were acquired on a 3T Philips scanner with TR/TE=8.1/4.6ms, 175×240×240 matrix, and 1mm3 voxel size. FLAIR was also acquired with TR/TE/TI=9900/125/2800 ms, the same voxel size.
Neuropsychological Tests: The neuropsychological tests included the following: verbal fluency (VFT), boston naming (BNT), mini-mental state exam (MMSE), word list memory (WLMT), constructional praxis (CPT), word list recall (WLRT), word list recognition (WLRcT), recall of constructional praxis (CRT), trail making A&B (TMT), severe cognitive impairment rating scale (SCIRS), recognition of constructional praxis (CRcT), digit span forward and backward (DSF and DSB), frontal assessment battery (FAB), and clock drawing task (CLOX) [3-6]. Total score 1 and 2 are defined by the sum of J1~7 and J1~8, respectively.
Data Analysis: The preprocessing of raw data included bias correction, reslicing, and coregistration between T1 and FLAIR. White matter hyperintensity (WMH) on FLAIR were segmented using in-house algorithm [7]. Each WMH volume along every 1mm distance from the ventricle was calculated, resulting in WMH profile of each subject in in-house Matlab code. The relative denoised WMH profiles divided by total volume were clustered by K-means algorithm into four different patterns. To compare the z-scores of NP tests between the clusters, one-way Analysis of Variance (ANOVA) was performed using PASW statistics software. Analysis of covariance (ANCOVA) was also performed to compare the sum scores of NP tests between the clusters with sex, age, and education as covariates.
RESULTS and DISCUSSION
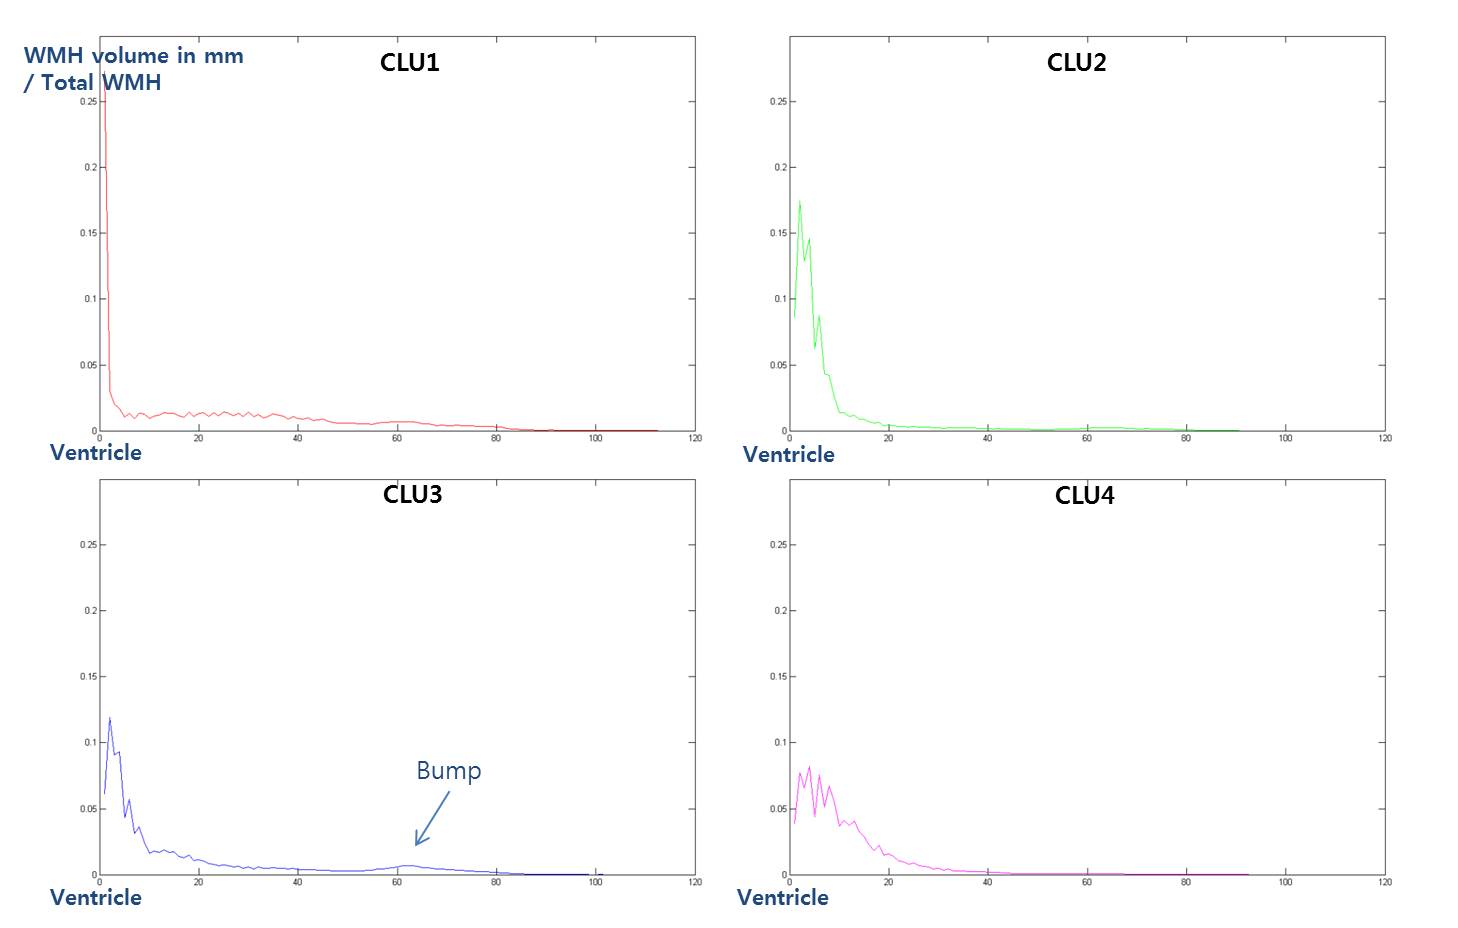
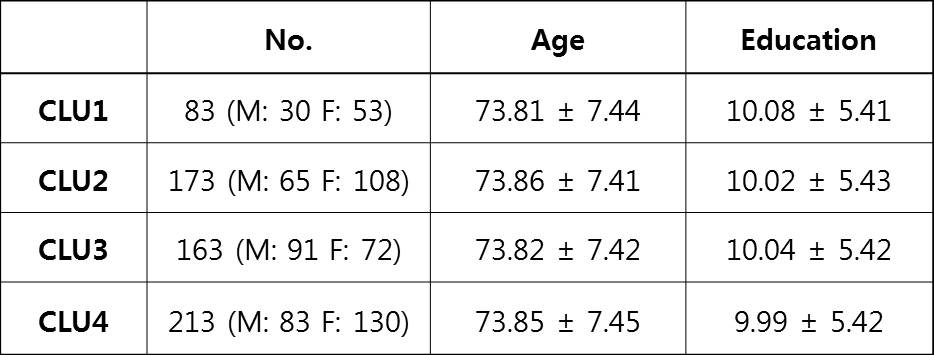
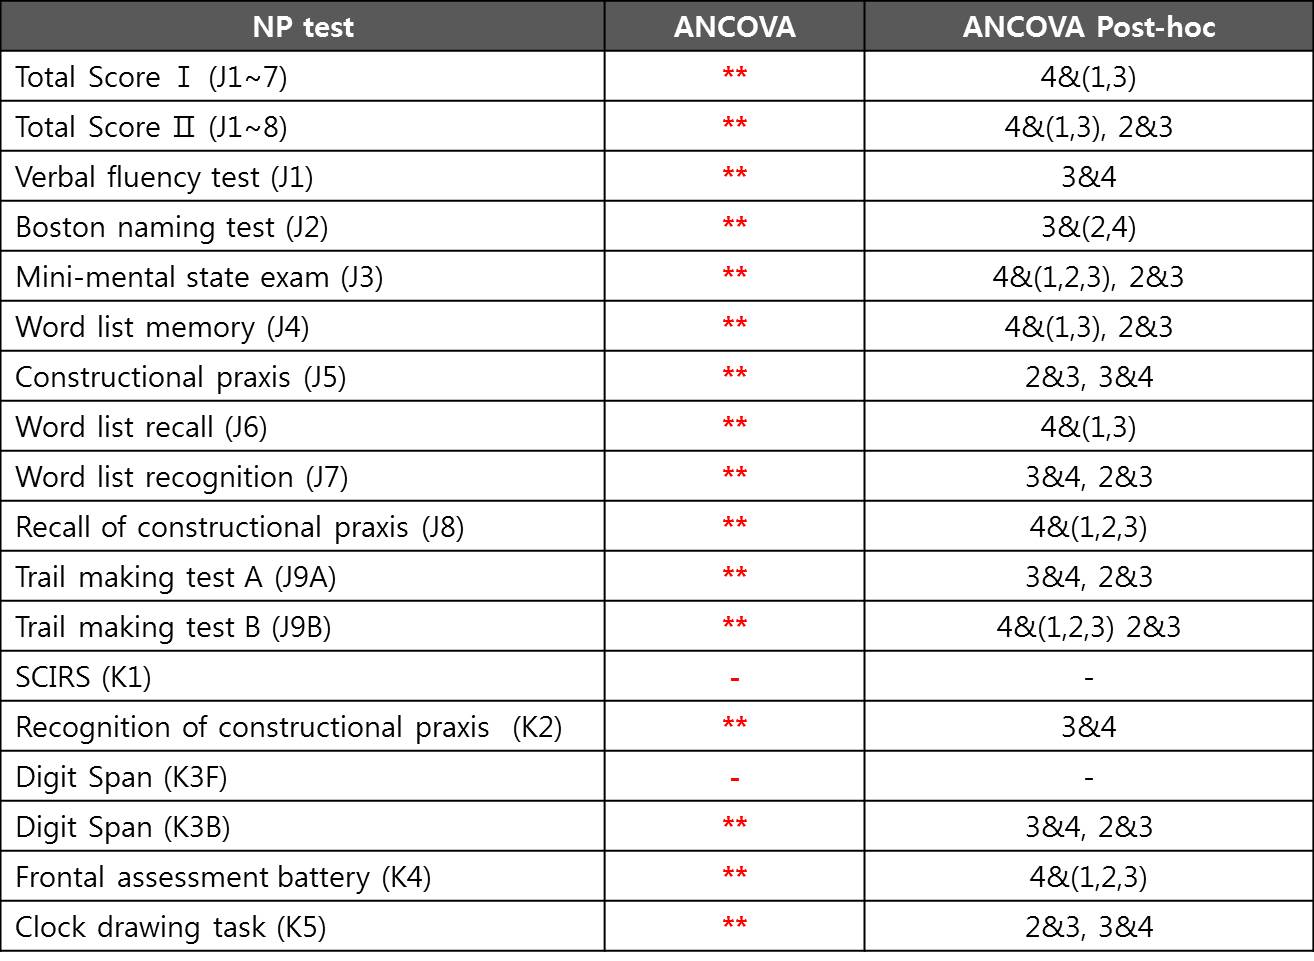
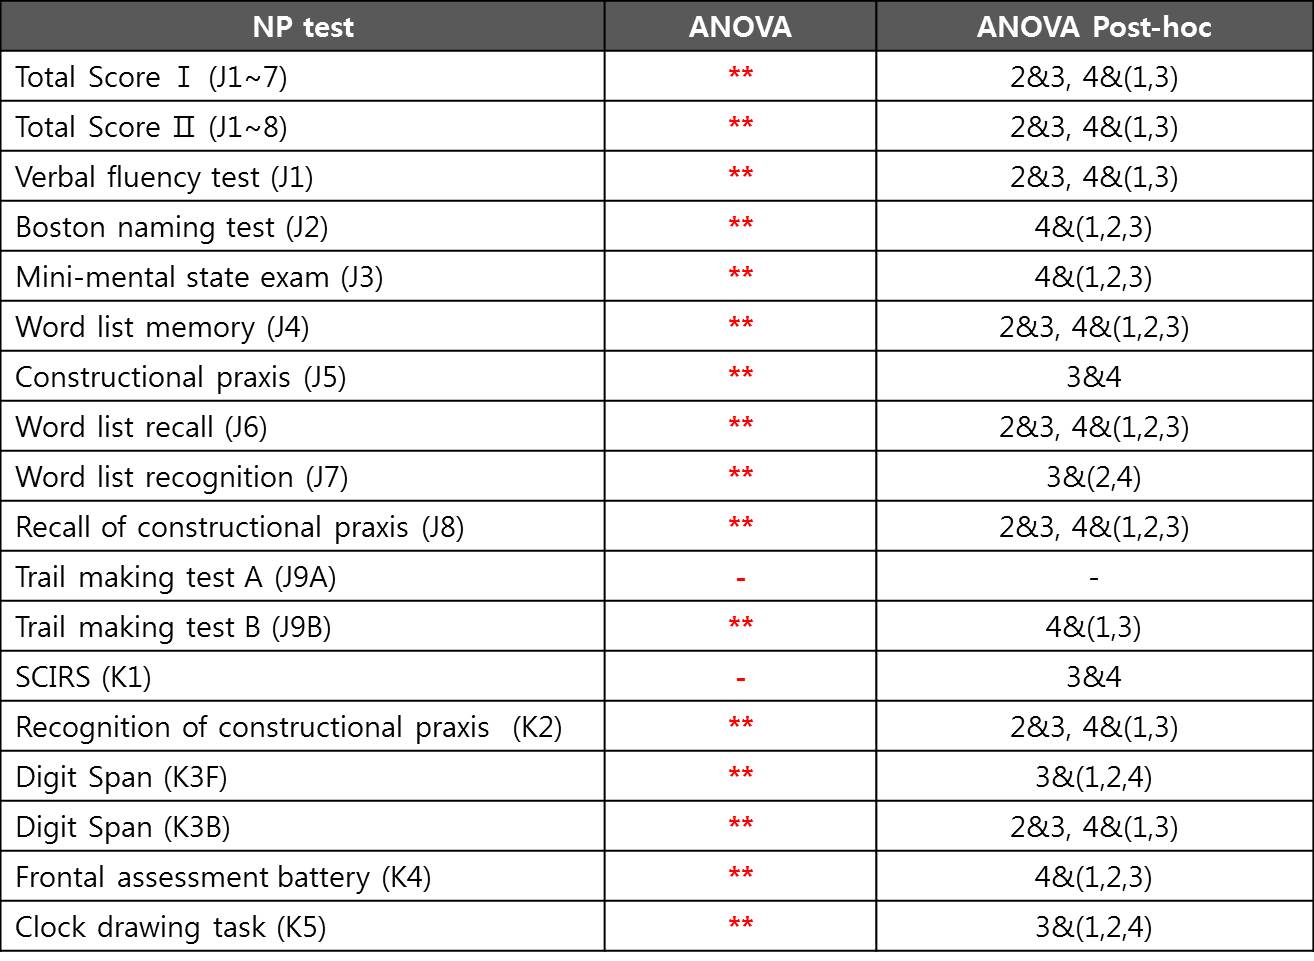
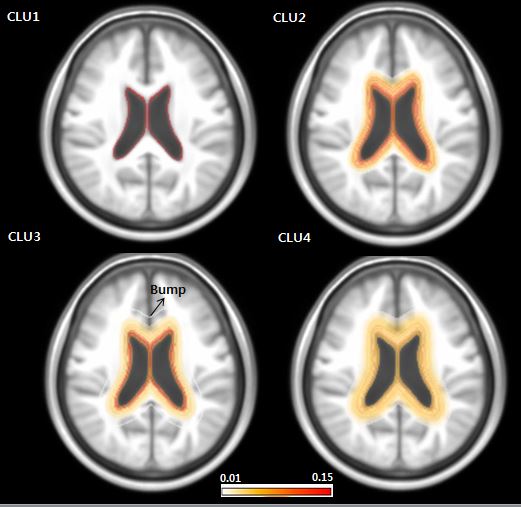
There was no significant difference of demographic features between clusters (Table1). By standardizing total volume into one, we investigated the solitary effect of WML profile pattern on neurocognitive test, independent of total volume. The pattern of each cluster shown in Figure1-2, represents the specific location in white matter: CLU1=Juxtaventricle (JV) WMH, CLU2=Periventricle (PV) WMH, CLU3=small separated PV and Deep white matter (DW) components, usually found in normal degeneration, and CLU4= continuous PV and DW WMH [8]. All NP scores generally increased from cluster 4 (CLU4) through cluster 1 (CLU1), cluster 2 (CLU2) to cluster 3 (CLU3), suggesting that the group in CLU3 are the most cognitively normal. The total volume increased from CLU2 through CLU3, CLU1 to CLU4, confirming NP scores were not affected by total volume. Z scores of NP tests, excluding SCIRS and TMT_A, showed significant differences (p<0.01) between the four clusters (Table2). Similarly, sum scores of NP tests with control variables (sex, age, and education), except SCIRS and Digit Span Forward (DSF), demonstrated significant differences (p<0.01) (Table3). The quantified pattern of WMH plays an important role in discriminating cognitive function. According to post-hoc analysis, the primary differences resulted from CLU4 and the others. There was no significant difference between CLU 1 and the others, consistent with the previous findings that WMLs in JV likely resulting from CSF leakage have little damage to the brain. [8]CONCLUSION
This study concentrated on deepening the previous understanding of the histopathologic substrates of WMLs on MR images. Fully automated segmentation and classification of WMHs has been investigated. Compared with the visual rating scales not fully consistent with cognitive functions, our findings will be objective and etiologically and functionally relevant to clinical outcomes. If confirmed in longitudinal studies, it could shed further light on fully-automated classification of WMHs.Acknowledgements
No acknowledgement found.References
[1] Mantyla R et al., Stroke 1997; [2] Kim TH et al., Alzheimers Dement 2013; [3] Lee DY et al., JINS. 2004; [4] Kim TH et al., Dementia and geriatric cognitive disorders 2010; [5] Choe JY et al., Dementia and geriatric cognitive disorders 2008; [6] Kim SK et al., J Kor Neuropsychiatr Assoc 2009; [7] Yoo BI et al., Neuroradiology 2014; [8] Kim KW et al., Biol Psychiatry 2008Figures