2343
Early detection of Alzheimer's Disease using a combined index of gray matter texture1Brain & Cognitive Sciences, Seoul National University, Seoul, Korea, Republic of, 2Asan Medical Center, Seoul, Korea, Republic of, 3Department of Neuropsychiatry, Seoul National University Bundang Hospital, Seoul, Korea, Republic of, 4College of Medicine, Seoul National University, Seoul, Korea, Republic of
Synopsis
Development of sensitive markers that can detect Alzheimer’s Disease at its pre-dementia stages is of critical importance. We hypothesized that altered cytoarchitecture caused by AD pathology would lead to a subtle altered pattern of voxel intensities on MRI which could be detected by texture analysis. In a training set of 111 AD and 141 normal controls, we extracted a set of texture features from core regions affected by pathology – precuneus, posterior cingulate cortex, hippocampus – that could efficiently discriminate between the two groups(AUC=0.875, p<0.001) as well as predict MCI/AD conversion from the normal stage (AUC=0.716, p=0.031).
PURPOSE
The development of sensitive markers that can detect Alzheimer’s Disease (AD) at its pre-dementia stages are of great interest. Ideally, a marker that is noninvasive, low-cost and detectable at pre-symptomatic phases is needed. We hypothesized that the combined effect of various AD pathology would cause an altered cytoarchitecture leading to altered signal intensities on MRI, different from that of healthy elderly, and that this subtle variation can be detected through texture analysis of the MR image. The objective of this study was to investigate the capability of gray matter texture of 3 core regions of AD pathology in discriminating AD from normal controls (NC), and in predicting progression to mild cognitive impairment (MCI) or AD from the cognitively normal stage.
METHODS
Subjects: Preprocessed 3T T1-weighted images from the Alzheimer’s Disease Neuroimaging Initiative (ADNI) database were used[1]. The original dataset from which the texture marker was constructed comprises 111 AD and 141 NC from ADNI2 database. An independent dataset that was later used for validation of the texture marker for AD discrimination comprises 3T images of 35 AD and 46 NC from the ADNI1 database. Another independent dataset used for validation of the texture marker for AD prediction comprises images of 17 subjects who are cognitively normal at baseline but convert to MCI or dementia within 24 months, and 17 controls who are matched for age, gender, education and APOE and are cognitively normal from the baseline to follow-up.MRI Analysis: Images were conformed to 1x1x1 mm3 resolution and run on FreeSurfer 5.3.0. to obtain masks of total gray matter, precuneus (Prc), posterior cingulate cortex (PCC), and hippocampus (Hip)[2]. The grey levels of each subject’s total gray matter were quantized to 64 levels.
Texture Analysis: From the quantized gray matter images, 3D gray level co-occurrence matrices (GLCM) was calculated for each ROI. From each of the GLCMs, the following textural features were calculated – Energy, Entropy, Contrast, Cluster Shade, Cluster Prominence, Sum Variance, and Informational Measure of Correlation I (IMCI)[3~5]. A total of 21 texture features were extracted.
Statistical Analysis: The original dataset was divided into 10 subgroups, and on each different combination of 9 subgroups, the 21 features were fitted stepwise into a logistic regression model discriminating AD from NC. Since the selected set of features will be different for each run, we ranked features based on how frequently they were chosen in the 10 runs, and included the most frequently selected features in a final combined marker. This procedure was repeated with addition of gray matter volumes of Prc, PCC, and Hip as features. The performance of the resulting combined marker was evaluated using receiver operator characteristic (ROC) curves in the two validation datasets. Additionally, partial correlation was conducted to see relations between the combined marker and cognitive measures such as the Mini Mental State Exam (MMSE) and Clinical Dementia Rating Sum of Boxes (CDR-SB).
RESULTS
There was more dissociation between the frequently chosen features and less frequently chosen features when texture alongside volume was entered into logistic regression, compared to when only texture was entered (Figure 1). Among the features (texture and volume), the most frequently selected ones were Prc Contrast, Hip Cluster Shade, PCC volume, Hip volume, and PCC IFMCI . These features were combined into a single marker, and on the AD discrimination validation set, it achieved an AUC of 0.875 (p<0.001) and on the MCI/AD prediction validation set, it achieved an AUC of 0.716 (p<0.031)(Figure 2). The combined marker showed moderate correlation with cognitive scores. For MMSE, r = 0.527 (p<0.001), and for CDR-SB, r = -0.608 (p<0.001).DISCUSSION
The most frequently selected texture features from the logistic regression models were different in each ROI, which may be reflective of different types of pathology in each region. For example, in AD, precuneus Contrast was higher, which means there was more heterogeneity in the image and may be related to the high accumulation of B-amyloid in that area[6]. AD also showed higher hippocampus Cluster Shade, which signifies greater asymmetry in the image and may be reflective of reduced dendritic density and total length in the CA and dentate gyrus of hippocampus[7]. The GLCMs of AD indicate slightly higher image heterogeneity compared to normal controls (Figure 3). We plan to later compare performance of the combined marker with that of volume alone and of fluorodeoxyglucose positron emission tomography scans, as well as expand our analysis to MCI patients.CONCLUSION
The results suggest MRI texture as a potentially useful marker for early detection of AD.Acknowledgements
No acknowledgement found.References
[1] Jack et al., J Magn Reson Imaging 2008
[2] Desikan et al., Neuroimage 2006
[3] Haralick et al., IEEE Trans Syst Man Cybern 1973
[4] Soh et al., IEEE Trans Geosci Remote Sens 1999
[5] Clausi et al., Can J Remote Sensing 2002
[6] Vlassenko et al., Alzheimers Dement 2011
[7] Penzes et al., Nat Neurosci 2012
Figures
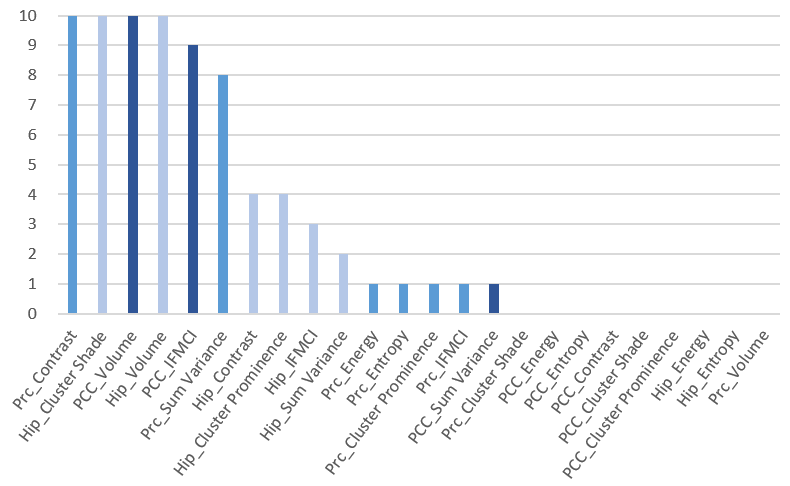
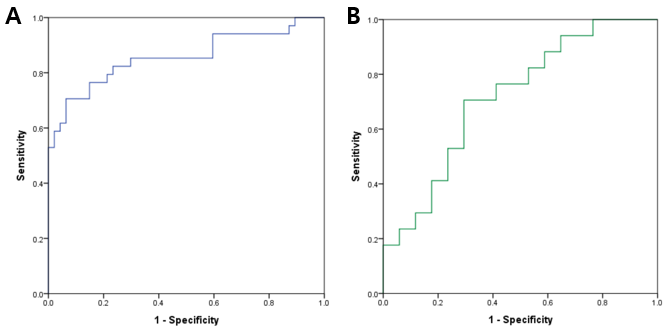
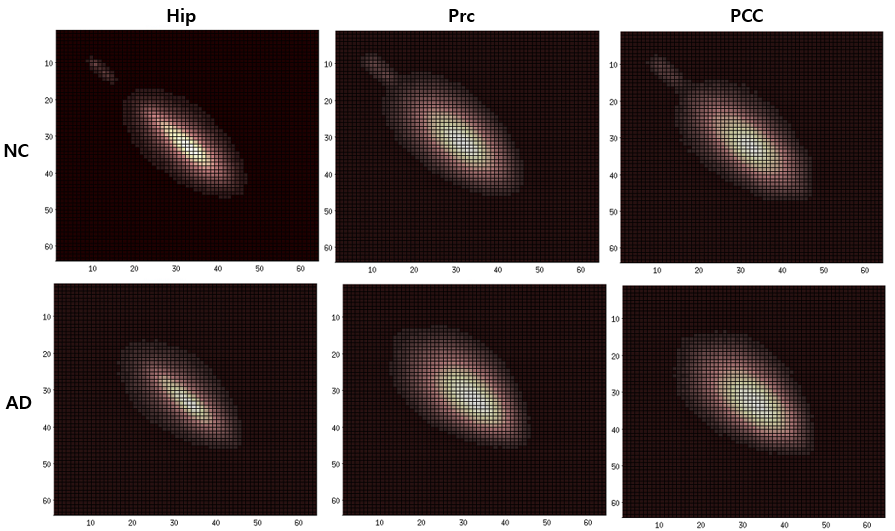
Figure 3. GLCMs of the hippocampus, precuneus, and posterior cingulate cortex of the cognitively normal group (top row) and the AD patient group (bottom row). Brighter areas show higher number of cell entries (frequency of co-occurence of voxels with intensity values corresponding to the cell coordinates). GLCMs of both groups were roughly concentrated along the diagonal (cell entries along the diagonal indicate co-occurence of similar voxel intensities and thus homogeneity), but those of AD were more widespread and broad, indicating relatively more heterogeneity in the image compared to NC.