2340
Individual Evaluation System Development Concept Research for Personalized Brain Aging Process Using Machine Learning1Radiology, Kyung Hee University Hospital, Seoul, Korea, Republic of
Synopsis
White matter hyperintensities (WMH) is one of the important characteristics of cerebral small vessel disease (cSVD). To diagnosis individual WMH evaluation method and investigate the degree of WMH form using MR image, we proposed that machine learning based on WMH group classification and individual diagnosis system.
Purpose
The cerebral small vessel disease (cSVD) refers to a group of pathological processes with various etiologies that affect the small arteries, arterioles, venules, and capillaries of the brain. cSVD is common and has a crucial role in at least three fields including stroke, dementia and aging 1. Neuroradiological features on MRI include lacunar infarcts, white matter hyperintensities (WMH, leukoaraiosis), microbleeds, enlarged perivascular spaces and cerebal atrophy2. Several clinical factors are associated with increased risk of cSVD including hypertension, diabetes, hypercholesterolemia, obesity, smoking, alcohol intake, but a large proportion of the variance in presence and severity of cSVD is unexplained 3. Among them WMH are highly correlated with the brain aging process. In this article, we examined the relations between total brain burden of WMH at age over 65s using machine learning methods and proposed that machine learning based WMH group classification and individual diagnostic systems.
Materials and Methods
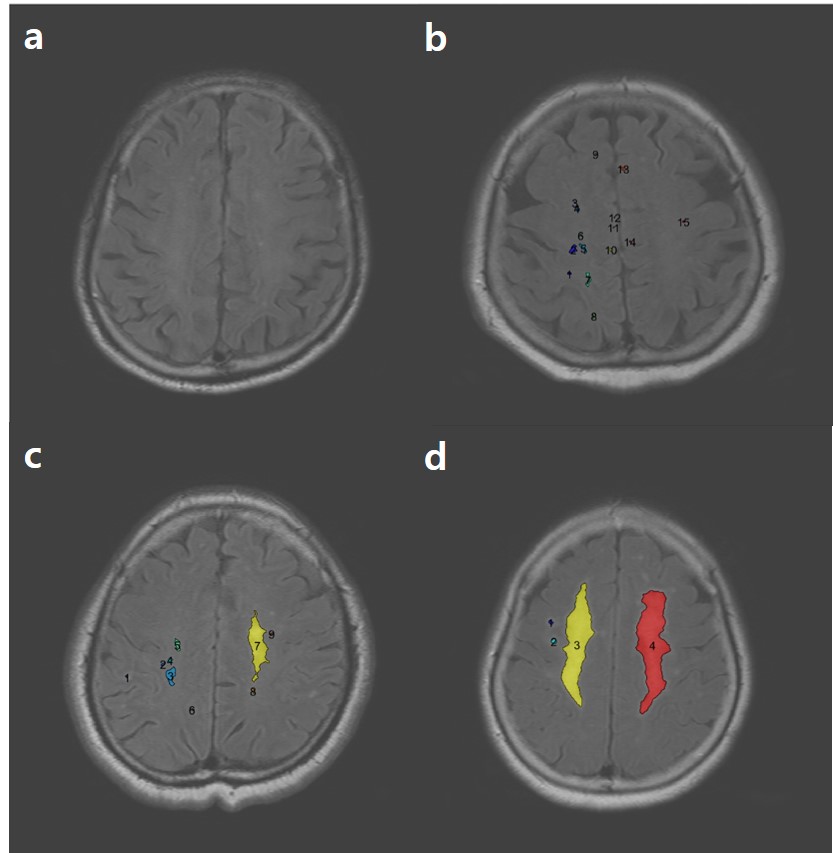
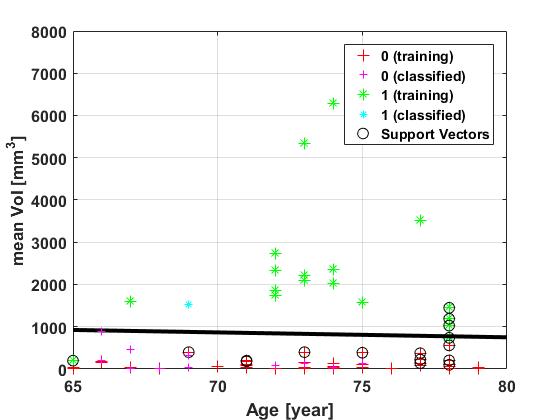
88 elderly healthy subjects (mean age = 70.66, 60 females and 28 males) were participated after informed consent. All subjects were scanned on the 3T MR (Achieva, Philips Healthcare, Best, Netherlands) with 2D-axial FLAIR sequences. The WMH score is a 4-point scale (none, mild, moderate and severe). Furthermore, all subjects’ WMH scores using logistic regression with a dichotomized score: non-advanced group (none or mild WMH) and advanced group (moderate and severe WMH). Support vector machine (SVM) 4, a learning algorithm for classification between non-advanced and advanced groups, has been designed using a set of training data. The three features were extracted from WMH in each brain using Otsu’s and watershed automatic segmentation techniques - the number of clustering [EA], total volume [mm3] for WMH, and mean volume of WMH (=total volume/the number of WMH). The receiver operating characteristic (ROC) curve analysis was performed to evaluate sensitivity and specificity of training data set for WMH form classification. From the all subjects, a set of training was contained 76 subjects and a set of test was contained 12 subjects. All processing was performed in Matlab software (MathWorks, Natick, MA, USA).Results
Two WMH groups were classified from result the review of two neuroradiologists (kappa= 0.8)- non-advanced group (49 subjects) and advanced group (27 subjects). Figure 1 shows the result of segmentation using FLAIR images for two WMH groups. Although the number of clustering for WMH was not significant result, other volume based on WMH features was significant results. Specially, the mean volume of WMH feature showed the highest accuracy result among three WMH classification features compared to review of neuroradiologists. The accuracy of the set of training data with SVM model was 96.06 % (73/76) and area under curve (AUC) was 1.00 using ROC curve analysis. The result of classification with the set of test data showed that the accuracy was 91.67% (11/12). Figure 2 showed the results of the classification with a set of training and a set of test using SVM algorithm.Discussions
Machine learning technique has advanced rapidly in recent years by growing of big data process. Especially, the medical imaging field is essential role because machine learning provides the various and useful information. One of the main advantage is that individual diagnosis is possible for specific disease. Present WMH diagnosis was evaluated by a neuroradiologist’s experience. For more objective and quantitative estimation, in this study, we proposed the novel classification method using machine learning algorithm for WMH evaluation. The segmentation technique was processed automatically from FLAIR image for each subject (Fig.1). Most WMH regions were detected well but several subjects that has some artifacts were not detected well. It needs to more elaborate segment algorithm to improve segment accuracy. In this study, the mean volume value was used finally as main feature. Because many features cause higher dimensions by “curse of dimensionality”5, many subjects should be needed. In this study, therefore, we analyzed minimized main feature using mean volume to obtain higher accuracy with less subjects. Our proposed personalized WMH evaluation technique can be used as a diagnosis for cSVD with quantitative individual data. Therefore, the personalized brain WMH detection system offers more efficiency information of WMH form for early diagnosis for cSVD. It is more helpful to make diagnosis adding various clinical data.Conclusion
The machine learning based on personalized WMH evaluation system proved to be more effective to evaluate the degree of WMH process. Therefore, the machine learning based on WMH evaluation method using FLAIR MRI can be used to an early diagnosis for cSVD. Furthermore, the personalized brain WMH detection system can be used as an imaging biomarkers to evaluate cSVD.Acknowledgements
This study was supported by the National Research Foundation of Korea (NRF) grant funded by the Korea government (MSIP) (NRF-2016R1E1A2913940).References
1. Thompson CS et al. Stroke 2009;40:e322-30. 2. Staals J et al. Neurobiol Aging 2015;36:2806-11. 3. Wardlaw JM et al. Neurology 2014;82:1331-38. 4. Campbell et al. 2011, Morgan and Claypool. ISBN 978-1-60845-616-1. 5. Nie, Feiping, et al. Proceedings of the 31st International Conference on Machine Learning (ICML-14). 2014.Figures