2339
Factors influencing the detection of age-dependent variations of cortical myelin by MP2RAGE at 9.4T.1Biomedical Magnetic Resonance, University Hospital Tübingen, Tübingen, Germany, 2High Field Magnetic Resonance, Max-Planck Institute for Biological Cybernetics, Tübingen, Germany, 33General Psychiatry&Psychotherapy, University Hospital Tübingen, Tübingen, Germany, 4University Ulm, Germany
Synopsis
Detection of subtle variation of the myeloarchitecture within the cerebral cortex may be feasibile with high-field mapping of the longitudinal relaxation time. However, besides myelin other factors like iron or variation of the grey matter volume may impact this MR parameter. In the present work we propose a model that includes and quantifies these factors. We found a regionally dependent, continuous increase from early adulthood into the middle ages that tentatively can be assigned to myelin.
Introduction
Alteration of white matter tracts serves as a hallmark of the aging brain, while less is known regarding loss of myelinated fibers in the cerebral cortex1,2. The mapping of the longitudinal relaxation at high field opens up the possibility to detect cortical myelin3, but may be confounded by reported decreases in grey matter (GM) volume4,5 and increase in iron6,7. In the present study we explored the variation of R1 with age and attempt to pin-point different factors influencing its age-related variation from early adulthood into the middle ages.Theory
The first model proposed for the age-dependent variation of R1 is based on the effect of iron only6:
$$$
R1(age)= R1'+r1Fe [Fe].
$$$ [Eq 1]
In a later study, the effect of myelin was introduced8:
$$$
R1(age)= R1'+r1M ·fM(age) + r1Fe ·[Fe](age)
$$$ [Eq. 2]
where fM is the myelin fraction, [Fe] is the iron concentration, r1M and r1Fe are the relaxivities of myelin and iron, respectively.
With increasing age, the number of neurons and their density remain unaltered4, but the GM volume fraction, GMF, decreases5, that in turn may influence the MRI signal. We suggest that this process can be described by:
$$$
R1(age)= R10+k·GMF(age)+r1M· fM(age) + r1Fe·[Fe](age)
$$$ [Eq. 3]
Depending on the type of changes in the local cellular architecture that follows the GMF decrease, k will be positive or negative.
Materials and Methods
Healthy subjects (19-56y N=27, 6 females), volunteered to participate in the ERB approved study and were scanned as described previously9 at 9.4T (Siemens Germany), with a 16ch transmit/31ch receive array. The transmit field was mapped with the Actual Flip Angle method and R1 with the MP2RAGE sequence (TI1/TI2=900/3500ms; FA=4/6°; read-out TR =6ms; inversion TR=8894ms, 0.8mm isotropic voxel size). R1 calculations were performed after correction for transmit field dependent variation of read-out and inversion efficiency. Synthetic, ‘flattened’ MP2RAGE contrast images were used for tissue segmentation in native space based on SPM12, and DARTEL based adaptation of the AAL brain atlas. The whole brain grey matter (GM) fraction (GMF) was evaluated in terms of number of segmented voxels divided by the number of voxels comprising the total intracranial volume. The expected iron concentration ([Fe] expressed in mg/g wet weight tissue) was estimated from the literature6.Results and Discussion
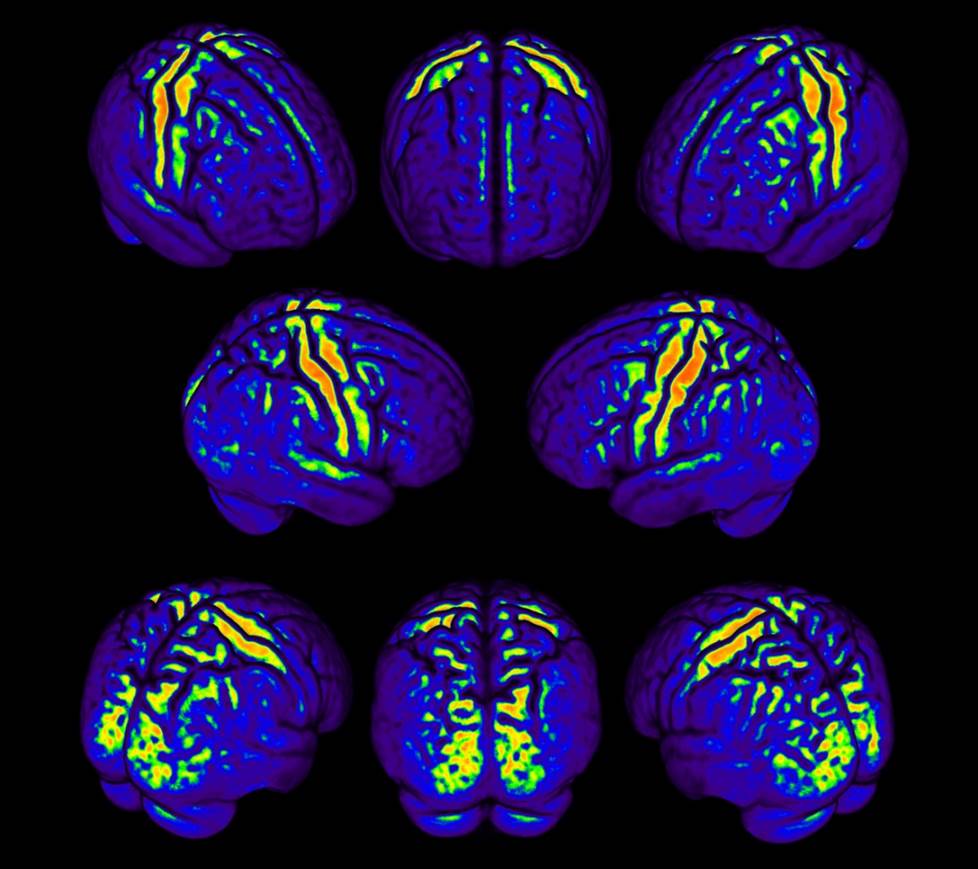
The R1 values stood out in uni-modal brain areas where high myelin-concentrations are expected (Fig.1).
Using [Eq. 1] to model age-related effects yielded a wide spread in iron relaxivity across regions (0.5-7.0 s-1/[Fe]). If it is assumed that r1Fe is constant in brain tissue, other factors than iron must contribute to the age-dependent variation.
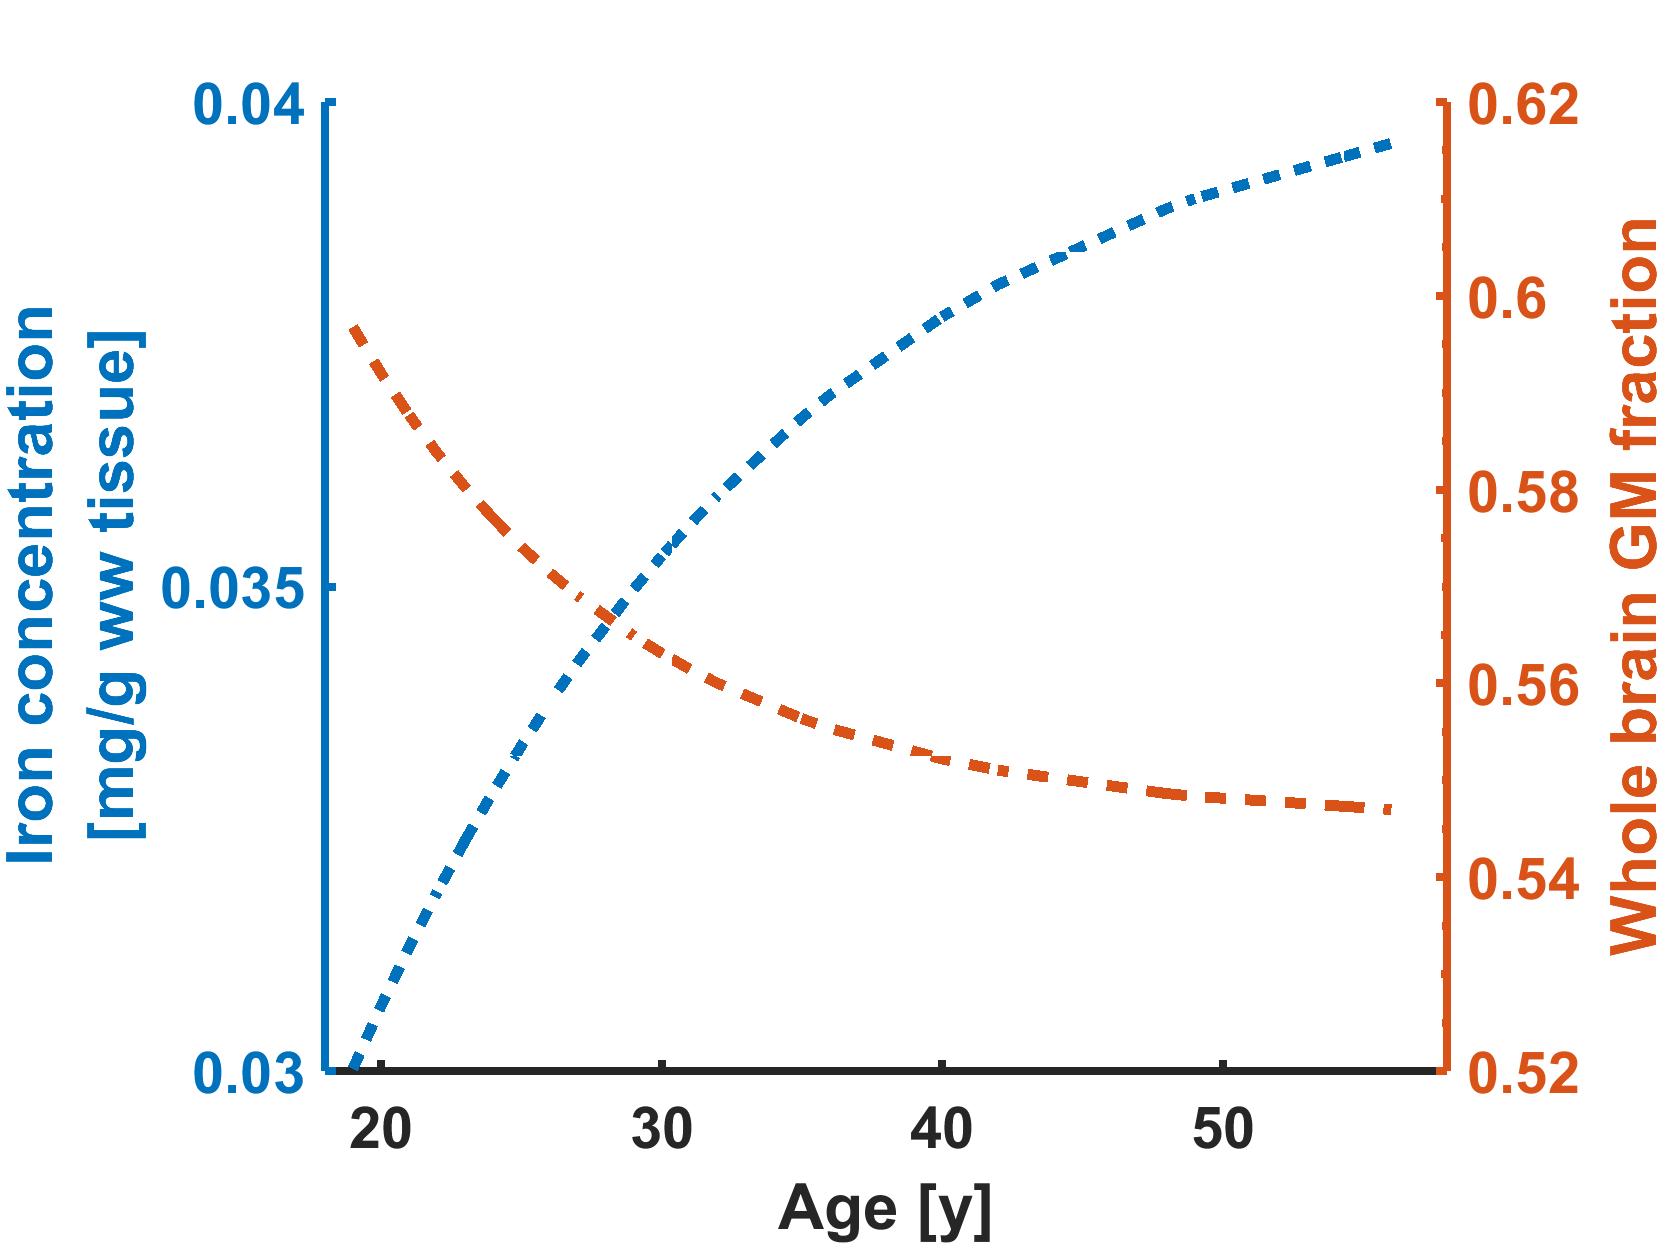
The age-related decrease in GMF (2.2% per decade) was similar to previous studies4, like the improvement obtained by modeling it with an exponential function5 (Fig.2). The GMF in the pallidum remained practically stable and this region was therefore used to estimate the effect of [Fe].
For this structure we found a r1Fe of 0.914 s-1/[Fe], which was similar to the value found in the caudate nucleus, but different from the value in putamen (0.571s-1/[Fe]).
Next, this relaxivity value, together with the expected cortical [Fe] were used to correct whole brain estimates for R1. The iron-corrected values decreased significantly, but linearly with GMF (p<0.01). The linear coefficient found was used to correct the data further.
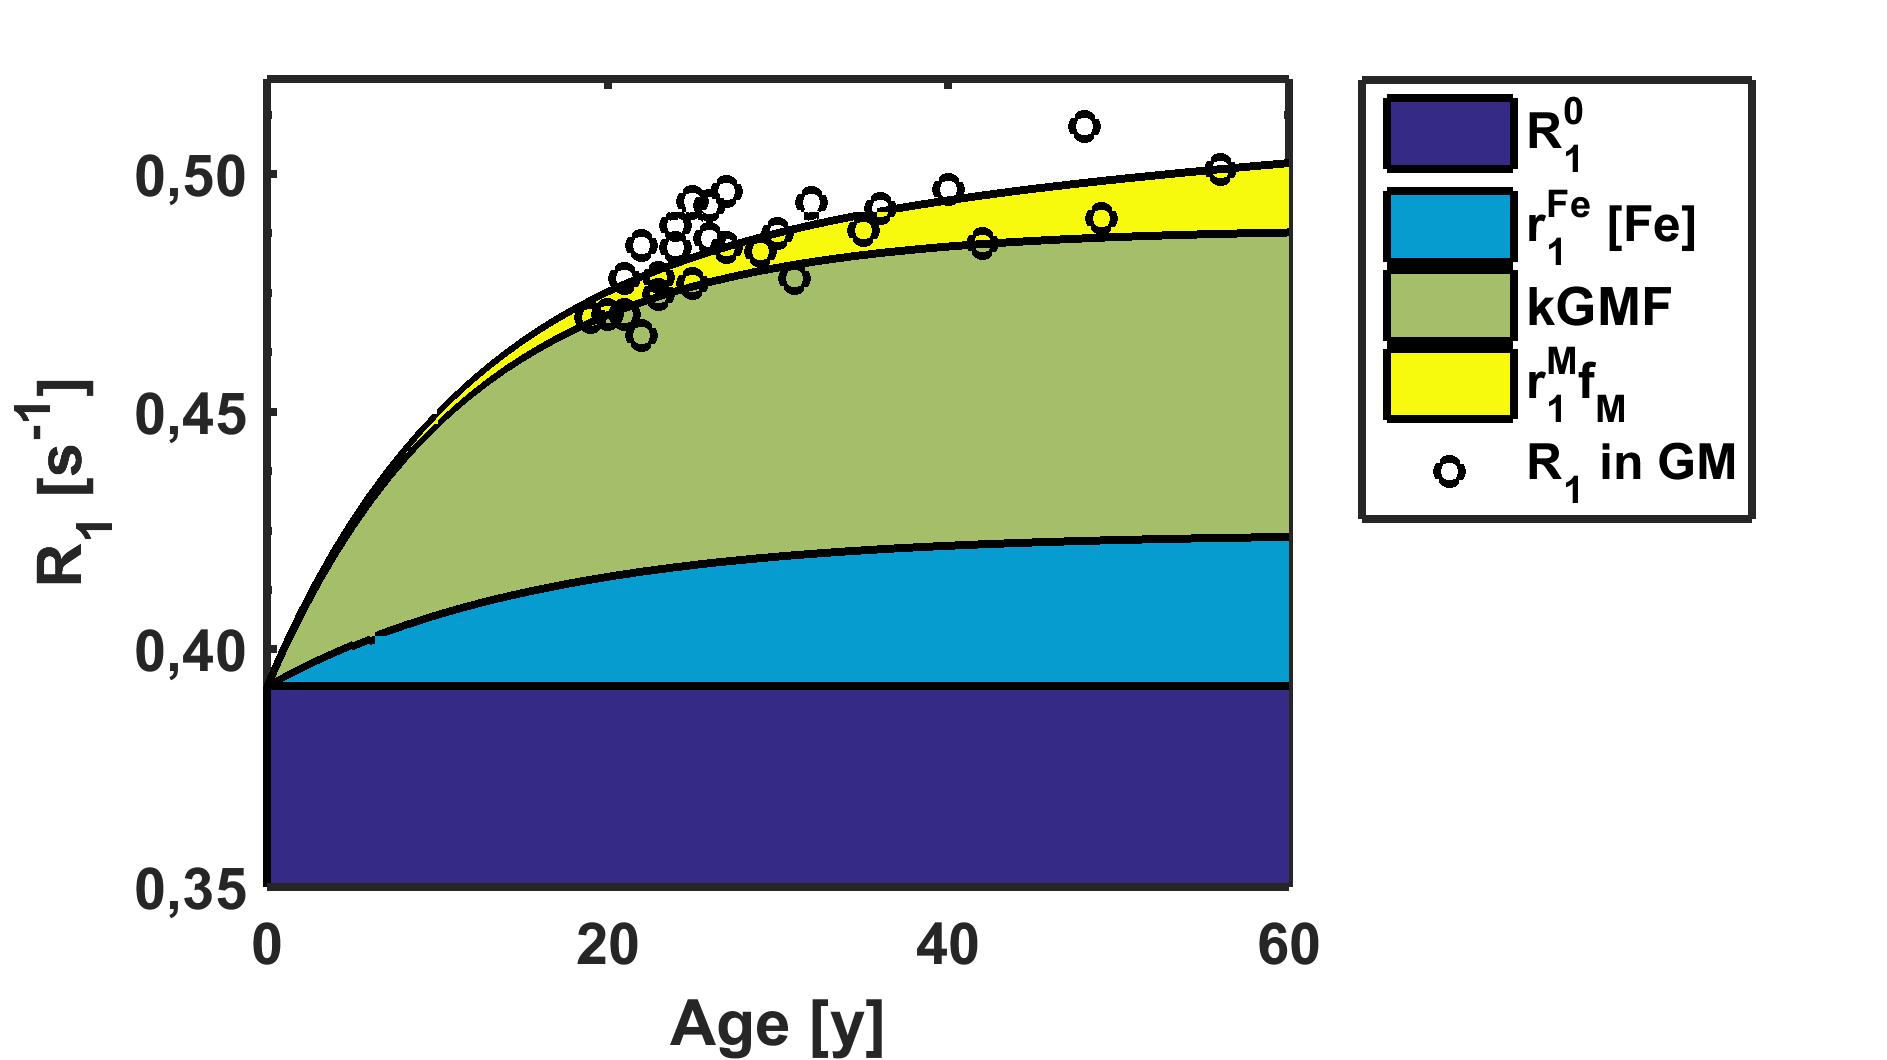
Despite correction for both iron and GM-related variations, the remainder of the whole brain R1 estimates still showed a tendency towards a linear increase in R1 of 0.024s-1 per decade, and yielded a final estimate of R10 of 0.3922s-1 (Fig. 3).
This linear increase in quantitative R1 estimates within the cortex may be attributed to myelin, and is similar to results obtained by T1w/T2w imaging11.
In all 45 regions of interest, fitting of whole brain R1 values improved with the full model that included variation due to both iron and GMF. In 16 regions, a significant (p<0.05) linear change in R1 was found that exceeding the whole brain value and reached more than 0.05s-1 per decade in the supramarginal and precentral gyri.The only region showing a linear decrease with age (k<0) was the putamen..
Conclusions
Age-related changes in R1 can readily be detected at 9.4T. Besides increasing levels of iron and alterations of GMF, our results suggest that also myelin-related effects are increasing from early adulthood to the middle ages in a regionally dependent fashion.Acknowledgements
We gratefully acknowledge funding by the Max Planck Society, and the ministry of Science, Research and the Arts of Baden-Württemberg (Az: 32-771-8-1504.12/1/1, to GH) and the intramural research funding program of the Faculty of Medicine of the University of Tübingen (fortüne 2091-1-0). TD was partly supported by the LEAD Graduate School (GSC1028), a project of the Excellence Initiative.References
[1] Salat DH. Brain Connect. 2011;1(4):279-93. [2] Peters A. The effects of normal aging on myelinated nerve fibers in monkey central nervous [1] [3] Stüber C et al.,NeuroImage(2014);93(1):95-106. [4] Freeman SH et al., J Neuropathol Exp Neurol. 2008;67(12):1205-12. [5] Douaud G, et al. PNAS 2014;111(49):17648-53. [6]Hallgren B and Sourander P. J Neurochem. 1958;3(1):41-51. [7] Ogg RJ and Steen RG, Magn Reson Med 1998; 40:749-753 [8] Rooney WD et al., Magn Reson Med. 2007;57(2):308-18. [9] Hagberg GE, et al., Neuroimage, 2016; in press [10] Callaghan M et al., Neurobiol Aging. 2014;35(8):1862-72. [11] Shafee R et a., Neuroimage. 2015;105:473-85.Figures