2338
Age-related change of the whole brain T1 relaxation time: voxel-wise study with MP2RAGE1Department of Diagnostic Imaging and Nuclear Medicine, Kyoto University Graduate School of Medicine, Kyoto, Japan
Synopsis
Correlation was investigated between normal aging and T1 relaxation time in the deep gray matter with MP2RAGE sequence using voxel-based analysis (VBA) and regions-of-interest (ROIs) focusing on the deep gray matter (GM). Seventy healthy subjects were included. In VBA, linear correlation was explored, whereas second order regression was added in ROI analysis. The results showed relationship that varied among deep GM structures. Those findings will shed light on further investigation of T1 relaxation time in patient groups.
PURPOSE
The deep gray matter (GM) of human brain plays important roles in motor control, cognitive function, emotion, among others. Functional disruption of the deep GM results in neurological pathology such as Parkinson's disease and Alzheimer disease (1). Although iron deposition is a key factor of those pathogenesis, iron also accumulates to the deep GM with aging. T1 relaxation time (T1) mainly reflects not only myelin content but also iron concentration in the brain tissue (2). Therefore, this study investigated the relationship between age and T1 relaxation time (T1) in the deep GM.METHODS
Seventy healthy volunteers without any previous history of severe head trauma or neuropsychiatric disorders were enrolled (age 20-76, mean 42.9). A 3T MR scanner (MAGNETOM Skyra; Siemens Healthcare GmbH, Erlangen, Germany) with 32-channel phased array head coil were used. MP2RAGE was acquired in sagittal orientation with 1 mm isotropic resolution (3, 4). Data processing and analysis were conducted with SPM12 (Wellcome Trust Centre for Neuroimaging, London, UK) running on Matlab R2015b (Mathworks, Sherborn, MA, USA). MP2RAGE T1-weighted images were segmented into GM and white matter (WM), and probability maps of GM and WM segments were obtained. Spatial normalization was performed on GM and WM probability maps using the “diffeomorphic anatomical registration using exponentiated Lie algebra (DARTEL)” algorithm. Using the flow fields obtained in the DARTEL process, T1 maps derived from MP2RAGE sequence were smoothed with an isotropic Gaussian kernel of 3mm full width at half maximum and warped to MNI space.
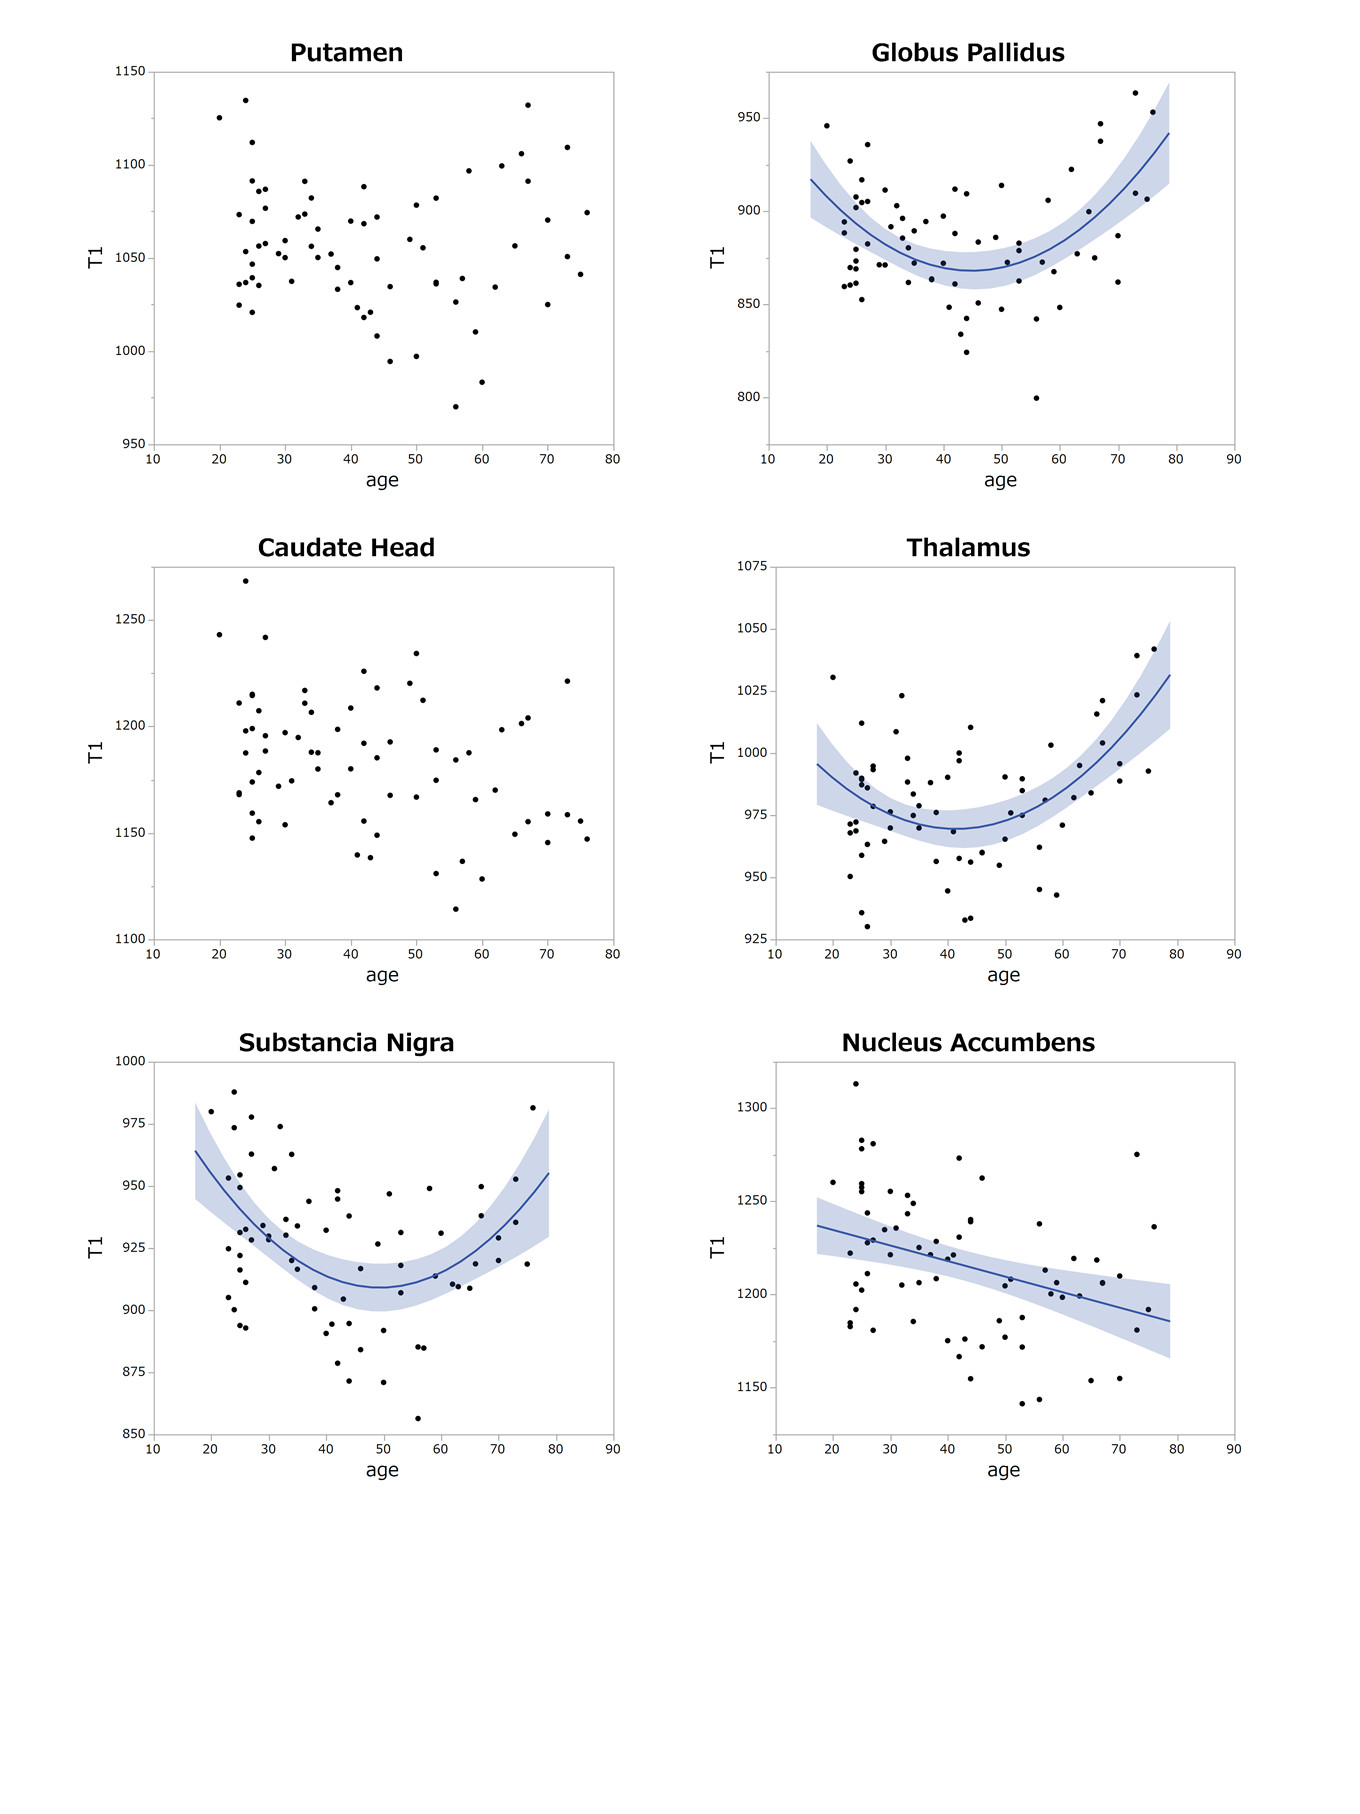
Voxel-based Analysis (VBA) was conducted using age as a covariate of interest. The resulting map was threshold at whole brain P < 0.005 and P < 0.05 false discovery rate (FDR) cluster corrected for multiple comparisons. In regions-of-interest (ROIs) analysis of the deep GM structures, the following substructures were selected: putamen, globus pallidus, thalamus, caudate head, substantia nigra and nucleus accumbens. Mean T1 values of each ROIs were measured. Both of linear and quadratic polynomial regression analyses were performed at mean T1 of each deep GM with age. A P value < 0.0042 was considered statistically significant after Bonferroni’s correction for multiple comparisons.
RESULTS
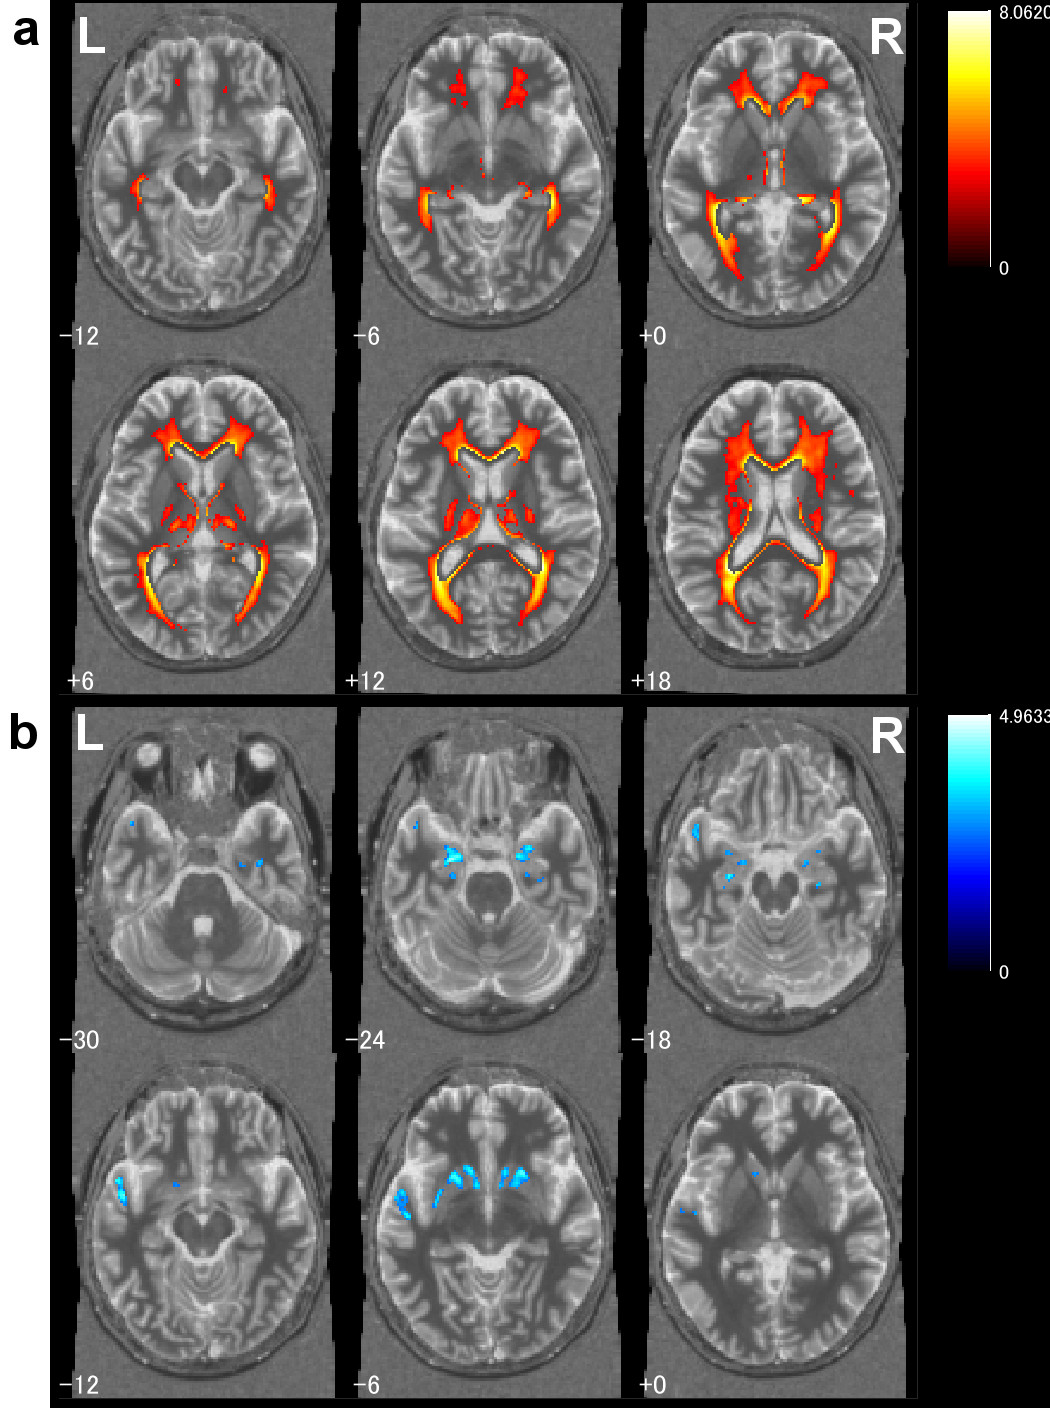
VBA showed that positive correlations between age and T1 were seen in the thalamus, and negative correlations were seen in the bilateral accumbens nucleus, ventral putamen and amygdala. ROI analysis showed that T1 in the thalamus, globus pallidus and substantia nigra significantly fitted to quadratic curve. In these stuctures, T1decreased in the early part of the lifespan and increased afterward. T1 of the nucleus accumbens was fitted to linear regression which showed monotonous decrease thorough the lifespan.
DISCUSSION
We presented the aging change of T1 with VBA and ROI analysis. VBA revealed T1 decrease in the nucleus accumbens, ventral putamen and amygdala and increase in the thalamus. T1 relaxation time is mainly determined by myelin and iron concentration. It is suggested that T1 elongation is caused by decrease of myelination and T1 shortening is caused by iron deposition. Quantification of T1 has potential utility for diagnosis of neurological disease. Understanding normal aging change of T1 is important for further investigation in patient population.
Acknowledgements
This study was financially supported by Grant-in-Aid for Scientific Research C (No. 25461819) provided by Japan Society for the Promotion of Science.References
1. Obeso JA, Rodriguez-Oroz MC, Stamelou M, Bhatia KP, Burn DJ. The expanding universe of disorders of the basal ganglia. Lancet 2014;384:523-531.
2. Stuber C, Morawski M, Schafer A, et al. Myelin and iron concentration in the human brain: a quantitative study of MRI contrast. Neuroimage 2014;93 Pt 1:95-106.
3. Marques JP, Kober T, Krueger G, van der Zwaag W, Van de Moortele PF, Gruetter R. MP2RAGE, a self bias-field corrected sequence for improved segmentation and T1-mapping at high field. Neuroimage 2010;49:1271-1281.
4. Okubo G, Okada T, Yamamoto A, et al. MP2RAGE for deep gray matter measurement of the brain: A comparative study with MPRAGE. J Magn Reson Imaging 2016;43:55-62.
Figures