2337
Cortical thickness in relation to m.3243A>G mutation load in MELAS syndrome1Department of Cognitive Neuroscience, Maastricht University, Maastricht, Netherlands, 2Department of Radiology, Maastricht University Medical Centre, Maastricht, Netherlands, 3Department of Genetics and Cell Biology, Maastricht University, Maastricht, Netherlands, 4Department of Neurology, Erasmus MC, Rotterdam, Netherlands
Synopsis
The m.3242A>G mitochondrial mutation is known to cause the MELAS syndrome. A group of MELAS patients was scanned using multi-parameter quantitative 7T MRI to assess brain changes related to mutation load and disease duration. Here, we focused on cortical thickness differences between control subjects and MELAS patients and within patients as a function of mutation load. MELAS patients were characterized by a reduced cortical thickness compared to control subjects in several regions. Within these regions, cortical thickness decreases with increasing mutation load for the fusiform and planum temporal gyri, which are involved in visual working memory and auditory processing, respectively.
Purpose
The m.3242A>G mitochondrial mutation is known to cause the mitochondrial encephalopathy lactate acidosis and stroke-like episodes (MELAS) syndrome1. However, the number of mitochondria within a single cell that harbors this mutation (e.g. mutation load) differs between patients, but also between tissue types within a single patient. Mutation load in muscle or urine is reported to correspond best with the severity of the phenotype. In general, carriers of the mutation show a wide range of symptoms, where hearing impairment and exercise and glucose intolerance are most frequently observed. A subset of MELAS patients also shows neurological involvement and cognitive impairment2. In the current study, a group of MELAS patients was scanned using multi-parameter quantitative 7T MRI to characterize possible brain changes underlying these neurological and cognitive changes and to test whether these are related to mutation load in urine epithelial cells (UECs). Here, we show the first results by focusing on cortical thickness differences between control subjects and MELAS patients and within patients as a function of mutation load.Methods
Subjects and MRI: Eighteen MELAS and twelve age- and gender-matched control subjects were included in this study. MP2RAGE and B1+ maps were acquired using a whole-body 7T scanner (Siemens Medical Systems, Erlangen, Germany) using a 32-channel phased-array coil (Nova Medical, Wilmington, USA). MP2RAGE datasets were acquired with a 0.7 mm isotropic resolution using the following parameters: TR/TE/TI1/TI2 = 5000/2.47/900/2750 ms, α1/α2 = 5°/3°, GRAPPA 3 for MP2RAGE and TR/TE = 2400/0.78 ms, TD1/TD2 = 580/1800 ms, α1/α2 = 4°/11° and GRAPPA 2 for SA2RAGE. Dielectric pads were placed proximal to the temporal lobes to locally increase the transmit B1+ field and to improve its homogeneity across the brain3. For each subject, the mutation load was determined in UECs following the procedures as described in Sallevelt et al. (2013)4. Analysis: First, MP2RAGE and B1+ maps were processed as described in Haast et al. (2016)5. FreeSurfer analysis was performed using the B1+ corrected MP2RAGE volume as input, followed by coregistration to ‘fsaverage’ using mri_surf2surf to compare the cortical thickness surface maps. Between-groups effects on cortical thickness were assessed for each region (based on the FreeSurfer Destrieux atlas) using multivariate ANOVA by controlling for age, gender and educational level. The effect of mutation load on cortical thickness within the MELAS group was then assessed using Pearson correlation analysis for each region where a significant group effect was observed.Results
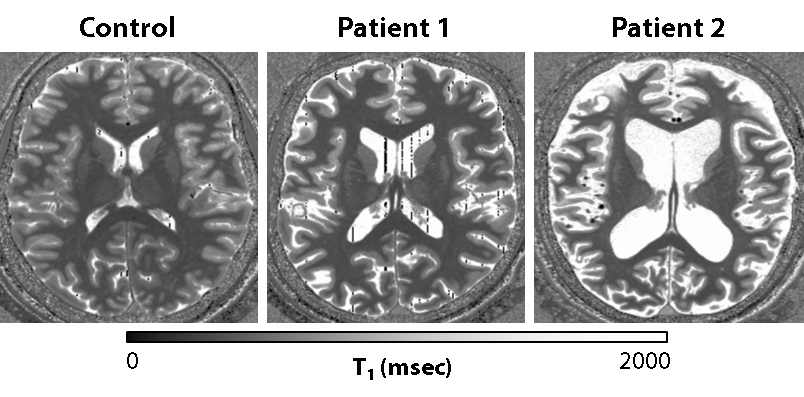
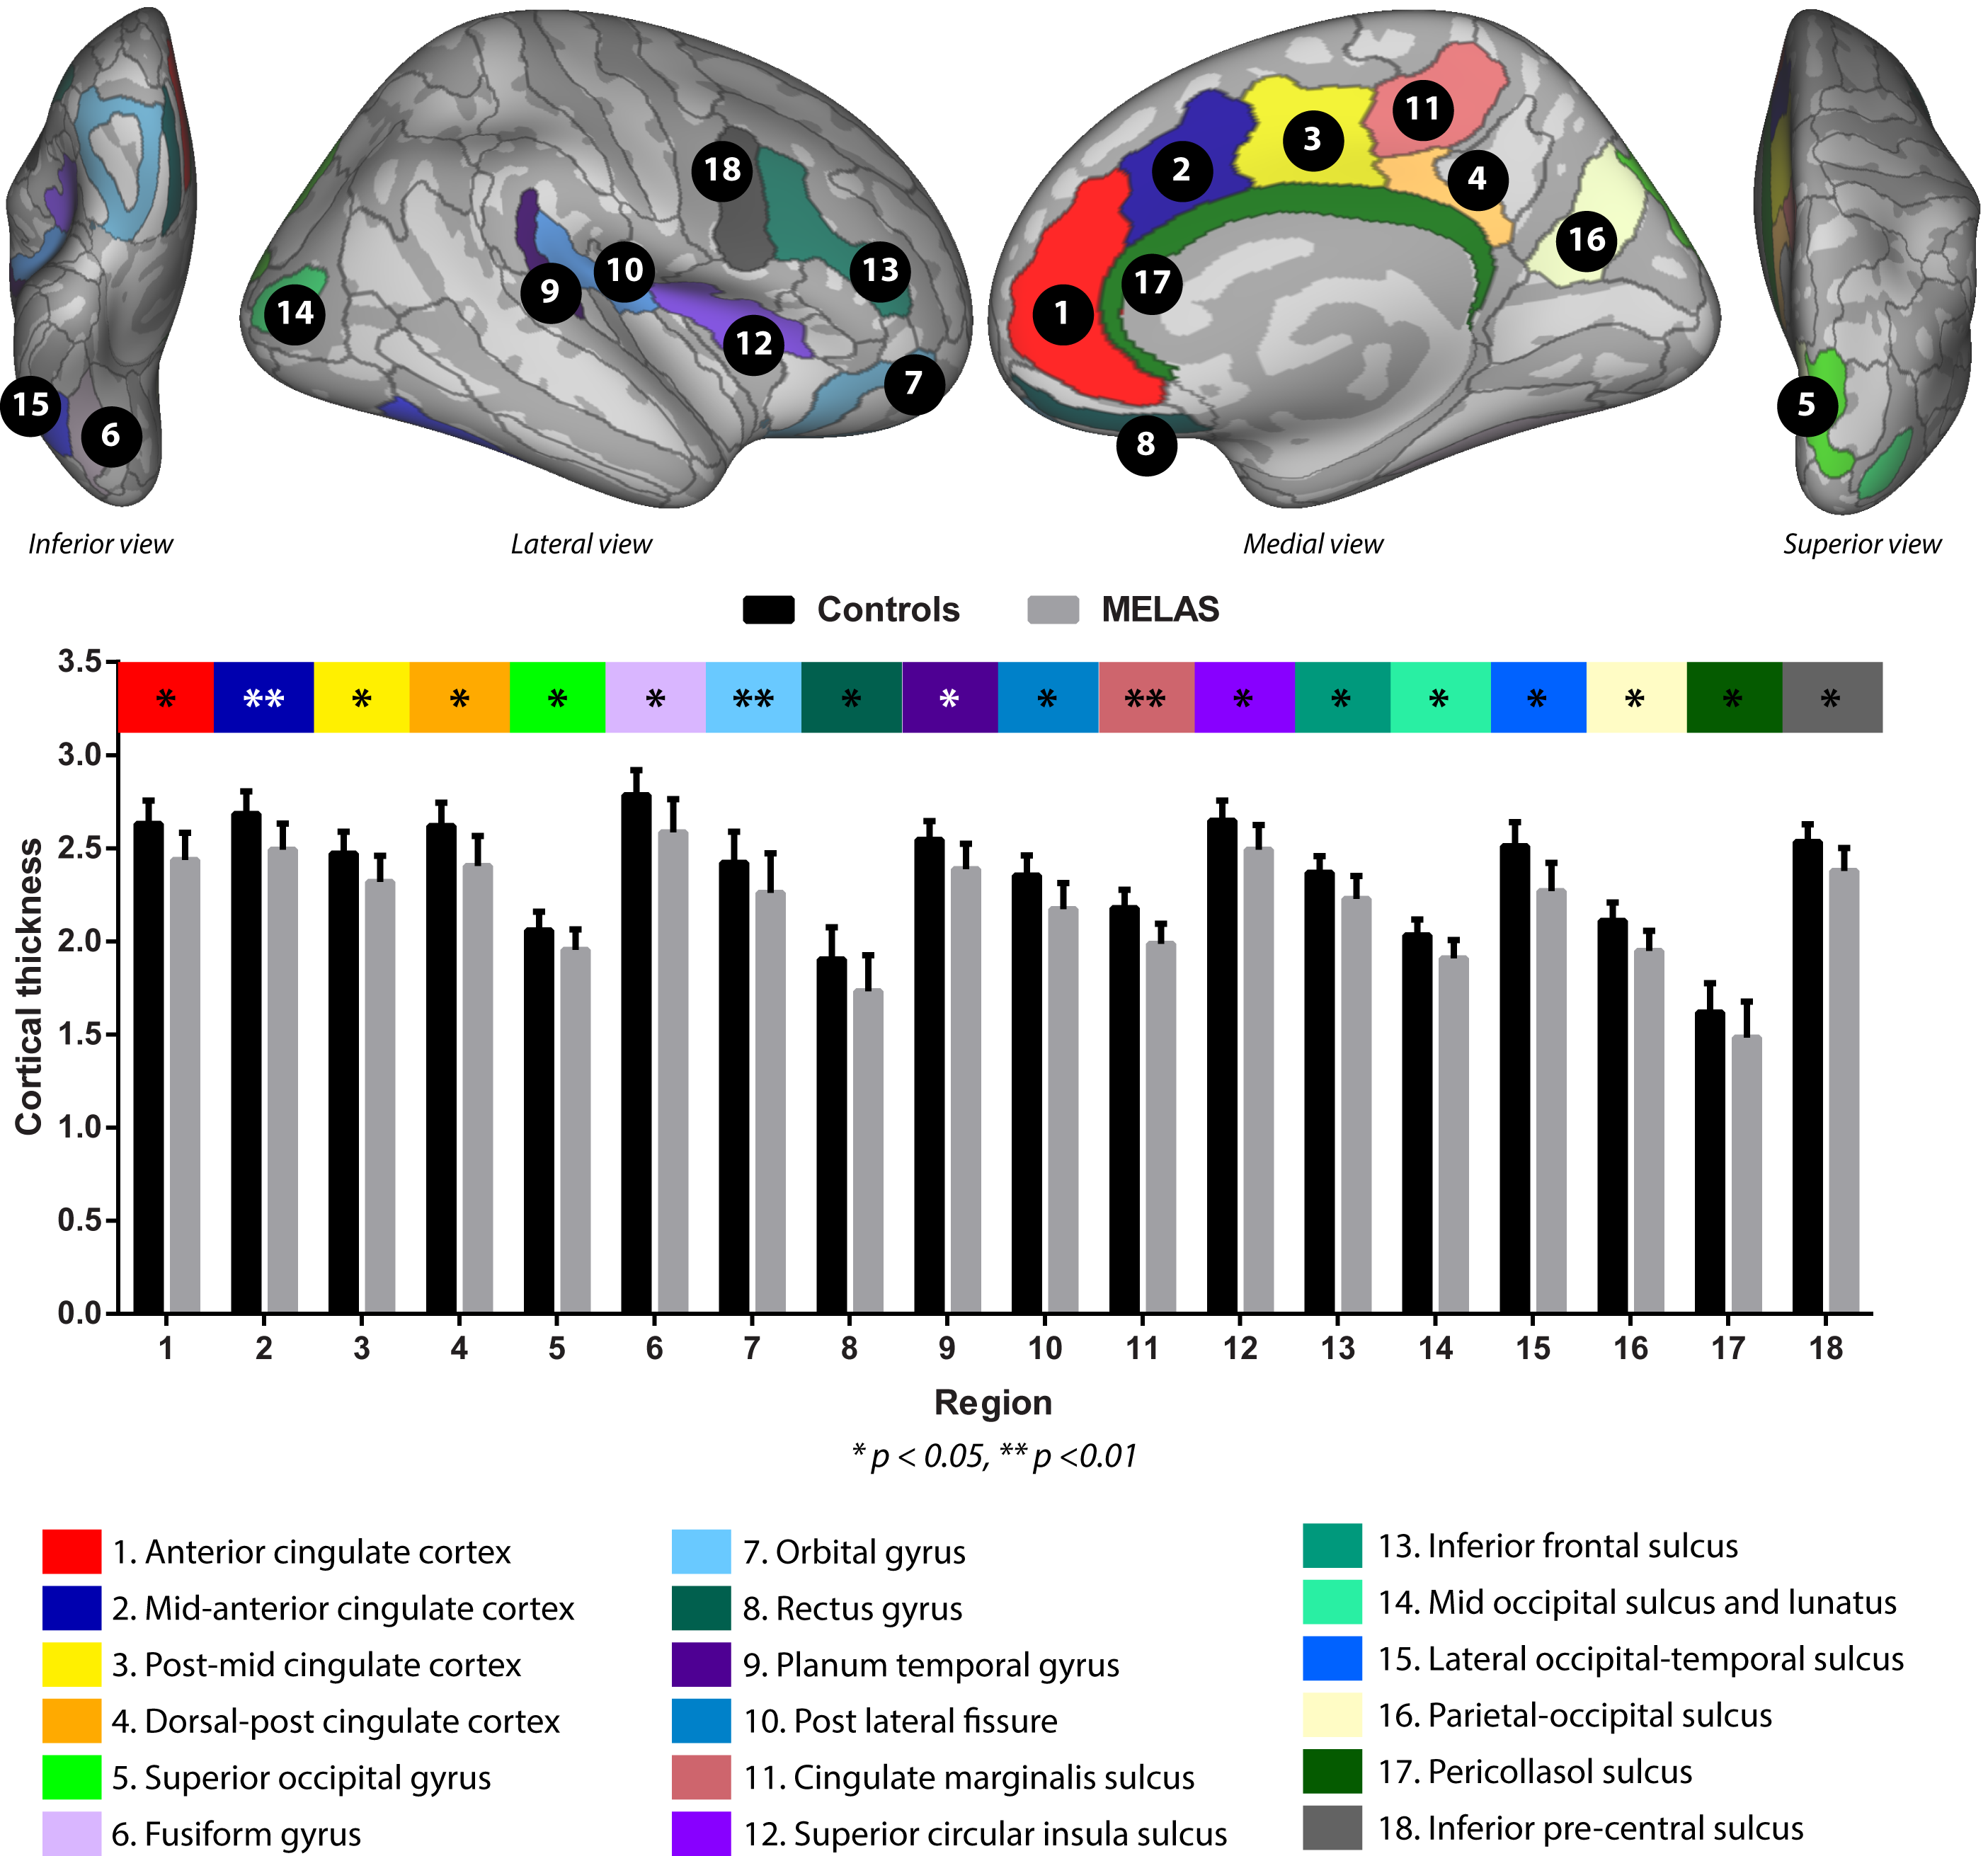
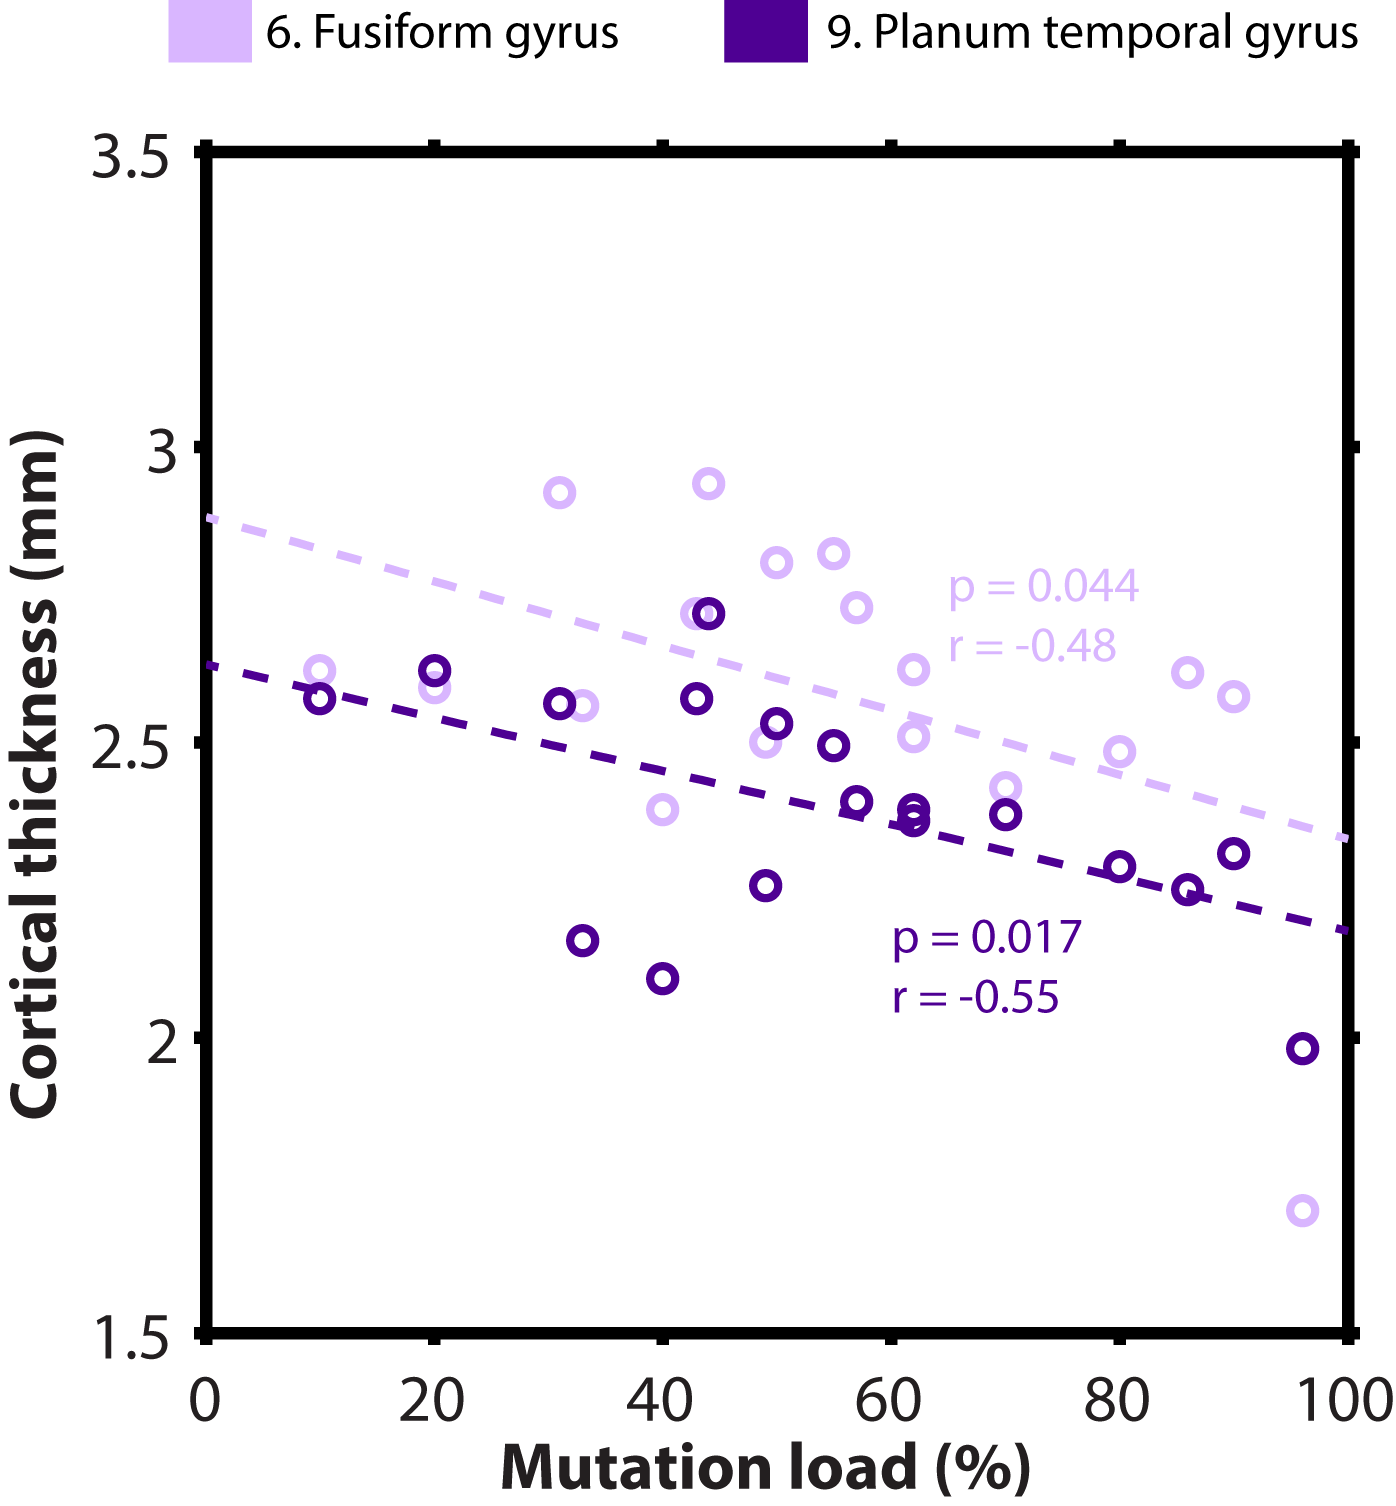
Example MP2RAGE data from a control (42 yrs. old) and two MELAS patients (45 and 24 yrs., resp.) are displayed in Fig. 1, for illustration. Fig. 2 illustrates the (number- and color-coded) regions that were characterized by significantly reduced cortical thickness for the MELAS patients (grey bars; N=18, mean age = 35.58 ± 10.78 yrs. and 13 females) compared to the controls (black bars; N=12, 39.94 ± 9.38 yrs. and 9 females), after correction for possible differences in age, gender and educational level (p-values are indicated by asterisks). Significant correlations between mutation load and cortical thickness (within the MELAS group) were observed for the planum temporal (p=0.017, r=-0.55) and fusiform gyri (p=0.044, r=-0.48), see Fig. 3. In general, cortical thickness seems to decrease with increasing mutation load.Results
This is the largest neuroimaging study focusing on possible brain changes in patients that carry the m.3243A>G mutation. Several regions were characterized by a reduced cortical thickness for the MELAS patients compared to the controls. These include regions associated with the cingulate cortex, insula, frontal lobe and visual cortex. In addition, the strongest correlations between mutation load and cortical thickness within the MELAS group were detected for the for the fusiform and planum temporal gyri, structures involved in for example visual working memory and auditory processing, respectively6,7. The latter seems to correspond with the high prevalence (48%) of auditory impairment in MELAS patients2. More thorough examination is currently on-going using all the acquired MR modalities and patient characteristics (including cognitive functioning) to extensively map the brain changes in m.3243A>G carriers.Acknowledgements
The authors are indebted to Prof. Dr. Andrew Webb (Leiden University Medical Centre, Leiden, Netherlands) and Dr. José Marques (Donders Institute for Brain, Cognition and Behaviour, Nijmegen, Netherlands) for providing the dielectric pads and the MATLAB code to perform the post-hoc T1 correction used in this study, respectively.References
[1] Goto et al. Nature. 1990 Dec 13;348(6302). [2] de Laat et al. J Inherit Metab Dis. 2012 Nov;35(6). [3] Teeuwisse et al. Magn Reson Med. 2012 Apr;67(4). [4] Sallevelt et al. J Med Genet. 2013 Feb;50(2). [5] Haast et al. Front Neuroanat. 2016 (in press). [6] Han et al. Neuroimage. 2013 Jun;73. [7] Deouell et al. Neuron. 2007 Sep 20;55(6).
Figures