2336
Wired minds: The neural underpinning of the entrepreneurial brain1Mint Labs, Barcelona, Spain, 2IDIBAPS, Hospital Clinic, Barcelona, Spain, 3Department of Personality, Universitat Barcelona, Barcelona, Spain
Synopsis
Very little is known
Purpose
Neural underpinnings of entrepreneurship are not well understood yet. The startup economy is well-known for successful young entrepreneurs who turned into millionaires, often with stories of misconduct and aggressive kill-or-be-killed attitudes inside the startups. Recent publications suggest that the behavior of psychopaths and entrepreneurs is not very different1. This study aims to take an overall view of the personality traits typically associated to an entrepreneur (determined by a psychometric assessment) and compare these to connectivity indices and cortical brain measurements. This is a proof-of-concept work towards bridging the gap between psychometric and brain underpinnings, and understanding the entrepreneurial brainMethods
Data – MRI Acquisitions were performed on 15 healthy volunteers using 3T Siemens TrioTim MRI scanner. The MRI protocol included a 3D structural T1-weighted MPRAGE sequence (TR/TE/TI=1900/4.44/1050ms, Flip angle: 8°, FOV: 256×256mm2, voxel resolution isometric 1mm3), a 3D structural T2-weighted sequence (TR/TE=3780/96ms, Flip angle: 120°, FOV: 384×384mm2, voxel resolution 0.6250x0.6250x3.3000mm3) and DWI HARDI acquisitions with a spatial resolution 2.5x2.5x2.5mm³, 82 gradient directions, 10 interleaved b0, TR/TE=8300/115ms, b value = 3000s/mm²).
Psychometrics - The participants were either CEOs or company founders (entrepreneurs), or other members of the startups, primarily developers. A self-report 40-question psychometric survey was given to assess relevant traits of the participants such as: 'Extraversion', 'Openness to Ambiguity', 'Compulsion', 'Innovation', 'Risk-Taking'. A total entrepreneurial score was calculated based on these traits. The psychometrics also evaluated traits associated to company directors (CEOs) - the ‘so called' Dark Triad: 'Narcissism', 'Machiavellianism', 'Psychopathy' 2,3,4,5.
Morphometrics - We evaluated cortical and subcortical gray matter volumes for each parcellation region computed with ANTs cortical segmentation pipeline, using OASIS-30 Atropos Template and the Desikan-Killiany-Tourville cortical labeling protocol. All volumetric data were normalized by the intracranial volume (ICV), with volume brain region / ICV. We calculated the connectome matrices with an ‘in-house’ pipeline, combining cortical and subcortical parcellations and white matter tracts. In our pipeline, we used MRtrix software for modeling constrained spherical deconvolution and deterministic fiber tracking with the HARDI datasets. The matrices consist of the number of fibers connecting every two regions of the parcellation scheme.
Statistical Analysis - First, we performed a correlation study to evaluate which cortical regions are associated with entrepreneurship. Linear regression analyses were used to examine the relationships between psychometrics and each parcellated and normalized brain region. We computed a Monte Carlo permutation test (10000 permutations) using Person’s R correlation coefficient, implemented with Python libraries. A corrected 2-tailed P<0.05 was determined as the threshold for the interpretation of the statistical results. Furthermore, we performed similar Monte Carlo permutation tests, evaluating the relationship between psychometric scores and each individual’s connections in the computed connectomes. This results in a matrix reflecting the strength of the relationship between the brain circuitry and the personality traits.
Results
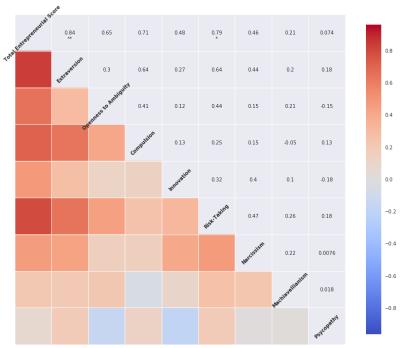
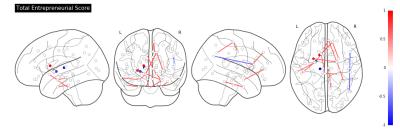
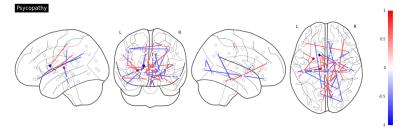
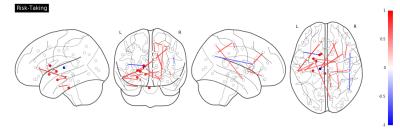
Researchers in moral neuroscience reviewed several publications in the field and described a comprehensive set of brain areas related to high-level mental processes6. Figure 1 shows a correlation plot illustrating the relationships between the different psychometrics analyzed in our study.The volumes of the nucleus accumbens (r2=-0.44) show a significant inverse correlation with the total entrepreneurial score. These regions have been associated with executive function (e.g., inhibitory control), and aversion, motivation and reward, as well as positive reinforcement. Connectivity indices between brain regions such as the amygdala, the nucleus accumbens, and the putamen show high correlation (r2>0.6) with the total entrepreneurial score. Other brain circuits, involving brain regions normally associated with the limbic system such as the thalamus, amygdala, hippocampus, parahippocampal gyrus, and associative connections of corpus callosum show high association with the different score, such as psychopathy and risk-taking. These circuits have been associated to emotional, behavioral, and motivational regulation. Figure 2,3 and 4 illustrate the significant connections reflecting a strong relationship between the total entrepreneurial score, Psychopathy, and Risk-Taking, respectively.Conclusion
This is a preliminary study exploring the relationship between psychometrics, inner brain structures, and respective brain circuits. Our initial results indicate significant relationships between connectivity involving brain regions (e.g., limbic system) and associated personality traits. However, the sample size in this study was small and therefore these results should be considered with caution. We expect that these initial results will serve as a base for future studies with bigger sample size. In these times of rapid expansion of the startup scene, it is important to study the brains of the entrepreneurs as we can better understand their drive for success, creation, and innovation.Acknowledgements
No acknowledgement found.References
1. Akhtar R., et al. Greed is good? Assessing the relationship between entrepreneurship and subclinical psychopathy. Personality and Individual Differences. 54.13 (2013): 420-425
2. Matthews S. C. et al. Selective activation of the nucleus accumbens during risk-taking decision making. Neuroreport. 15.13 (2004): 2123-2127.
3. Müller J. L., et al. Abnormalities in emotion processing within cortical and subcortical regions in criminal psychopaths: evidence from a functional magnetic resonance imaging study using pictures with emotional content. Biological Psychiatry. 54.2 (2003): 152–162.
4. Omura K., et al. Amygdala gray matter concentration is associated with extraversion and neuroticism. NeuroReport 16.17 (2005): 1905-908.
5. Wright Cl. et al. Neuroanatomical Correlates of Extraversion and Neuroticism. Cereb Cortex 16 (12) (2006): 1809-1819.
6. Pascual L. et al. How does morality work in the brain? A functional and structural perspective of moral behavior. Frontiers in Integrative Neuroscience. 12 (2013): 7: 65.
Figures


