2335
Attenuated low frequency oscillations in focal cortical dysplasia1Departments of Radiology and Nuclear Medicine, Maastricht University Medical Center, Maastricht, Netherlands, 2Department of Electrical Engineering, Eindhoven University of Technology, Eindhoven, Netherlands
Synopsis
The objective was to assess the time-signature of spontaneous BOLD brain fluctuations in patients with focal cortical dysplasia (FCD) and to compare these with other regions and healthy controls. Whole cerebrum resting-state functional MRI time-series were analyzed using three different BOLD measures: wavelet entropy, regional homogeneity and fractional amplitude of low frequency fluctuations. All the three BOLD measures indicated attenuated low frequency oscillations in FCD lesions compared to controls. Also abnormal BOLD activity was found in the proximal and contralateral region, which can complicate the interpretation on what regions are functionally normal, functionally connected or abnormal in patients with FCD.
Purpose
Focal cortical dysplasia (FCD) is a congenital abnormality of brain development that leads to a disorganization of neurons in the cortex and is a common cause of intractable epilepsy. The pertaining cortical abnormalities can be detected by neuroradiologists using various anatomical MR image contrasts. However, for the delineation it remains unknown where the exact borders are and whether the lesion and its surroundings are functionally (ab)normal regions. Using resting-state functional MRI, we assessed the time signature of spontaneous BOLD fluctuations in patients with FCD to (i) characterize these fluctuations in FCD using spatial and temporal measures, (ii) to compare these measures in FCD with proximal, contralateral homotopic regions, and healthy controls.Materials and methods
Subjects: Seventeen patients with FCD-related epilepsy were recruited at our specialized epilepsy referral center (age, mean+/-SD: 32+/-11 years; 11 males), as well as 16 healthy controls (35+/-9 years, 7 males).
Imaging: All subjects underwent structural as well as functional MRI at 3T (Philips Achieva, Best, the Netherlands) using an 8-element receive-only SENSE head-coil. Structural imaging involved T1-weighted, FLAIR and task free functional MRI were used for MR imaging. The settings for functional MRI were: Single-shot echo planer imaging sequence; TE/TR 35/2000ms; 2x2 mm2 in plane resolution, 4 mm axial slices; 195 dynamics; and acquisition time 6.5 m.
Using SPM8 software, the functional images were slice-time and motion corrected and co-registered to the anatomical template. Any signal drifts were corrected by removing the very low frequency components (<0.01 Hz). To correct for physiological fluctuations, the time-series from the cerebrospinal fluid (CSF) and white matter were included as co-variates in the linear regression analysis.
BOLD measures: Three known BOLD measures were evaluated. (i) Kendall’s coefficient of concordance (KCC) was used to measure regional homogeneity (ReHo) of the time series of a given voxel with its nearest 26 neighboring voxels. ReHo measures the similarity in contiguous voxels of the time-series1. (ii) Fractional amplitude of low frequency oscillations (fALFF) was used to measure the activity of neurons. fALFF was computed as the ratio of power spectral density in a slow-5 (10-27mHz) frequency subband and complete frequency range2. (iii) Wavelet entropy is a measure of variation of energy in different wavelet subbands, it is a measure of structure of BOLD time-series3. These measures were computed for the FCD lesion, the proximal region (three surrounding 1 cm thick shells at 1 2, and 3 cm), the contralateral homotopic region and the FCD equivalent functional region in healthy controls and compared. All measures were normalized to the corresponding value of the entire cortex, with the lesion and adjacent 1cm shell excluded.
Student’s t-test was used for statistical comparison analysis, where p<0.05 was considered significant.
Results
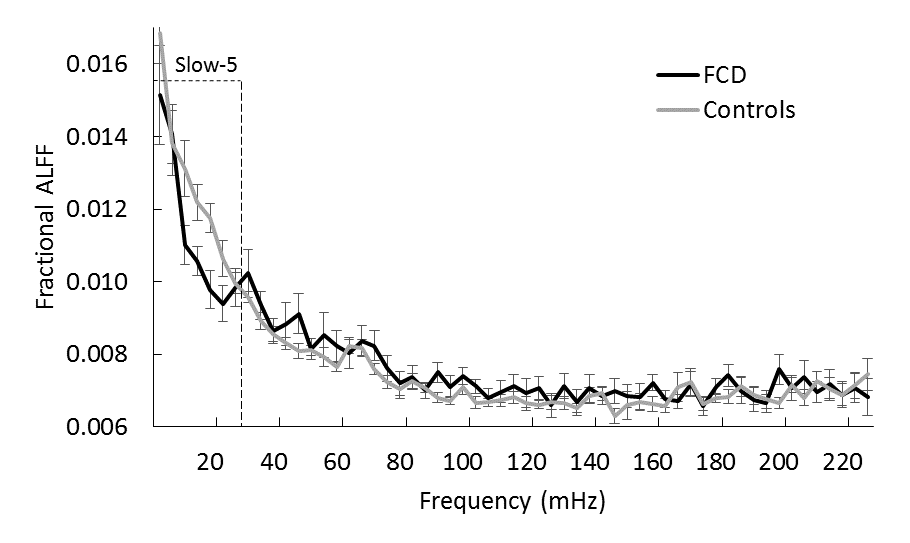
Figure 1 shows the fALFF as a function of frequency, in the range of 10-250 mHz for the various regions. In the slow-5 frequency subband (10-27 mHz), the differences between FCD lesion and controls were stronger than for other frequencies (p<0.05).
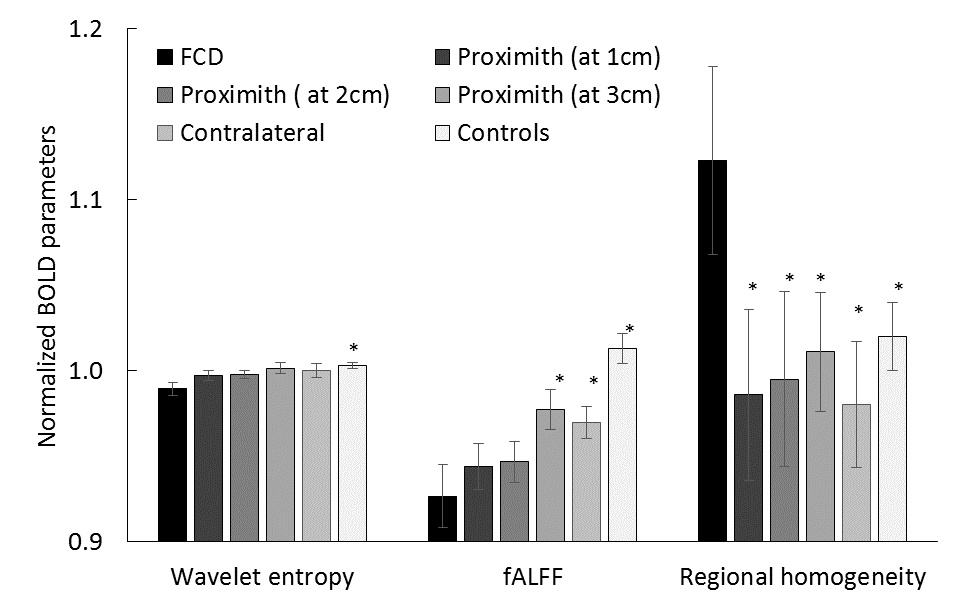
Figure 2 shows the comparison of BOLD measures in the FCD lesion with the other regions. Wavelet entropy and fALFF were significantly decreased in the lesion compared to the control subjects, whereas the ReHo was significantly higher.
ReHo was significantly increased in the lesion compared to the proximal and contralateral regions. fALFF showed significantly increased values in the proximal and contralateral regions relative to the lesion, however these regions also showed significantly decreased fALFF compared to controls. There was a trend with increasing distance for all three BOLD measures in the proximal regions.
Figure 3 depicts a FCD lesion on FLAIR and T1 images.
Discussion and conclusion
All the three BOLD measures indicated attenuated low frequency oscillations in FCD lesions compared to controls. For the FCD lesions, wavelet entropy showed decreased variation in wavelet spectrum, fALFF had lowered amplitudes and ReHo was higher than for controls.
The surroundings of the FCD lesions showed variation in all the three BOLD measures as a function of distance, which were all lower than in controls. This indicates abnormal functional activity in the vicinity of FCD lesions. Also, abnormal activity was observed in the contralateral hemisphere, which complicated the interpretation on what regions are functionally normal, connected or abnormal in patients with FCD.
Acknowledgements
No acknowledgement found.References
1. Zang Y, Jiang T, Lu Y, et al. Regional homogeneity approach to fMRI data analysis. NeuroImage 2004;22:394-400.
2. Zang YF, He Y, Zhu CZ, et al. Altered baseline brain activity in children with ADHD revealed by resting-state functional MRI. Brain Dev. 2007;29:83-91.
3. Rosso OA. Entropy changes in brain function. International Journal of Psychophysiology 2007;64:75-80.
Figures