2332
Altered whole brain connectivity related to time of drug usage in methamphetamine abusers1Department of Radiology, Huaxi MR Research Center, Chengdu, People's Republic of China, 2Department of Psychiatry, West China Hospital, Sichuan University, Chengdu, People's Republic of China
Synopsis
The current study aimed to use a novel graph-theory approach known as degree centrality to help diagnose methamphetamine abusers. Our findings identified increased degree centrality in right middle frontal gyrus, right inferior frontal gyrus and anterior cingulate cortex and degree centrality reductions were revealed in right superior parietal lobe and bilateral lingual gyrus. Additionally, decreased degree centrality of right lingual gyrus negatively correlated with the duration of methamphetamine abuse. Meanwhile, decreased degree centrality of right lingual gyrus might be a predictor of methamphetamine abuse duration with an acceptable diagnostic accuracy of 71%.
Clinical question
How to judge the time of Methamphetamine (MA) usage in an objective way?Impact
Methamphetamine is a highly addictive psychostimulant and the medical, social, and economic consequences associated with its use have become a major international problem. Estimated 12-month prevalence of amphetamine-type stimulant use disorder in the United States is 0.2% among 12- to 17- year-olds and 0.2% among individuals 18 years and older.Approach
The traditional approach to diagnose methamphetamine use disorder is based on Diagnostic and Statistical Manual of Mental Disorder Fifth Edition (DSM-V) or International Statistical Classification of Diseases and Related Health Problems 10th Revision (ICD-10) according to manifestations, which is somewhat relying on clinical experience of physicians. In addition, methamphetamine abusers often disguise the history of drug using or do not tell the truth about dosage and times which may lead to misdiagnosis. Some laboratory tests can help diagnosis. Methamphetamine can be detected in urine for 1-3 days, and possibly up to 4 days depending on dosage and metabolism. Hair samples can be used to detect presence of amphetamine-type stimulants for up to 90 days. However, these methods are not widely used clinically.
Thus, we propose a MRI approach to help diagnose MA use disorder. While clinical MRI sequences like T1, T2, FLAIR are often normal in MA abusers, the newly developed functional MRI sequences are used to detect obscure alterations at function level. Among these sequences, degree centrality (DC) is a graph theory-based network measurements tool at the voxel level and represents the number of direct connections for a given voxel with the rest of the whole brain voxel. Voxel-wise DC can allow us to map the brain functional hubs (brain regions concentrated by large number of connections with the rest of whole brain) without a priori nodes or a region of interest. In our study, we recruited 51 methamphetamine users (males, mean age=28.67±7.58) who met the DSM-IV criteria from a local Detoxification Centre and 33 male healthy controls (mean age=33.84±6.89) were recruited through advertisement. The MRI examinations were performed via a 3-Telsa Siemens MRI system with an 8 channel phase array head coil. The resting-state fMRI sensitized to changes in BOLD signal levels were obtained via an EPI sequence (TR/TE=2000/30msec, flip angle=90°, slice thickness=5mm with no gap, 30 axial slices, 205 volumes in each run).
DPARSFA software was used to calculate the parametric maps of degree centrality, an undirected adjacency was then obtained by thresholding each correlation at p<0.001 (r=0.2). Further, Voxel-based analysis of the DC map between the MA abusers and the healthy controls was performed using two sample t-test in SPM. The AlphaSim-corrected p value of less than 0.05 at cluster-level was deemed to be significant for the analysis. The DC values at significant different regions were extracted to perform the correlation with the clinical and behavioral assessment scales and the diagnostic accuracy of MA use disorder was evaluated using receiver operator characteristic (ROC) analysis.
Gains and Losses
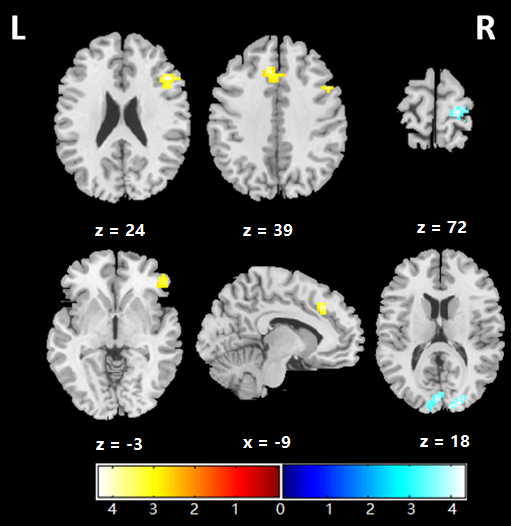
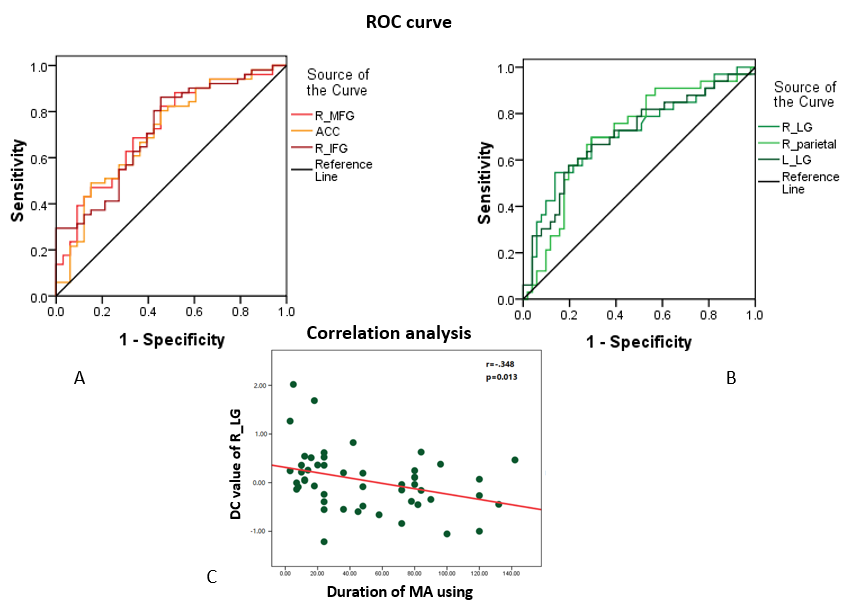
Compared with healthy controls, we found increased DC in right middle frontal gyrus (MFG), right inferior frontal gyrus (IFG) and ACC and decreased DC were found in right superior parietal lobe (SPL) and bilateral lingual gyrus (LG) (Figure 1). Correlation analysis showed that the decreased DC of right LG was negatively correlated with the duration of MA using (r=-.348, p=0.013. Figure 2C), indicating patients with a longer duration of MA using has lower DC value in right LG. As shown in figure 2, area under the ROC curve (AUC) for DC value of the altered functional brain regions of MA abusers are all greater than 0.7 indicating a moderate diagnostic value. Especially, the AUC for DC value of right LG as a predictor of MA abuser was 0.71 (standard error 0.06, CIs 0.60–0.83). The optimal cutpoint according to the method of Youden was ≤0.5495, which resulted in sensitivity/specificity of 54.5/86.3%. In conclusion, decreased DC of right LG might be a predictor of MA usage duration with an acceptable accuracy.
Gain: MRI is efficient, safe and no radiation and we can acquire objective information about the subjects using variable MR sequence; Based on the principle of functional MRI, we could learn some mechanical information about MA use disorder. Loss: It’s time consuming to obtain MRI and image preprocessing and data analysis are complex so that an efficient pipeline is needed.
Preliminary Data
Patients were recruited from the outpatient of the First Hospital Affiliated to Wenzhou Medical University of Mental Health Center and healthy controls were recruited from local schools. The resting state functional MRI were obtained via a 3-Telsa Siemens system.Acknowledgements
This study was supported by the National Natural Science Foundation (Grant No. 81671669 and 81171488)References
No reference found.Figures