2331
Enhanced visualization of lesions in focal cortical dysplasia using the fluid and white-matter suppression (FLAWS) sequence1Radiology, Xuanwu Hospital Capital Medical University, Beijing, People's Republic of China, 2MR Collaborations NE Asia, Siemens Healthcare, Beijing, People's Republic of China, 3Advanced Clinical Imaging Technology, Siemens Healthcare AG, Lausanne, Switzerland, 4Radiology, University Hospital (CHUV), Lausanne, Switzerland, 5LTS5, École Polytechnique Fédérale de Lausanne, Lausanne, Switzerland
Synopsis
High contrast in the lesion area is one of the most important prognostic factors for focal cortical dysplasia (FCD). The fluid and white-matter suppression (FLAWS) sequence provides two sets of 3D contrasts from one acquisition: one nulls the white-matter signal, the other nulls the cerebral spinal fluid signal. A new image (the FLAWS contrast) calculated from these two images may enhance the visualization of FCD lesion features, specifically the blurred grey-white matter interface and the transmantle sign. In this study, we assessed the ability of FLAWS to visualize FCD lesions. Our results demonstrate that FLAWS is sensitive to lesional tissue, especially the transmantle sign, providing additional value in MR-based FCD diagnostics.
PURPOSE
Focal cortical dysplasia (FCD) is a common cause of pharmacoresistant focal epilepsy. The most common findings of FCD are cortical or subcortical hyperintensities on T2WI and FLAIR images and a blurred grey-white matter interface. However, identification of FCD is challenging because the lesion may be very subtle. We propose using a fluid and white-matter suppression (FLAWS) sequence to aid the radiological diagnosis. The FLAWS sequence provides two sets of 3D, high-spatial-resolution images from one acquisition: one image nulls the white-matter (WM) signal (DIR-like) and the other image nulls signal from cerebrospinal fluid (CSF) (MPRAGE-like)1. A minimum image calculated from these two images suppresses signal from both WM and CSF, resulting in a grey-matter-specific image that enhances visualization of the aforementioned FCD features. In this study, we evaluate the diagnostic value of FLAWS for lesion detection in MRI-negative FCD patients.METHODS
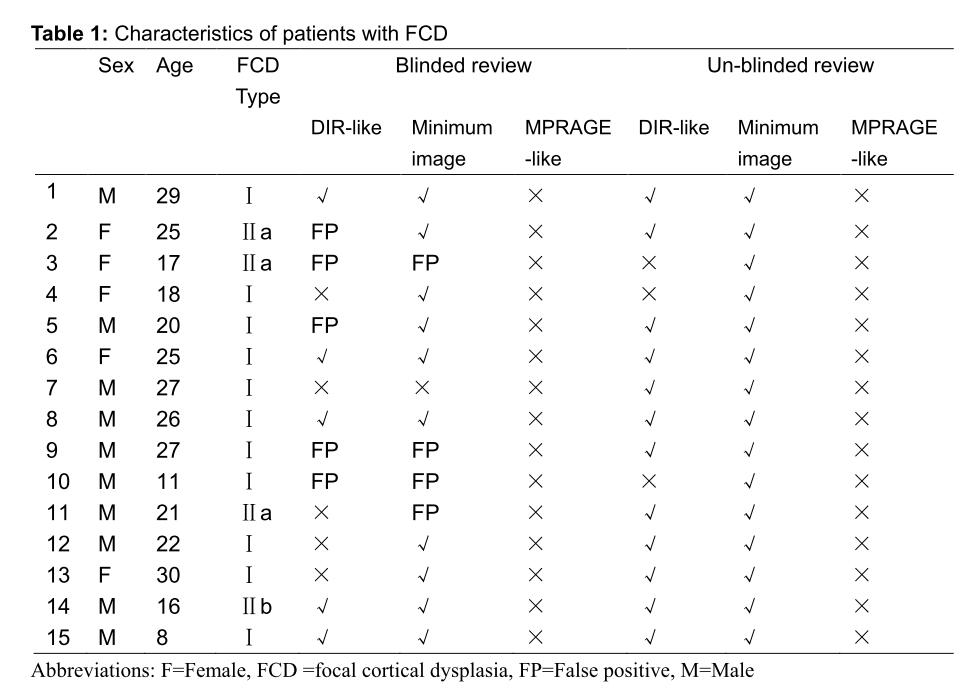
We analyzed 18 FCD patients. The inclusion criteria were: (1) existence of a preoperative 3T MRI with normal appearing in conventional scan, (2) existence of a FLAWS sequence and (3) histologically proven FCD. The exclusion criteria included cases with poor MRI image quality. Each patient was scanned on MAGNETOM Tim Trio, 3T MR scanner (Siemens, Erlangen, Germany) using a conventional MR protocol for head (T2WI, axial and coronal FLAIR) and a 3D FLAWS sequence (TR=5000ms; TE=2.88ms; TI1/TI2=409ms/1110ms; FA1/FA2=5°/5°; matrix size=256x240x180; voxel size=1×1×1mm3). One senior neuroradiologist evaluated all MRI images. Suspicious FCD lesions were pointed out on the DIR-like, the MPRAGE-like and the minimum intensity projection images (“FLAWS contrast”). Other supplementary examinations, including EEG and/or MEG, SPECT and/or PET-CT, and clinical information, were also evaluated by the same radiologist. Each patient’s images were evaluated twice: first, only MR images were reviewed without reference to any other information; and subsequently, MR images and supplementary imaging and clinical information were evaluated all together. MRI findings were compared to the interpretations of Electrocorticography (ECoG) as the gold standard.RESULTS
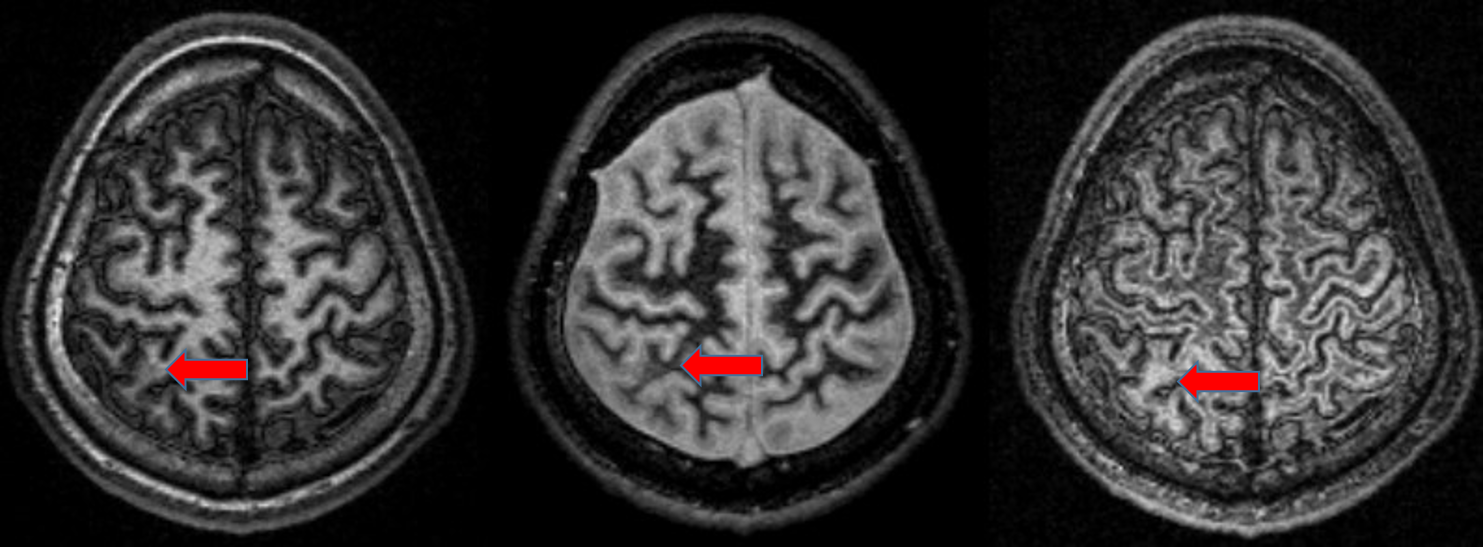
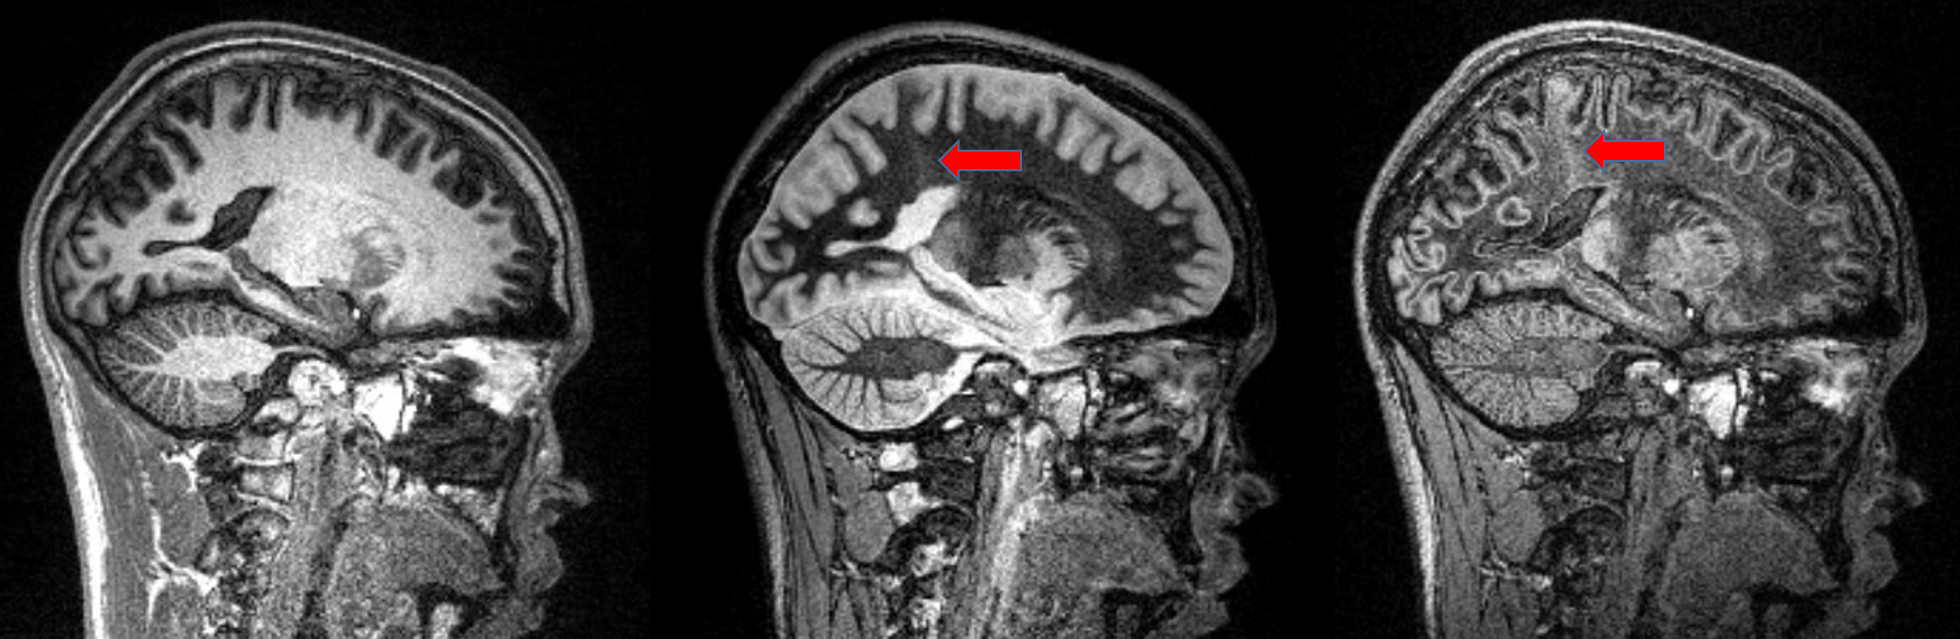
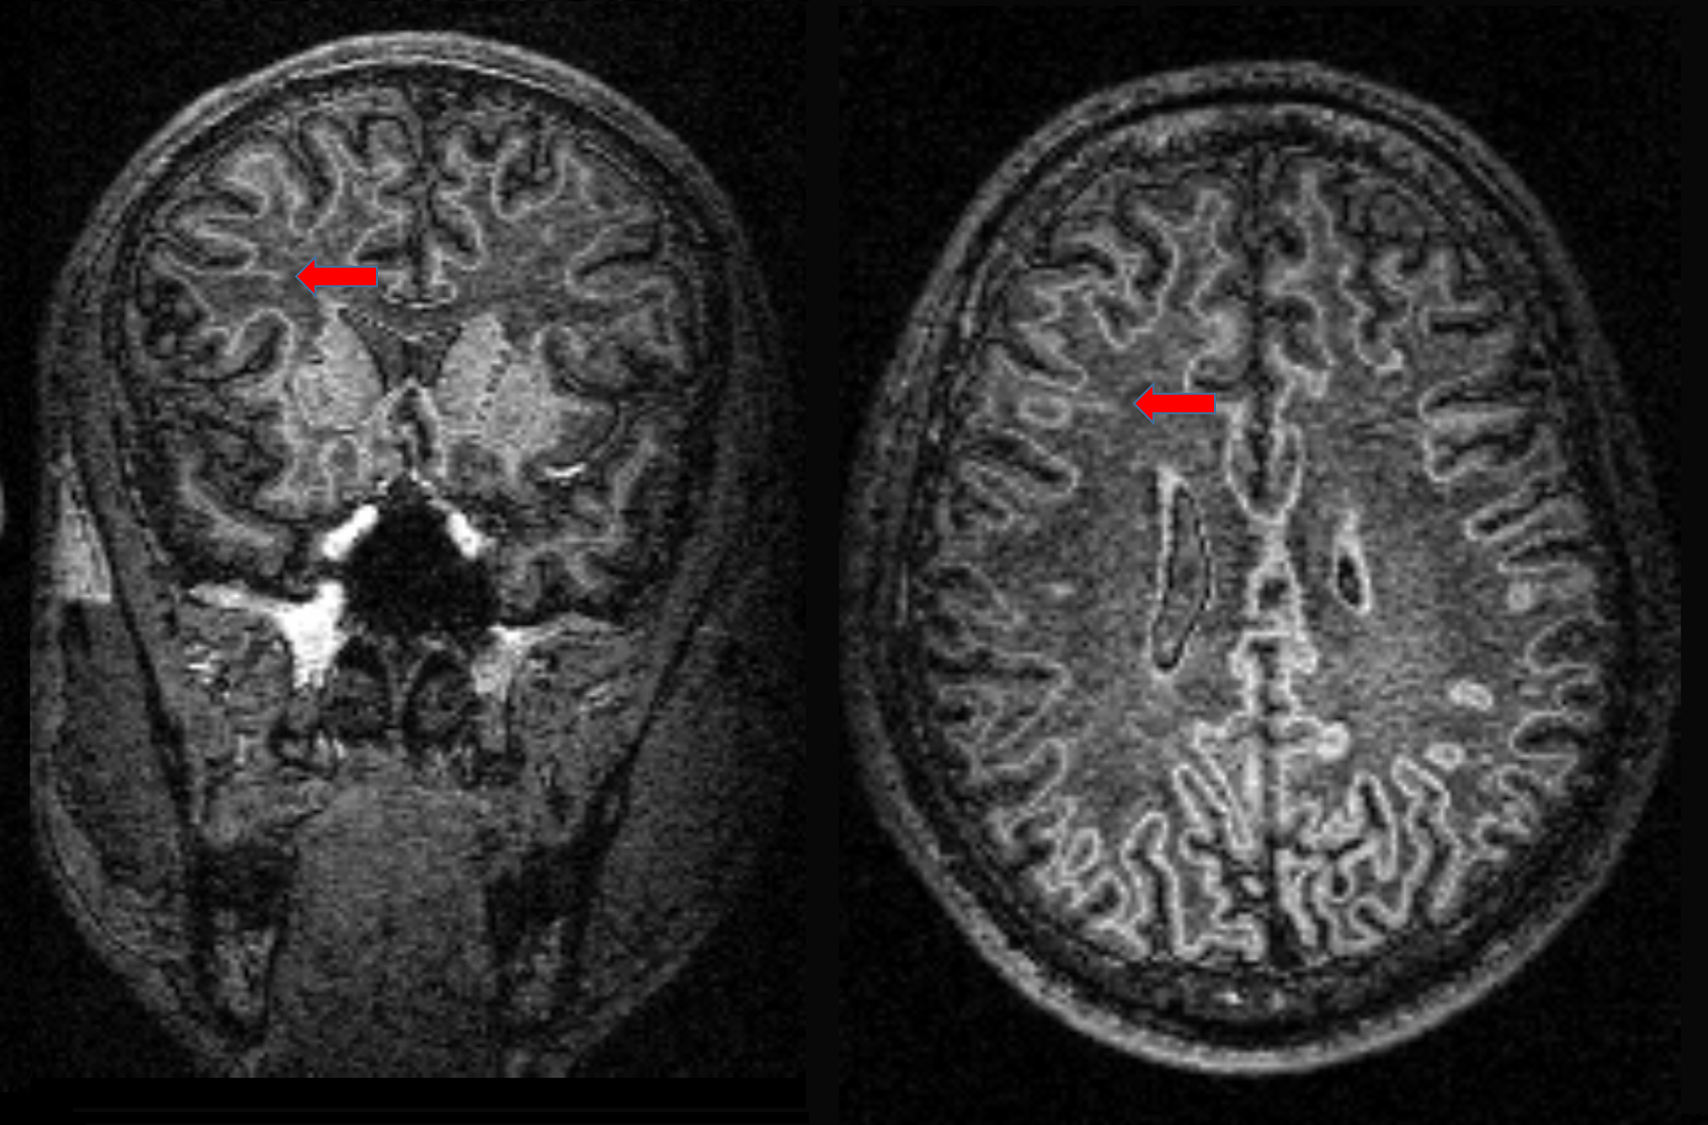
The images obtained from three patients were excluded due to significant motion artifacts. Characteristics of the remaining fifteen patients are summarized in Table 1. The WM-nulled image achieved an accuracy of 33.3%, and the FLAWS contrast showed a sensitivity of 66.7%. The achieved accuracy was notably higher when the reviewer had access to all information: 80.0% for the WM-nulled image, and 100% for the FLAWS image. Interestingly, except for one patient who was the only case with FCD type IIb (Figure 1), the reviewer could not identify the lesion on the MPRAGE-like image in any of the other patients, even when aware of the lesion location (Figure 2). In addition, according to the FLAWS contrast, the transmantle sign was not limited to the epileptogenic zone (Figure 3).DISCUSSION
Detecting FCD lesions using MRI is challenging. The most common finding is a blurred interface between grey and white matter. Another common finding is a transmantle sign with hyperintensity on T2WI and FLAIR images extending from the subcortical area to the margin of the ventricle. The FLAWS sequence can generate two sets of 3D images in a single scan: one similar to T1-MPRAGE for displaying brain anatomy and the other WM-nulled contrast for improving visualization of subcortical structures1. The minimum “FLAWS” image generated from the two contrasts suppresses both signals. That is to say, the synthetic minimum value image is grey matter-dominant with the ability to enhance the visualization of the aforementioned FCD features. We compared the DIR-like WM-nulled image and the CSF-nulled, MPRAGE-like image with the findings of ECoG as the gold standard.
The finding that most of our patients were FCD type I was in line with the fact that FCD type I is the most common pathologic type in MRI-negative pharmacoresistant focal epilepsy2. The transmantle sign, which likely represents the footprint of disrupted neuronal migration along radial glial processes, was the main manifestation of disease in our patients. Our result suggests that the FLAWS image had a superior sensitivity for the transmantle sign than the WM-nulled image. The fact that the transmantle sign was not visible on T1-weighted images could explain why the MPRAGE-like images were unable to visualize lesions in our patients. In addition, the transmantle sign was not limited to the epileptogenic zone. The widespread abnormal regions suggested an anatomical and functional network mechanism linked to the epileptogenic zone.
CONCLUSION
The major advantage of the FLAWS sequence for FCD is that one single scan can produce three different 3D high-spatial-resolution anatomical images for preoperative evaluation of FCD in a clinical feasible time.Acknowledgements
We would like to specially thank Dr. Zhiwei Ren, the functional neurosurgeon of Xuanwu hospital, for his assistance in data collection.References
1. Tanner M, Gambarota G, Kober T, et al. Fluid and white matter suppression with the MP2RAGE sequence. J Magn Reson Imaging 2012;35:1063-1070.
2. Bernasconi A, Bernasconi N, Bernhardt BC, et al. Advances in MRI for 'cryptogenic' epilepsies. Nat Rev Neurol 2011;7:99-108.
Figures