2330
A Chemical Warfare Nerve Agent Causes Regional Changes in Brain T2—Consistent with Localized Edema1Radiology, University of Calgary, Calgary, AB, Canada, 2National Defence, Defence Research And Development Canada, Suffield, AB, Canada
Synopsis
Chemical Warfare Nerve Agents (
Purpose
Chemical warfare nerve agents (NA) continue to be a threat to both civilians and military personnel. The United Nations have identified NAs as a weapon of mass destruction due to their potential to cause mass casualty scenarios with little to no warning and limited resources. As tensions increase in the Middle East, the potential for a release of a chemical warfare agent becomes of increasing concern. Organophosphate NAs cause an accumulation of acetylcholine in the neuronal synapse and neuromuscular junction resulting in a cholinergic crisis by irreversibly inhibiting acetylcholinesterase1. The immediate and short-term physiological consequence of NA poisoning are well understood, however, our understanding of the resultant neurological deficits after sub-lethal doses is limited. Following the Iran/Iraq conflict and the Tokyo subway attack2, case studies found neurological deficits, however, these are not well understood or characterized. The objective of this study was to identify structural changes in the brain after a convulsive dose of soman that can potentially serve as a marker of damage and a target area for therapy.Methods
Animals: Male Sprague-Dawley rats (200-300g, Charles River) were used for this study. This research protocol was approved by the University of Calgary Animal Care Committed and conducted in accordance with the Canadian Council on Animal Care guidelines. Imaging Time Points: At least 24 hours before soman injection, control images were taken in isoflurane-anaesthetized animals. Total of 5 animals were imaged before and 1 hour after soman. Total of 4 animals were imaged before and 18-22 hour after soman. Pretreatment: 30 minutes prior to soman injection, 125mg/kg of HI-6 dimethansulfonate (DMS) and 20mg/kg of atropine methyl nitrate (AMN) were injected intraperitoneally (ip) to reduce mortality from excess mucous secretion. Soman Injection: A 90μg/kg dose of soman was subcutaneously injected in the scapular region of lightly anaesthetized animals. Animals rapidly awoke from anaesthesia and within 3 to 5 minutes after soman injection, NA induced symptoms were noted. Every animal had convulsions within 10 minutes post dosing. Post treatment: Up to an additional three doses of HI-6 and AMN every 20 minutes were given post soman injection. MRI Parameter: MRI was performed in vivo on rodents anaesthetized with isoflurane on a 9.4T Bruker Avance console with a 35mm volume coil. (Multi-slice multi-echo 32 echo T2: TR= 6534ms, 32 echoes were collected with 10ms echo spacing and 1 average, 20 slices, FOV= 30x30mm, matrix= 128x128, voxel size: 0.23x0.23x0.8mm).Results
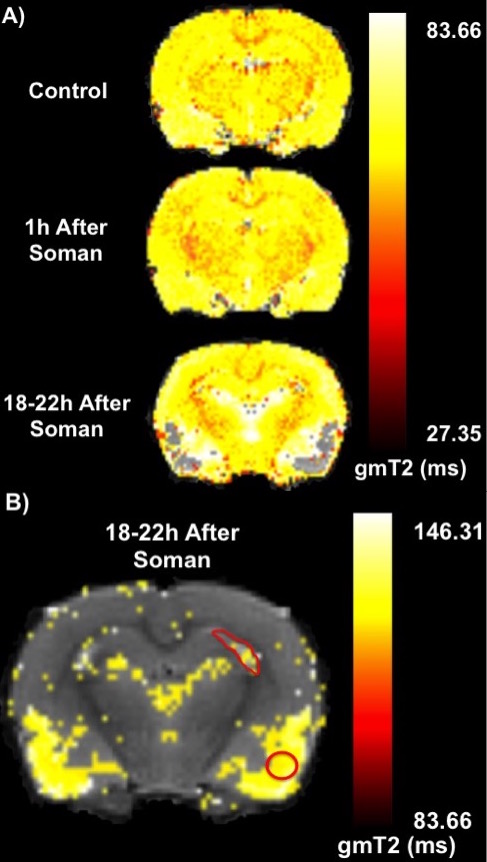
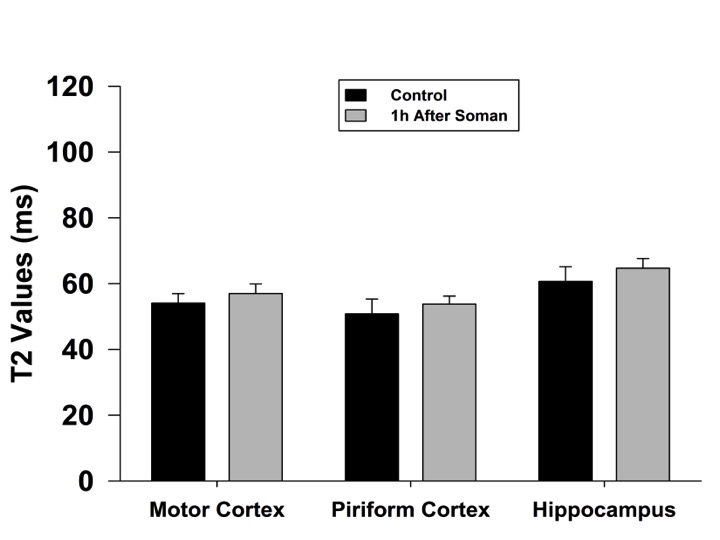
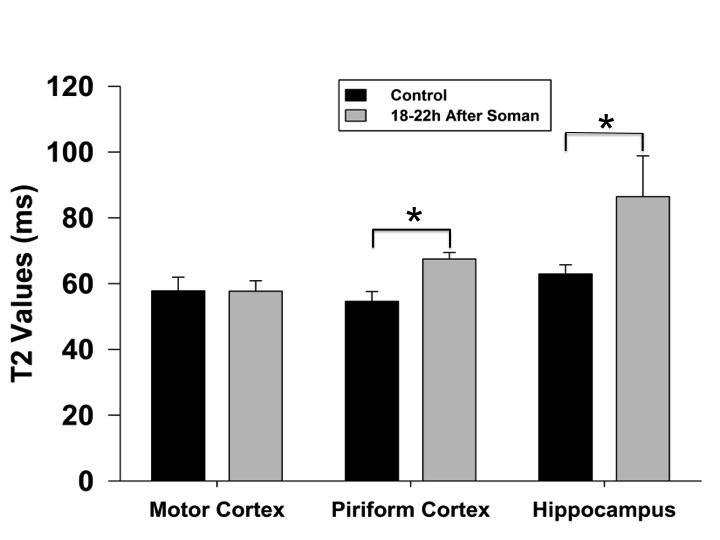
Qualitatively, at 1h after soman injection, there was no difference compared to the control (Fig. 1A). At 18-22h after soman injection, hyperintense lesions could be seen in the hippocampus and piriform cortex (Fig. 1B). Quantification of T2, 1h after soman injection shows no significant difference in every region of interest (motor cortex, hippocampus, and piriform cortex) (Fig. 2). 18-22h after soman, there was no significant difference in the motor cortex but there was an increase in the hippocampus and piriform cortex (p<0.05, paired t-test) (Fig. 3).Discussion
Previous findings have shown in guinea pigs that a convulsive dose of soman causes elevated T2 in the piriform cortex and hippocampus3. When a convulsive dose of paraoxon (similar compound to NA) was injected, hyperintensity was seen in the piriform cortex4. T2 values are representative of water content, hence if the water content increases, T2 also increase. After a convulsive dose of soman, the increase in T2 may be from vasogenic edema caused by a disruption in the blood-brain barrier (BBB). Soman and other convulsive seizure inducing agents have shown region specific breakdown of the BBB5-6. Opening of the BBB allows fluid entry into the brain and may increase the cerebral pressure from an increase in brain water content. Anatomically, the piriform cortex and the amygdala are close. The amygdala has been shown to be a very sensitive region to soman related injury and is believed to be the initiation site of soman-induced convulsive seizures7. The injury might be radiating from the BBB disruption in the amygdala to the piriform cortex. It is also unclear whether there is cytotoxic edema. However, based on previous findings it is believed to be a form of both cytotoxic and vasogenic edema8.Conclusions
We have shown vasogenic edema 18-22 hour after a convulsive dose of soman. Previous studies support the piriform cortex to be a highly sensitive area to soman related damage. Thus, we propose the piriform cortex is involved in brain damage after a sub-lethal dose of soman. Also, quantitative T2 in this area may be a good biomarker of the efficacy of novel treatments such as anti-epileptic drugs.Acknowledgements
The authors would like to thank the Experimental Imaging Centre at the University of Calgary for the operation of the 9.4T MRI.References
1. Chen, Yun. "Organophosphate-induced brain damage: mechanisms, neuropsychiatric and neurological consequences, and potential therapeutic strategies." Neurotoxicology 33.3 (2012): 391-400.
2. Okumura, Tetsu, et al. "Acute and chronic effects of sarin exposure from the Tokyo subway incident." Environmental toxicology and pharmacology 19.3 (2005): 447-450.
3. Gullapalli, R. P., Y. Aracava, J. Zhuo, E. Helal Neto, J. Wang, G. Makris, I. Merchenthaler, E. F. Pereira and E. X. Albuquerque (2010). "Magnetic resonance imaging reveals that galantamine prevents structural brain damage induced by an acute exposure of guinea pigs to soman." Neurotoxicology 31(1): 67-76.
4. Shrot, S., D. Anaby, A. Krivoy, I. Makarovsky, Y. Rosman, E. Bloch-Shilderman, S. Lazar, A. Bar-Shir and Y. Cohen (2012). "Early in vivo MR spectroscopy findings in organophosphate-induced brain damage-potential biomarkers for short-term survival." Magn Reson Med 68(5): 1390-8.
5. Carpentier, P., I. S. Delamanche, M. Le Bert, G. Blanchet and C. Bouchaud (1990). "Seizure-related opening of the blood-brain barrier induced by soman: possible correlation with the acute neuropathology observed in poisoned rats." Neurotoxicology 11(3): 493-508.
6. Nitsch, C. and I. Klatzo (1983). "Regional patterns of blood-brain barrier breakdown during epileptiform seizures induced by various convulsive agents." J Neurol Sci 59(3): 305-22.
7. Prager, E. M., V. Aroniadou-Anderjaska, C. P. Almeida-Suhett, T. H. Figueiredo, J. P. Apland and M. F. Braga (2013). "Acetylcholinesterase inhibition in the basolateral amygdala plays a key role in the induction of status epilepticus after soman exposure." Neurotoxicology 38: 84-90.
8. Testylier, G., H. Lahrech, O. Montigon, A. Foquin, C. Delacour, D. Bernabe, C. Segebarth, F. Dorandeu and P. Carpentier (2007). "Cerebral edema induced in mice by a convulsive dose of soman. Evaluation through diffusion-weighted magnetic resonance imaging and histology." Toxicol Appl Pharmacol 220(2): 125-37.
Figures