2329
Brain iron accumulation in Wilson disease measured by QSM and MR relaxometry1MR-Unit, Dept Diagnostic and Interventional Radiology, Institute for Clinical and Experimental Medicine, Prague, Czech Republic, 2German Center for Neurodegenerative Diseases, Magdeburg, Germany, 3Institute of Clinical Biochemistry and Laboratory Diagnostics, Charles University in Prague, 1st Faculty of Medicine and General University Hospital, Prague, Czech Republic, 4Dept Pediatrics and Adolescent Medicine, Charles University in Prague, 1st Faculty of Medicine and General University Hospital, Prague, Czech Republic, 5Dept Biomedical Imaging and Image guided Therapy, Medical University of Vienna, Vienna, Austria, 64th Dept Internal Medicine, Charles University in Prague, 1st Faculty of Medicine and General University Hospital, Prague, Czech Republic, 7KlinMed, Prague, Czech Republic, 8Dept Neurology and Center of Clinical Neuroscience, Charles University in Prague, 1st Faculty of Medicine and General University Hospital, Prague, Czech Republic
Synopsis
Relaxometry and quantitative susceptibility mapping were used in patients with neurologic symptoms of Wilson disease (WD) that leads to copper metabolism disturbances and its gradual accumulation in liver and brain. These quantitative MR techniques revealed decreased T2 relaxation times in the basal ganglia, higher susceptibility in the deep gray matter nuclei and no T1 changes. It indicates presence of insoluble para- or superparamagnetic compounds, presumably in a form of hemosiderin. These deposits appear to be not related to the ceruloplasmin oxidase activity nor with the severity of neurological symptoms.
Purpose
Wilson disease (WD) is a genetic disorder caused by mutation of ATP7B leading to copper metabolism disturbances and its gradual accumulation in liver and brain. Abnormal deposition of paramagnetic compounds in the deep gray matter in WD patients with neurologic symptoms were reported in previous quantitative susceptibility mapping (QSM) and R2* studies [1]. A recent post-mortem MRI histopathology correlation study showed that increased R2* value in the basal ganglia in WD cases was correlated with the iron concentration and with the number of iron-loaded macrophages, whereas no correlation was observed for the copper concentration [2]. Increased iron content may be related to decreased ceruloplasmin, the major serum ferroxidase responsible for cellular iron efflux, and may correlate with neuropathological and clinical severity.Subjects & Methods
26 patients with genetically confirmed neurologic form of WD (16f/10m, 28-63 years) and 16 healthy controls (9f/7m, 28-60 years) were investigated. Patients were examined neurologically using Unified Wilson Disease Rating Scale (UWDRS). All patients were on stable anti-copper treatment; their mean disease duration was 16.3 (1-46) years and neurological UWDRS subscore was 22.5 (1-56). Serum ceruloplasmin oxidase activity was measured using the o-dianysine assay. For MRI, a 3T MR scanner with a 12‑channel birdcage head coil was used. A standard MRI examination protocol was supplemented by relaxometry and susceptibility mapping.
Relaxometry: a CPMG sequence (TR=3000 ms, 32 echoes with TE step 8.3 ms, voxel size 0.8×0.8×5 mm) for T2 maps calculation was used. T1 maps were measured by Inversion Recovery sequence (TR/TE=5000/1.49 ms; FA=35°; same geometry) with 10 values of TI (250-4000 ms). Relaxation maps and times in selected ROIs were calculated using a home-made program VIDI [3]. Globus pallidus (GP), putamen (Put), caudate nucleus (CN) and thalamus (Th) in the left and right hemispheres were evaluated. Standard statistical tests were used for the group comparison.
Susceptibility mapping: QSM maps were reconstructed from 3D multi gradient recalled echo (GRE) sequence (TR=40 ms; six TEs between 5.22 and 34.64 ms; FA=15°; voxel resolution = 0.8×0.8×2 mm2; BW=450 Hz/pixel). Phase images were reconstructed offline using a virtual reference coil approach [4]. QSM reconstruction consisted of (i) continuous Laplacian unwrapping; (ii) variable, spherical mean value property based background field removal (starting radius, 10 mm) and (iii) non-linear MEDIN inversion with λ=1000. Mean QSM values were calculated in the following ROIs (manually traced using ITK-SNAP, www.itksnap.org): GP, Put, CN, and Th; QSM values were normalized to the occipital white matter reference region. Mann-Whitney U test was used for statistical group comparisons; correlations between variables were examined by Spearman coefficient.
All subjects were informed about the study protocol and signed informed consent approved by the local ethical committee.
Results
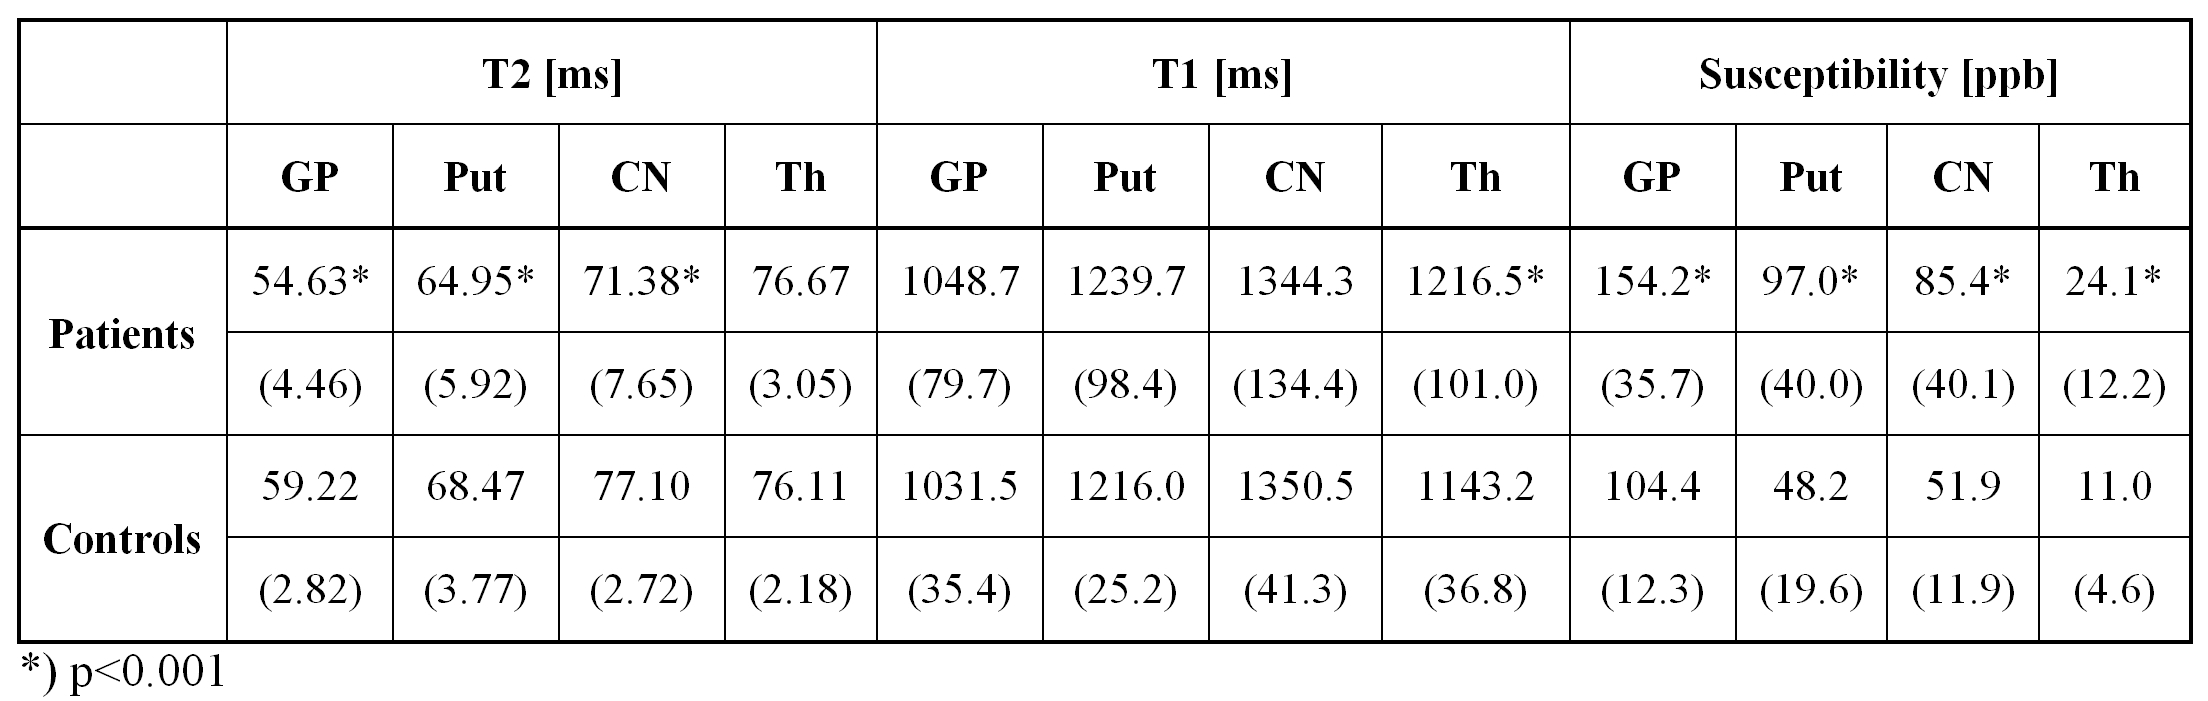
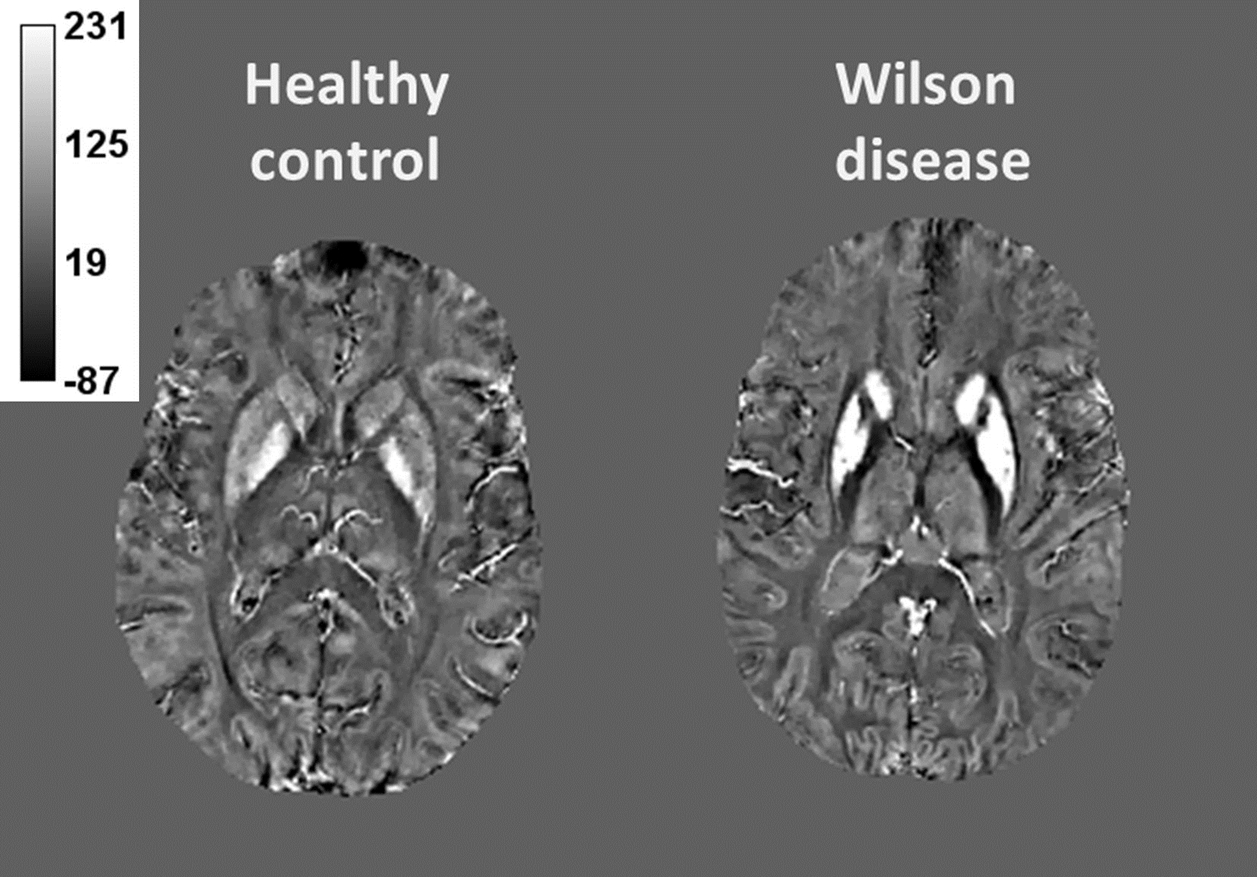
In WD patients, a significant shortening of the T2 relaxation time was found in all examined structures except for thalamus. Contrary to this, T1 significantly differed in thalamus only. For susceptibility, significantly higher values were detected in all examined structures in WD patients. The most pronounced difference was apparent in the putamen, where 100% susceptibility increase was observed, see Table 1, Figure 2. Susceptibility and T2 relaxation time values did not correlate with the ceruloplasmin oxidase activity nor with the UWDRS neurological subscore.
Discussion
Decreased T2 values in the basal ganglia and higher susceptibility correspond to the presumed deposition of paramagnetic compounds in the gray matter nuclei of the WD patients. Post-mortem studies revealed increased iron concentration in the gray matter nuclei [2]. The most common compound containing non-heme iron in the basal ganglia (found also in healthy subjects) is ferritin. However, ferritin would have effected also T1 relaxation; unchanged T1 relaxation times indicate a presence of a compound which is insoluble. Therefore, we hypothesize that iron is present in a form of hemosiderin, which has a strong impact on both T2 and susceptibility, but negligible influence on T1 due to its insolubility.
Increased T1 and susceptibility values in the thalamus remain unexplained; we may speculate about myelin loss in this region.
Although the patients had lowered ceruloplasmin levels, we found no direct correlation between ceruloplasmin concentration and susceptibility values in deep gray matter suggesting that decreased ferroxidase activity is not causally related to increased cerebral iron levels.
Conclusion
Patients with a Wilson disease were subjected to quantitative MR measurement. It revealed decreased T2 relaxation times in the basal ganglia, higher susceptibility in the deep gray matter nuclei and no T1 changes, which indicates presence of insoluble para- or superparamagnetic compounds, presumably in a form of hemosiderin. These deposits appear not to be related to clinical severity.Acknowledgements
The study was supported by Ministry of Health, Czech Republic AZV:15-25602A and 00023001IKEM Institutional support.References
1. Fritzsch D et al. Invest Radiol 2014; 49(5):299-306.
2. Dusek P et al. Neuropathol Appl Neurobiol 2016; doi: 10.1111/nan.12341.
3. Herynek V et al. J Magn Reson Imaging 2012; 35(6):1332-7.
4. Parker DL et al. Magn Reson Med 2014; 72(2):563-9.
Figures