2328
Evaluation of PROspective MOtion correction on high-resolution 3D-FLAIR acquisitions in epilepsy patients1Translational Imaging Group, CMIC, University College London, London, United Kingdom, 2Epilepsy Society MRI Unit, Chalfont St Peter, United Kingdom, 3Neuroradiological Academic Unit, Department of Brain Repair and Rehabilitation, UCL Institute of Neurology, London, United Kingdom, 4Department of Radiology and Nuclear Medicine, VU University Medical Center, Amsterdam, Netherlands, 5Department of Clinical and Experimental Epilepsy, UCL Institute of Neurology, London, United Kingdom, 6Dementia Research Centre, UCL Institute of Neurology, London, United Kingdom
Synopsis
FLAIR is the single most sensitive MRI contrast to detect lesions underlying focal epilepsies but 3D sequences used to obtain isotropic high-resolution images are susceptible to motion. PROspective MOtion correction (PROMO) was applied to 3D-FLAIR scans in epilepsy patients to evaluate clinical benefit. Two radiologists reviewed 40 scans without and 80 with PROMO assessing six criteria on a seven-point Likert scale. PROMO scans can achieve near-identical image quality as nonPROMO scans, but intensity inhomogeneity was generally poor using PROMO. The percentage of scans with bad image quality was 4-fold lower with PROMO than without on the other five criteria.
Purpose
To evaluate the clinical benefit of prospective motion correction on high-resolution 3D-FLAIRIntroduction
The primary purpose of MRI in epilepsy patients is to detect the epileptogenic lesions. FLAIR is the single most sensitive contrast in epilepsy lesion detection1-3 but the 3D sequences used to obtain isotropic high-resolution images4,5 are susceptible to subject motion as a result of the relatively long scan time. PROspective MOtion correction (PROMO) is an image-based method that tracks a subject’s head during the scan, rearranging the field-of-view (FOV) accordingly, thereby reducing motion artefacts6,7. PROMO has been demonstrated to improve 3D-T1 image quality in a pediatric population8. Here, we evaluate the clinical benefit to high-resolution 3D-FLAIR scans in epilepsy patients.Methods
Acquisition: 3D-FLAIR scans were acquired on a 3 T GE MR750 scanner with a 32-channel head coil. The 3D FSE CUBE sequence was used with FOV of 224×256×256 mm (AP×IS×RL) and an acquisition matrix of 224×256×256 for a 1 mm isotropic resolution. ARC acceleration of 2×2 (RL×AP). Sequence timings include TR/TI/TE = 6200/1882/137 ms and an echo train length of 150 for a scan time of 7m17s. PROMO6,7 tracks head motion using three perpendicular 2D spiral navigators acquired between the end of the readout and the inversion pulse for the next excitation. These navigators were used immediately to detect rigid-body head motion to reorient the FOV accordingly. Integrating the navigators changes sequence timings: TI/TE = 1870/142 ms, scan time of 7m24s. Strongly corrupted segments of k-space are reacquired, with a maximum of 180 seconds added. Intensity inhomogeneity from multi-channel coils can be corrected in two ways on GE scanners: using a prescan calibration (PURE, Phased-array UnifoRmity Enhancement), or image-based (SCIC, Surface Coil Intensity Correction - similar to N39). Mismatches between PURE calibration and PROMO-reoriented FOV could cause a deterioration in overall image quality.
Population: Three groups were defined: 1) 3D-FLAIR without PROMO, with PURE; 2) PROMO 3D-FLAIR with SCIC; 3) PROMO 3D-FLAIR with PURE. Group 1 (nonPROMO) is the department’s routine 3D-FLAIR; group 2 (PROMO+SCIC) and 3 (PROMO+PURE) were included to check performance of PROMO independently of inhomogeneity correction. Each group consisted of 40 subjects scanned consecutively in routine clinical practice. Mean age was 40.8 years old (range 17-78y, 56M/64F), no differences between groups (ANOVA p=0.66).
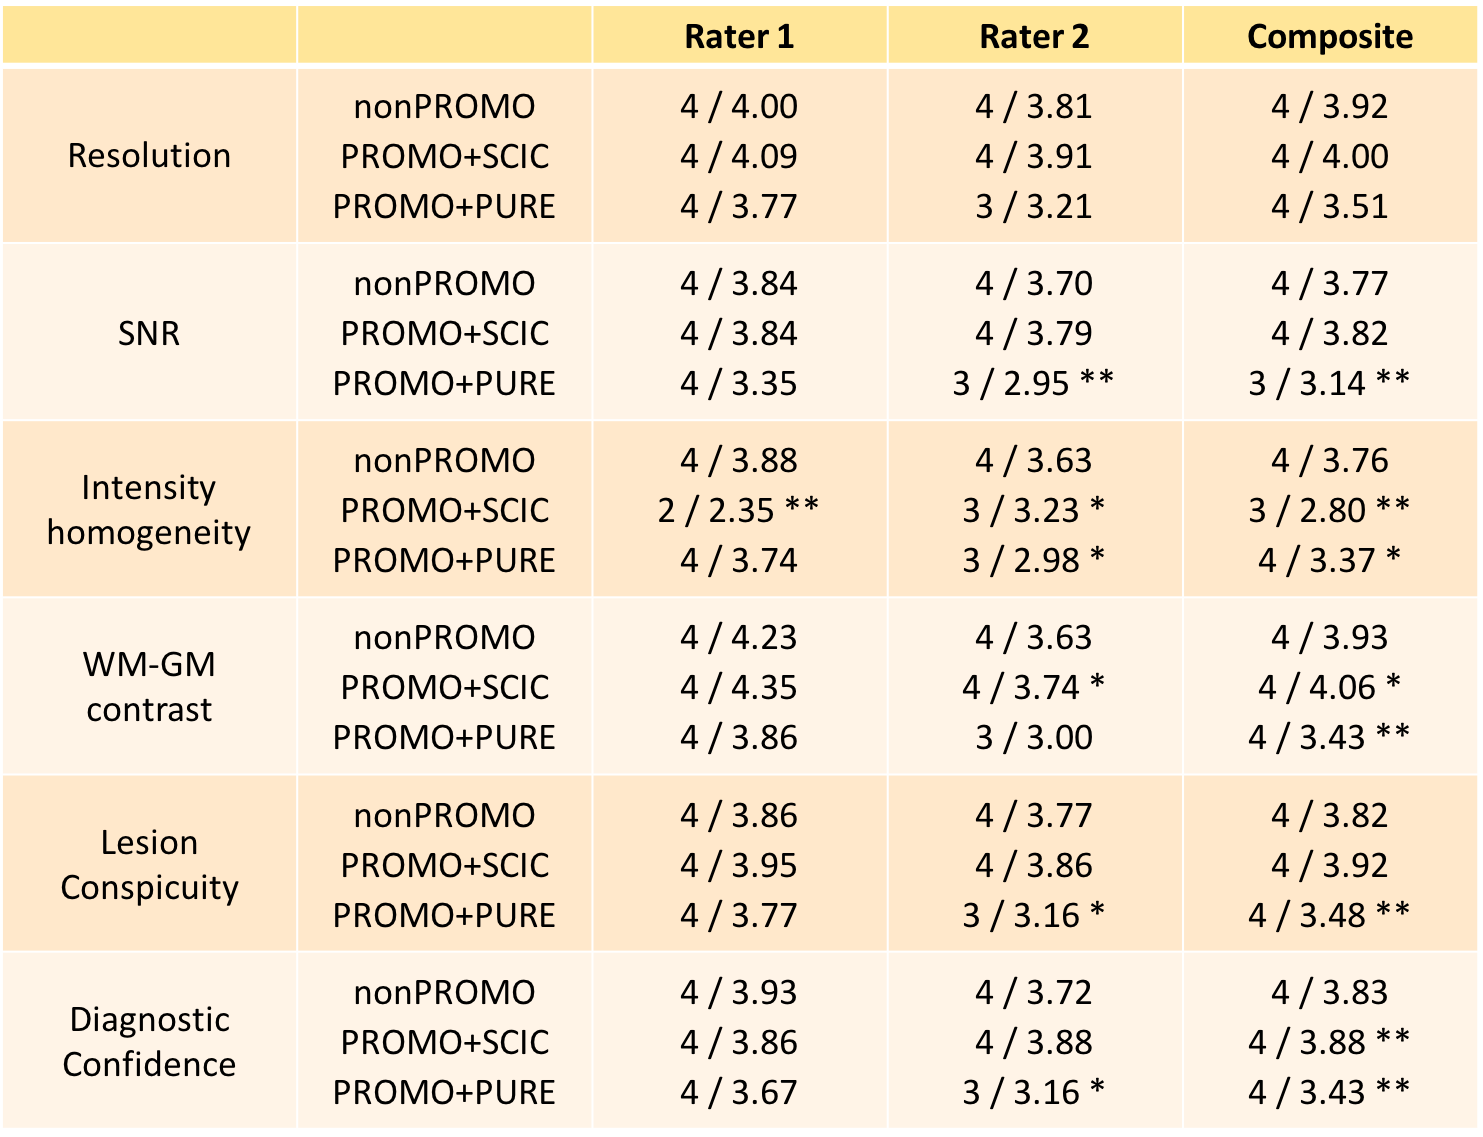
Evaluation: Image quality was scored independently by two experienced radiologists on six criteria: resolution, SNR, intensity homogeneity, white-grey matter (WM-GM) contrast, lesion conspicuity, and diagnostic confidence. A seven-point Likert scale (1=non-diagnostic, 2=poor, 3=acceptable, 4=standard, 5=above average, 6=good, 7=outstanding) was used to rate each criterion. The three groups of scans were randomized and reviewed by both raters in three separate sessions. Statistical evaluation was performed using the chi-squared test for categorical data.
Results
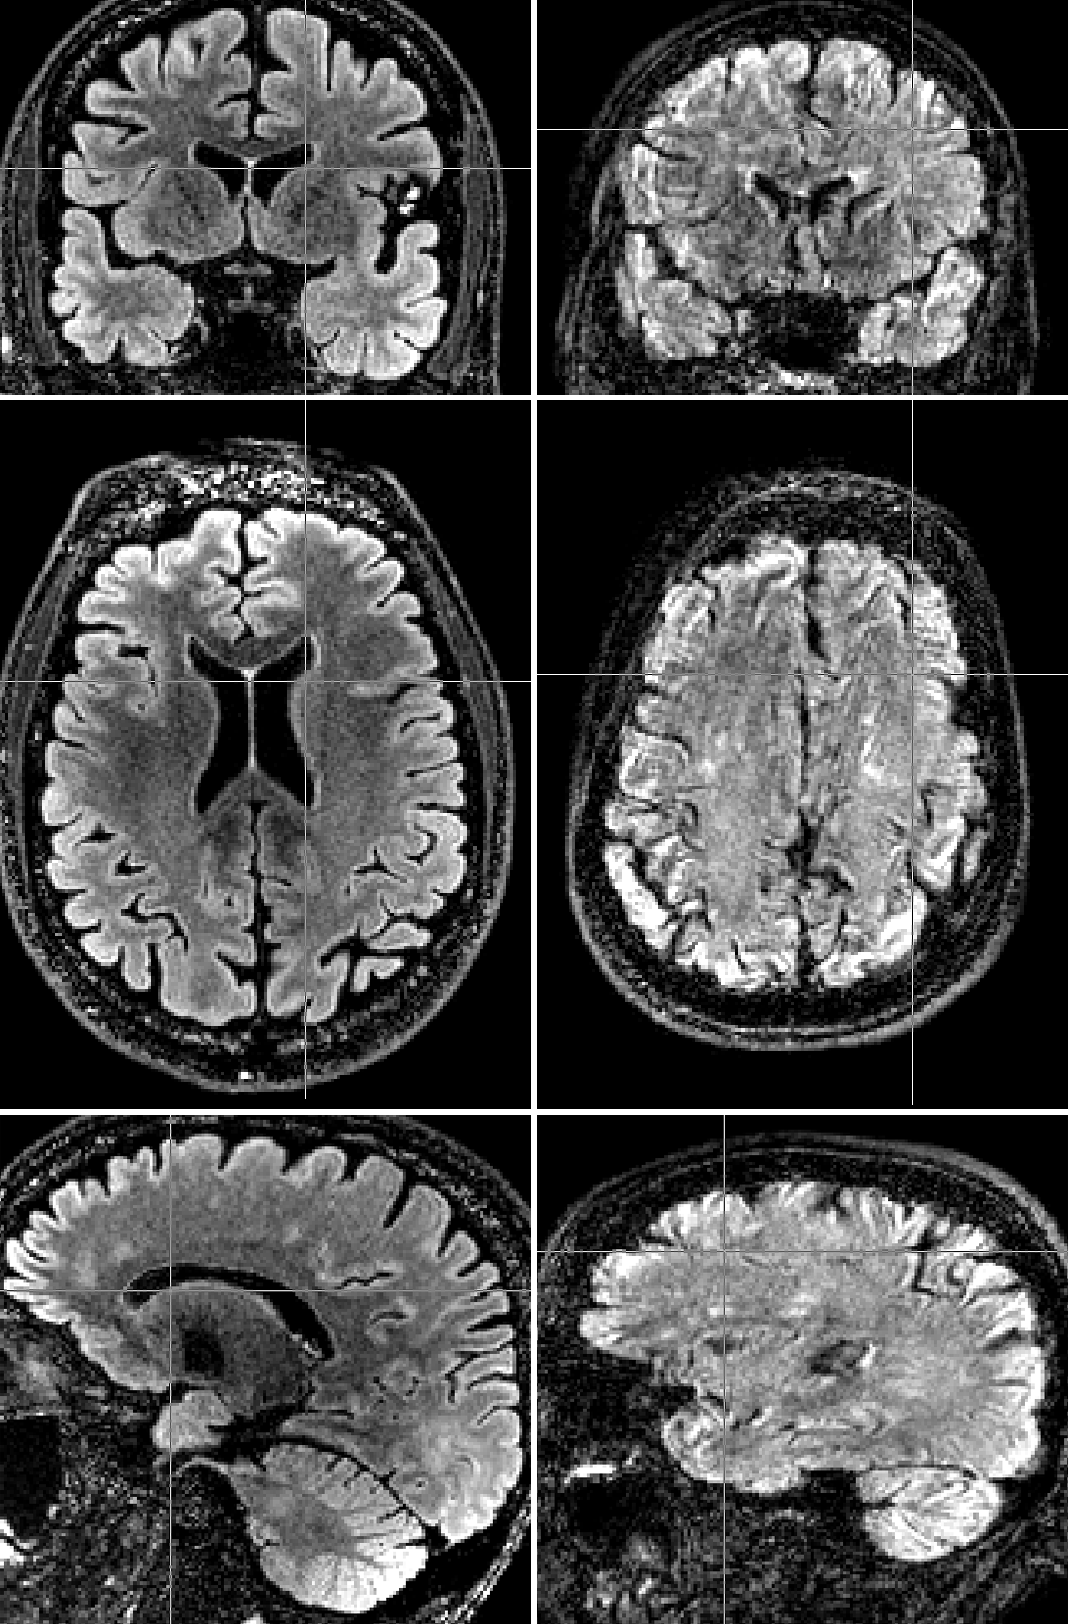
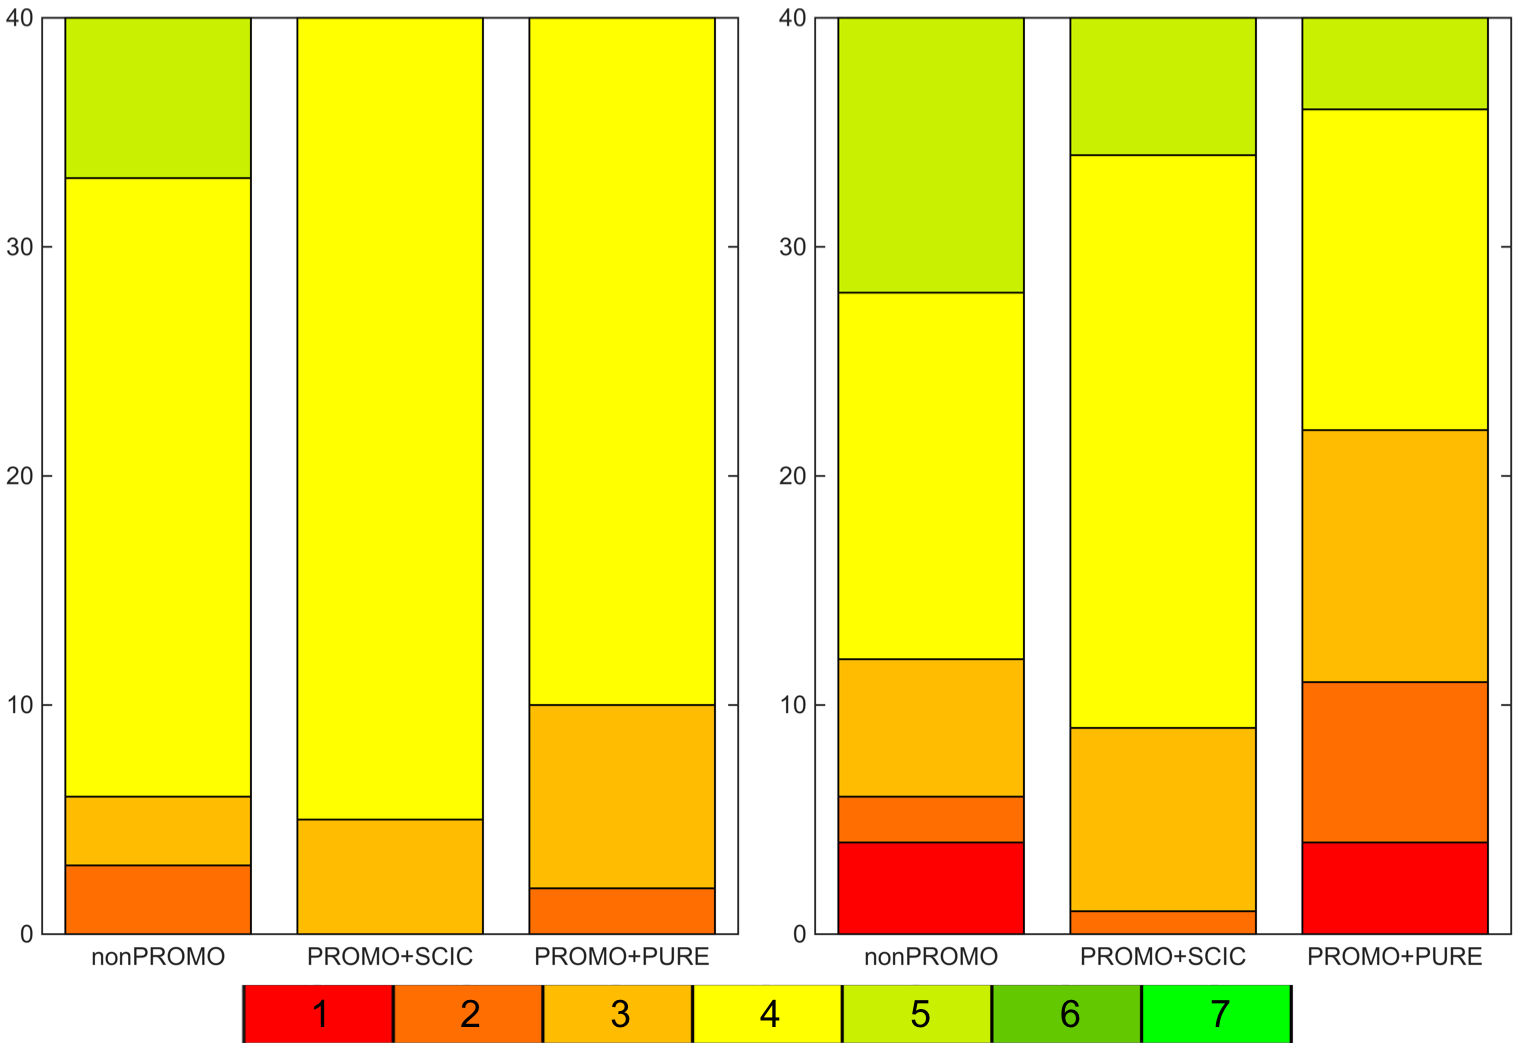
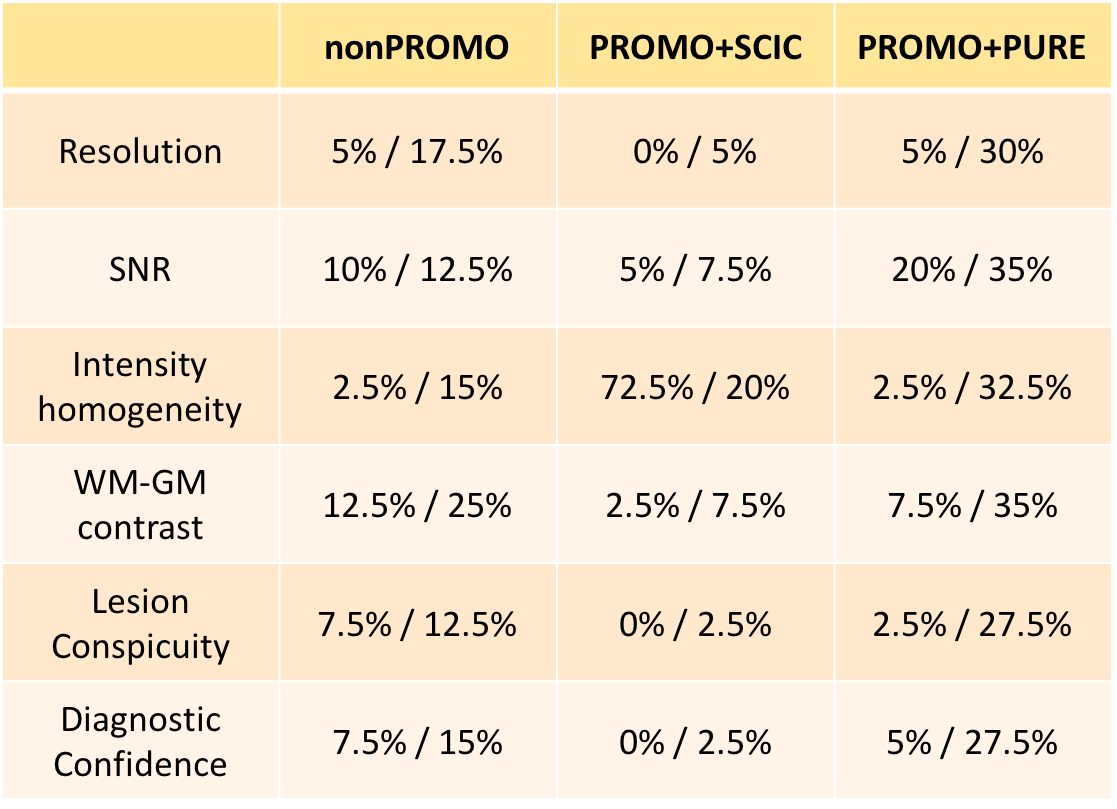
An example of the best-scoring and worst-scoring scans from nonPROMO are shown in Fig. 1 to illustrate the range of image quality and motion-induced image corruption. PROMO+SCIC scans had near-identical image quality as nonPROMO scans (Table 1) - except that intensity homogeneity was poor on PROMO+SCIC scans, as SCIC is inferior to PURE. PROMO+PURE was significantly worse than nonPROMO on all criteria (Table 1). The chi-squared test quantifies difference between two sets of histograms, without informing which would be better. Given that the mean of categorical variables is not necessarily informative (the differences between categories are not necessarily equal) the mean values should be interpreted with care, as for instance through cumulative histograms of the ratings (Fig. 2). Conceptually, motion-correction should reduce the number of - heavily - motion corrupted scans, which is confirmed by a lower percentage of scans with bad image quality (non-diagnostic/poor) with PROMO+SCIC than without on all individual criteria except intensity inhomogeneity (Table 2), for an average over 1.5% / 5% (PROMO+SCIC) vs. 8.5% / 16.5% (nonPROMO) without inhomogeneity, for the two raters. Added scan-time for PROMO-scans was 30 seconds on average, with 45% having no additional scan time and a few cases the maximum 180 seconds. Classifying those scans scoring 1 or 2 on diagnostic quality as requiring repeat scans, the overall average scan time is very similar between nonPROMO (including repeats) and PROMO+SCIC (including reacquisition): 8m6s vs. 8m0s.Discussion
Image-based prospective motion correction (PROMO) on 3D-FLAIR sequences decreases the percentage of low-quality scans - reducing the number of scans to be repeated, keeping in mind that repeat scans do not often yield high-quality scans either. Intensity inhomogeneity on PROMO scans, however, is a potential confound in reviewing reformatted images - something that is strongly recommended for epilepsy scans.Acknowledgements
We are grateful to GE Healthcare for trialing and support in using PROMO. SBV is funded by the National Institute for Health Research University College London Hospitals Biomedical Research Centre (NIHR BRC UCLH/UCL High Impact Initiative). We are grateful to the Wolfson Foundation and the Epilepsy Society for supporting the Epilepsy Society MRI scanner.
References
[1] P.M. Ruggieri et al., Neurology 2004; [2] G.D. Jackson & R.A.B. Badawy, Epilepsy & Behavior 2011; [3] J. Wellmer et al., Epilepsia 2013; [4] K. Deblaere & E. Achten, Eur. Radiol. 2008; [5] N. Lummel et al., AJNR 2013; [6] Shankaranarayanan et al., ISMRM 2008, p1475; [7] N. White et al., MRM 2010; [8] J.M. Kuperman et al., Pediatr. Radiol. 2011; [9] J.G. Sled et al., IEEE TMI 1998Figures