2325
Autosomal dominant cerebellar ataxia: The search for imaging biomarkers1INSERM U 1127, CNRS UMR 7225, Sorbonne Universités, UPMC Univ Paris 06 UMR S 1127, Institut du Cerveau et de la Moelle épinière, ICM, F-75013, Paris, France, 2Center for Magnetic Resonance Research, University of Minnesota, Minneapolis, MN, United States, 3Center for NeuroImaging Research, Institut du Cerveau et de la Moelle épinière, 75013 Paris, France
Synopsis
Spinocerebellar ataxias (SCAs) are neurodegenerative disorders characterized by predominant atrophy of the cerebellum and pons, with the main symptom being ataxia. There is currently no treatment for this disorder due to the lack of robust biomarkers to evaluate the disease progression. This study aimed to identify robust biomarkers for this disorder using a combination of magnetic resonance spectroscopy and imaging techniques. This study confirmed neurometabolic alterations in SCAs as well as microstructural modifications resulting from the disease. This study also showed that imaging biomarkers are more sensitive to disease progression than clinical scores.
Purpose
Spinocerebellar ataxias (SCAs) 1, 2, 3 and 7 belong to the group of polyglutamine repeat disorders. They are autosomal dominant disorders characterized by predominant atrophy of the cerebellum and the pons that begins several years before the onset of motor symptoms.1 As gene-based therapeutic approaches are being developed in SCA, it becomes increasingly important to identify readouts for trials with sufficient effect sizes. Clinical scores are useful, but insufficient, and a single biomarker is likely to fail reflecting the complexity of the neurodegenerative cascades leading to the onset and progression of SCA.2 This study was therefore designed to identify magnetic resonance imaging/spectroscopy markers with strong effect sizes in view of therapeutic development.Methods
We assessed longitudinal data at baseline and 24 months for clinical scores, SARA (scale for the assessment and rating of ataxia) and brain volumetry. The brain images were segmented manually by hand and automatically using Freesurfer.3 Segmentation of the pons was based on probabilistic atlas and Bayesian inference implemented in Freesurfer.4 Atrophy was calculated as the volume change relative to baseline and normalized by the time between visits.
Diffusion imaging was performed at 24 months to assess fiber integrity at b value of 1500 s/mm2 (slice thickness= 2 mm isotropic, 128 x 128 matrix, FOV= 256, 60 directions). The directions were interleaved with five b0 after every 12 directions and another b0 with opposite phase-encode blip were acquired for eddy current and distortion correction using FMRIB Software Library (http://fsl.fmrib.ox.ac.uk/fsl/). The data were fitted to generate diffusion metrics including fractional anisotropy (FA) and radial diffusivity (RD) maps. Tract-based spatial statistics (TBSS)5 were performed on the diffusion metrics including FA and RD and statistical tests were performed using fsl randomize.
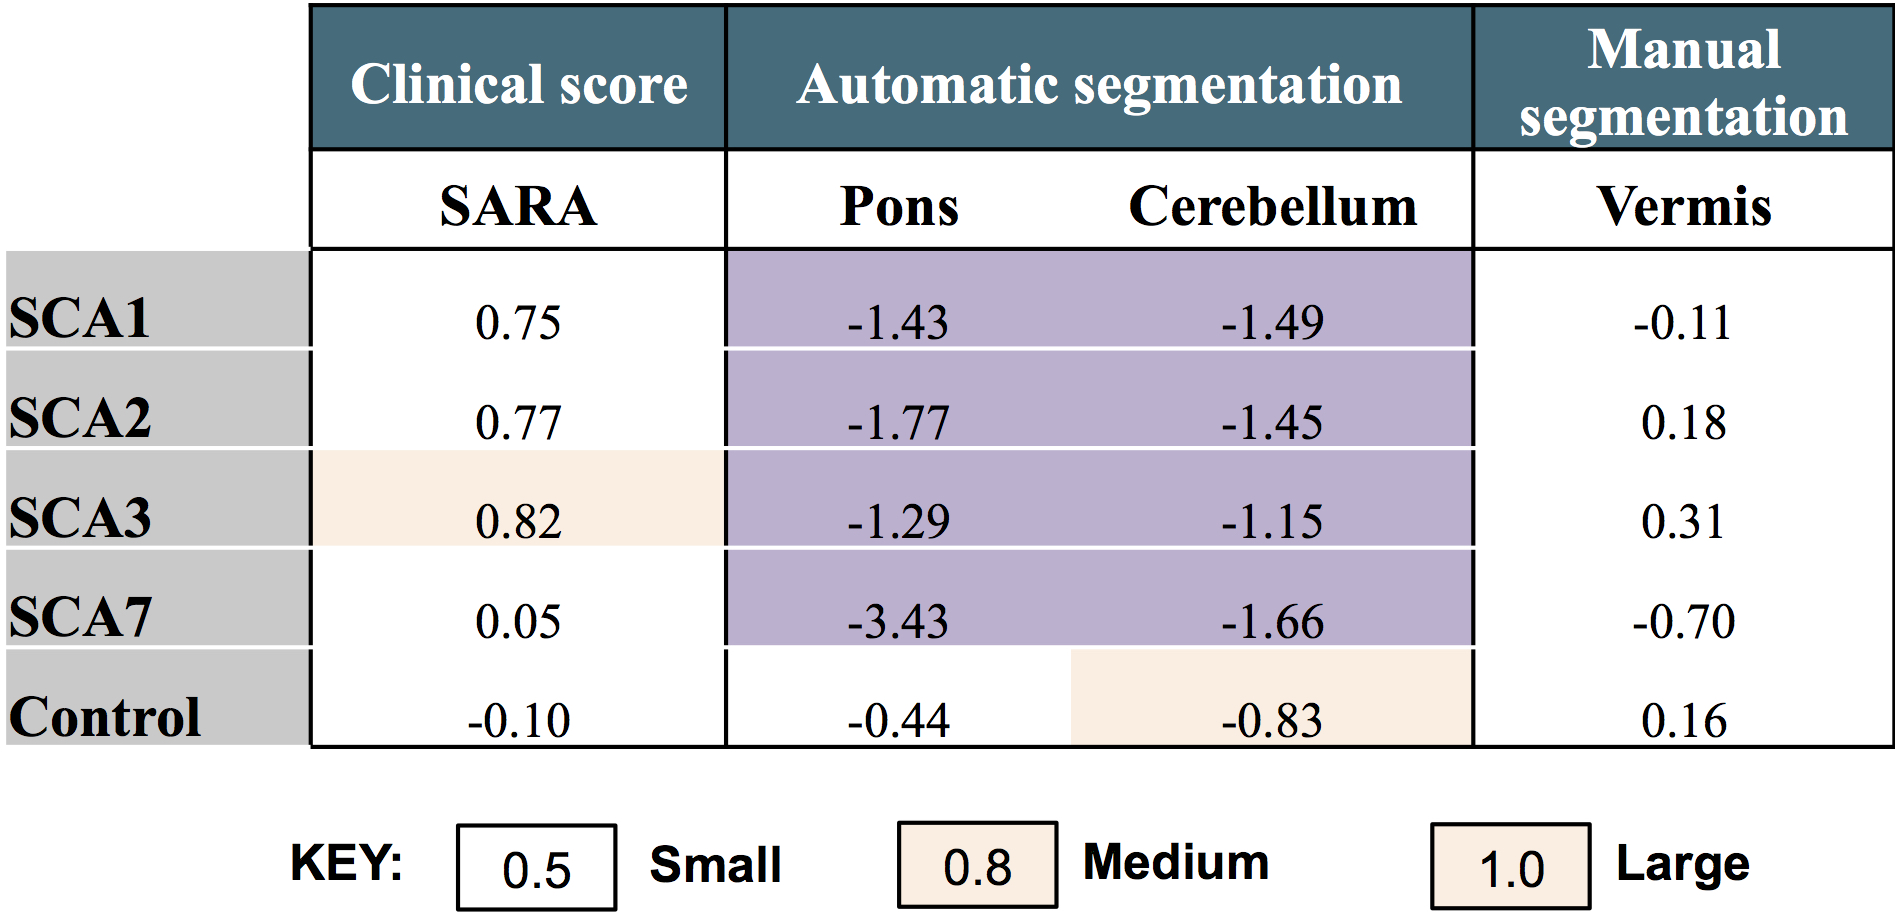
We calculated the effect size for clinical scores, manual segmentation and Freesurfer segmentation as the mean change to the standard deviation of the change.6
We also performed proton magnetic resonance spectroscopy (1H MRS) using an optimized semi-LASER protocol7 (TR= 5000 ms, TE= 28 ms, 64 averages) at 3T in the cerebellar vermis (25 x 16 x 25 mm3) and pons (16 x 16 x 16 mm3) of SCA patients (SCA1, n= 14; SCA2, n= 12; SCA3, n= 19; SCA7, n= 10) and healthy controls (n= 24). Two unsuppressed water spectra were acquired for eddy current correction and as reference for metabolite quantification. Metabolites were quantified with LCModel as explained.8
Results and Discussion
Patients showed a significant increase in SARA scores (p<0.05) which reflects a decrease in motor function (Figure 1).
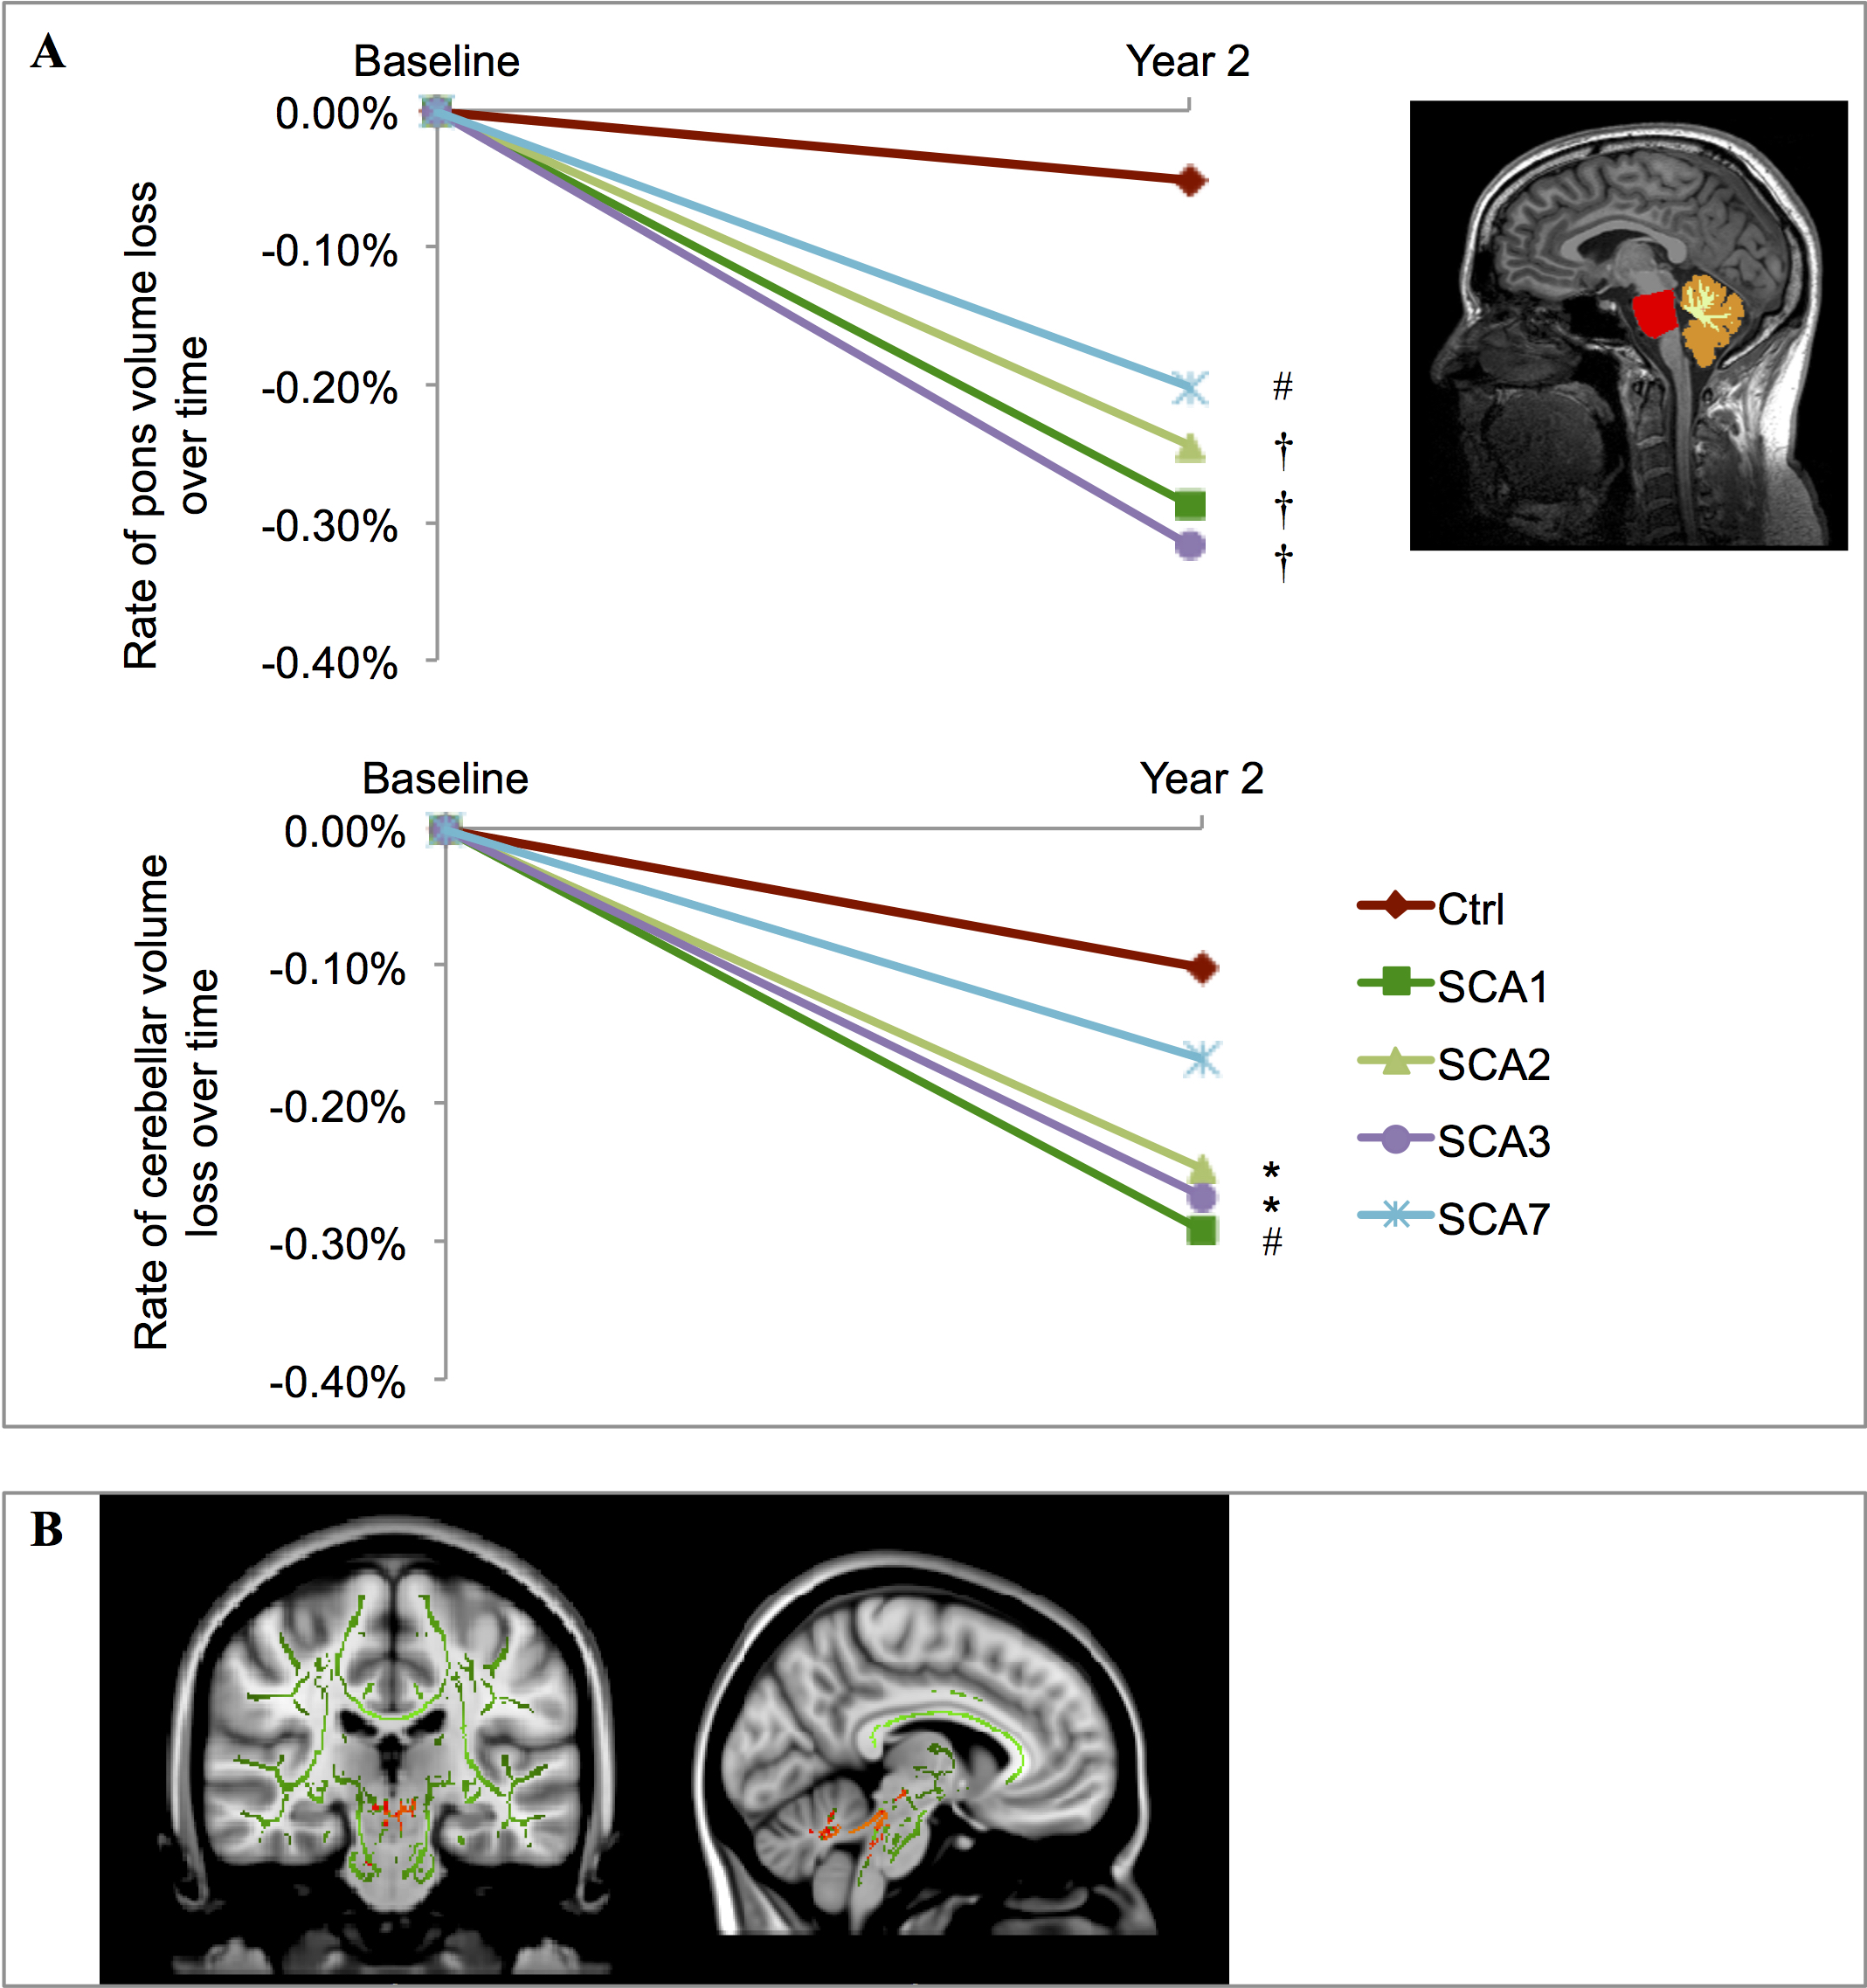
TBSS revealed decreased FA in the corticospinal tract, cerebellum and brainstem in SCAs 1 and 2 (p<0.05). Decreased FA was also observed in the inferior and superior longitudinal fasciculus and the corpus callosum in SCA2 (p<0.05). In SCA3, decreased FA was localized to the brainstem, cerebellum and the cerebral peduncle. There was however no change in FA in SCA7 possibly due to the early disease stage of SCA7 patients (Figure 2a). Increased RD, which reflects changes in axonal diameters, density or demyelination, was observed in the cerebellum, brainstem and cerebral peduncles in all SCAs (p<0.05). There was also an increased RD in the corona radiata in SCA1, and the corticospinal tract, longitudinal fasciculus and corpus callosum in SCA2 (p<0.05) (Figure 2b). These changes in FA and RD reflect alterations of the white matter microstructure due to the disease.
Freesurfer segmentation of the pons and cerebellum showed that there was a significant decrease in brain volume over time with the rate of decrease significantly faster in SCAs than controls (Figure 3a). We also showed that FA correlated strongly with atrophy in the cerebellum and brainstem of SCA1 patients (Figure 3b).
Effect sizes calculated from the data collected showed that automatic segmentation of brain volumes is far superior to manual segmentation. This is because the poor contrast between subcortical structures makes it difficult to reliably segment structures such as the pons manually, and inter- and intra-rater variability introduces bias to the results (Figure 4).
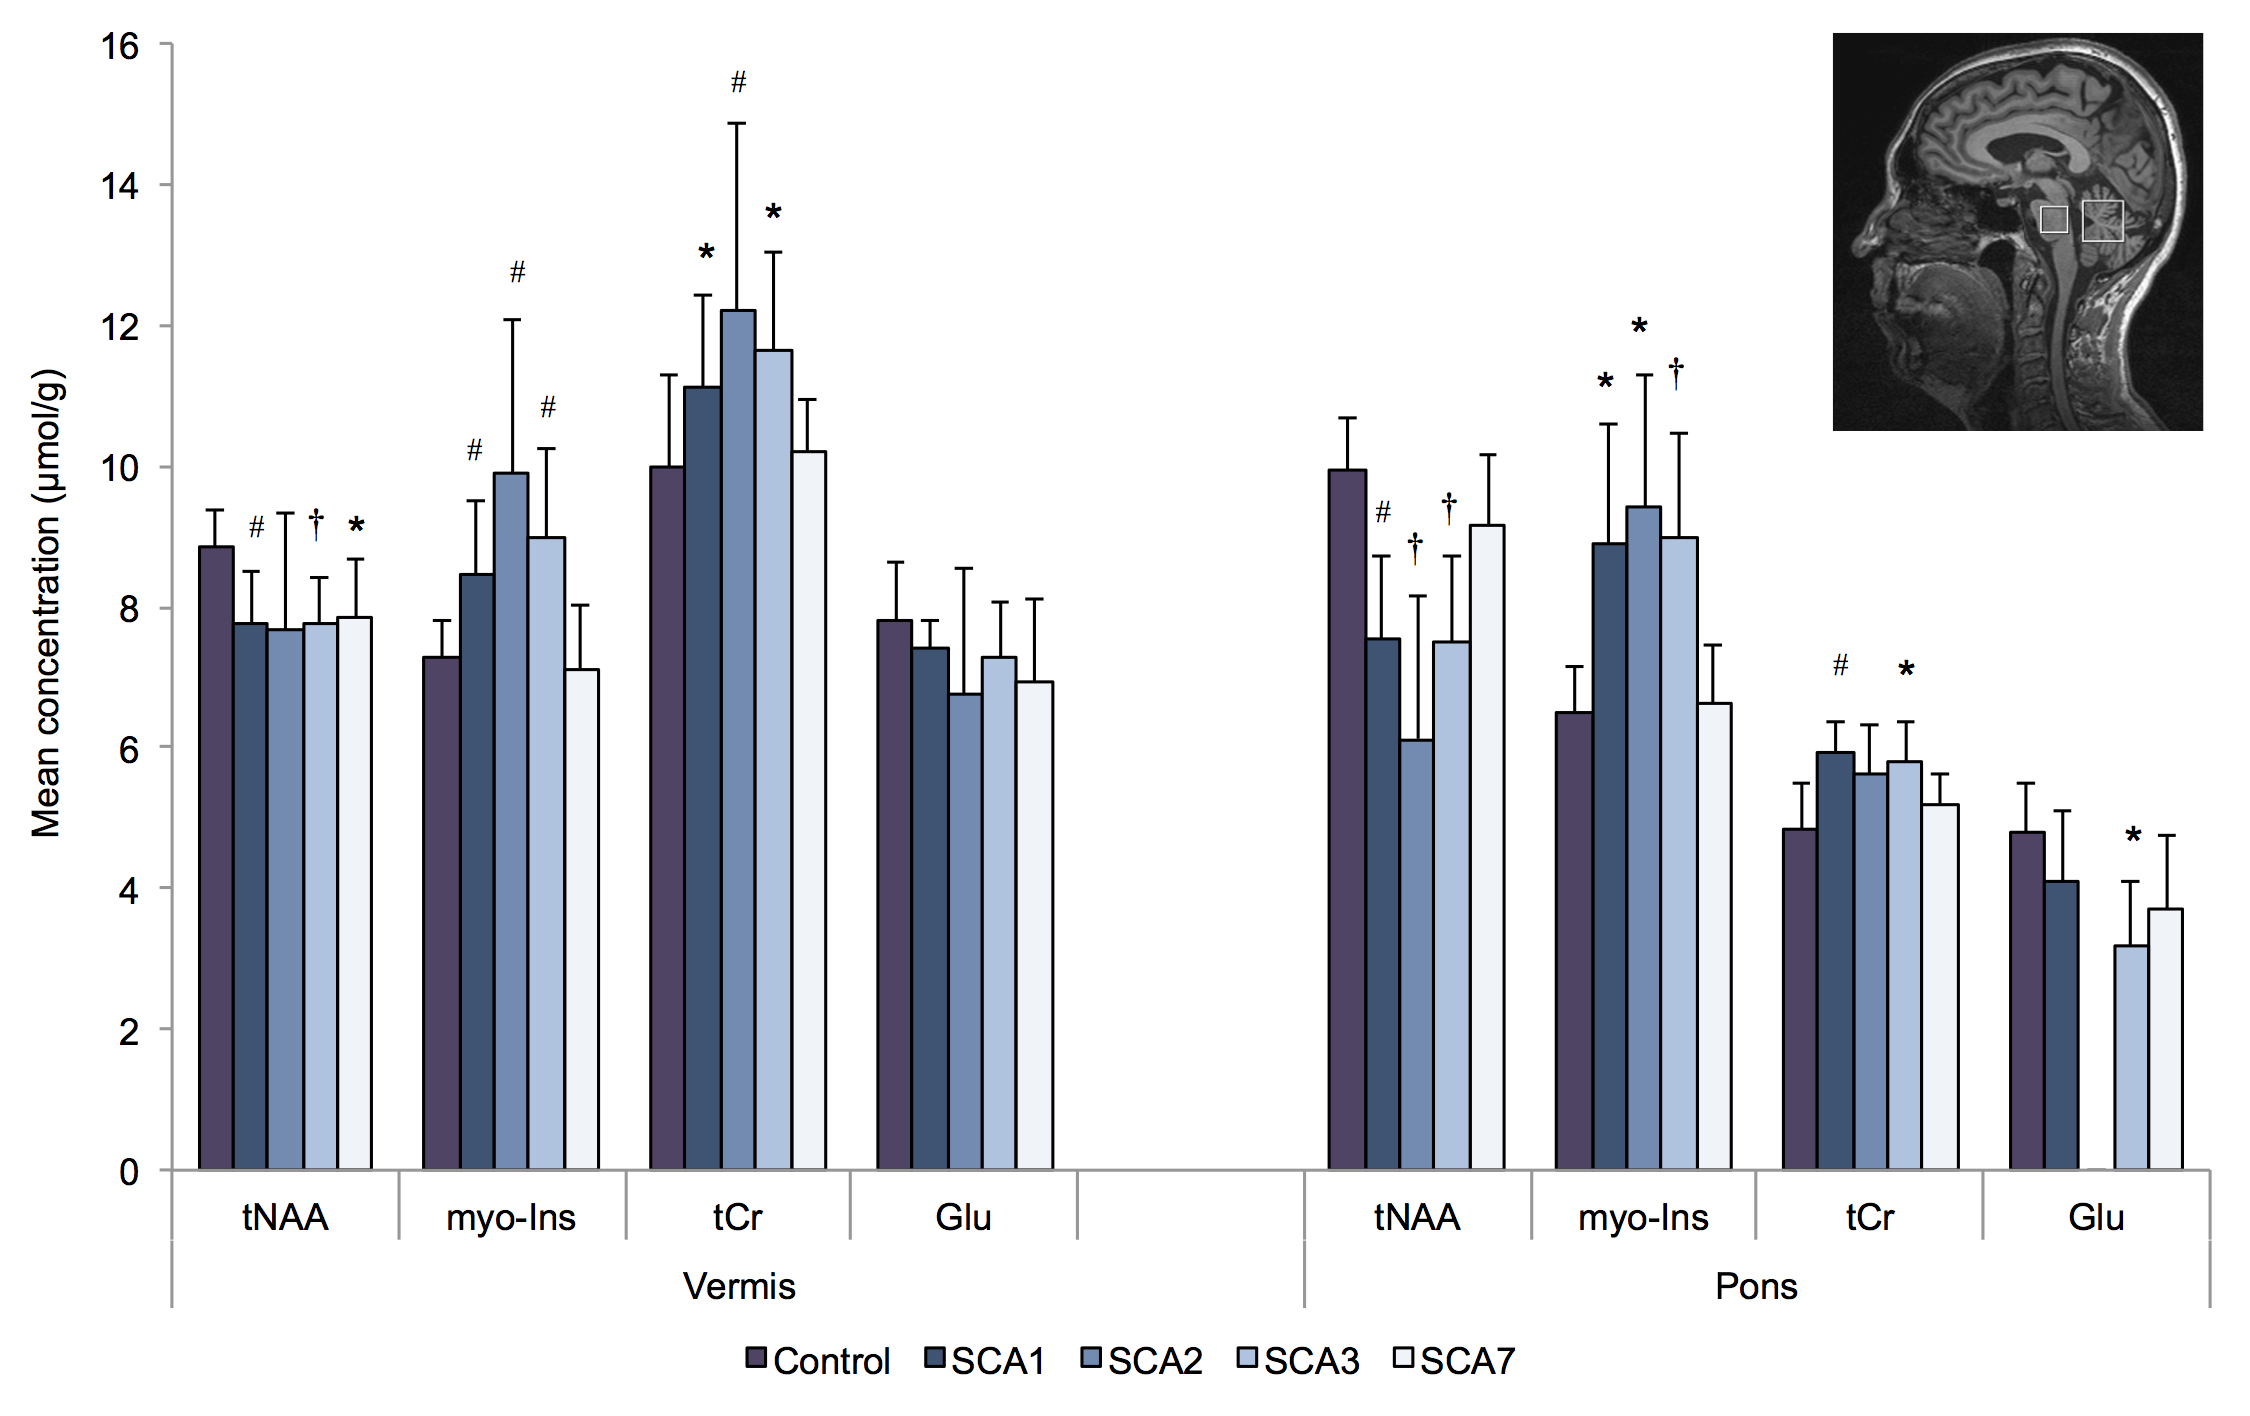
We also observed neurochemical alterations in SCAs with decreased neuronal markers, N-acetylaspartate and glutamate, which reflect neuronal loss. The glial marker, myo-Inositol, and energetic maker, total creatine, were elevated in patients which may signify glial or energy compensation in response to the atrophy (Figure 5).
Conclusion
MRI/MRS provides a unique opportunity to assess information related to cell-specific changes in neurometabolites and brain microstructure which otherwise could not be assessed by other clinical scores. Having a strong effect size, imaging markers could be used in clinical trials with fewer patients making clinical trials in these rare disorders feasible.Acknowledgements
We are very grateful to the patients and volunteers who participated in this study. We will also like to thank the Centre d’Investigation Clinique Pitié Neurosciences, CIC-1422, Département des Maladies du Système Nerveux, Hôpital Pitié-Salpêtrière, Paris, France and the Programme hospitalier de recherche clinique (PHRC), France.References
1. Jacobi H, Reetz K, du Montcel ST, et al. Biological and clinical characteristics of individuals at risk for spinocerebellar ataxia types 1, 2, 3, and 6 in the longitudinal RISCA study: analysis of baseline data. Lancet Neurol. 2013;12:650-658.
2. Saute JA, Donis KC, Serrano-Munuera C, et al. Ataxia rating scales: psychometric profiles, natural history and their application in clinical trials. Cerebellum 2012;11:488-504.
3. Fischl B, Salat DH, Busa E, et al. Whole brain segmentation: automated labeling of neuroanatomical structures in the human brain. Neuron 2002;33:341-355.
4. Iglesias JE, Van Leemput K, Bhatt P, et al. Alzheimer's disease neuroimaging initiative. Bayesian segmentation of brainstem structures in MRI. NeuroImage 2015;113:184-195.
5. Smith MS, Jenkinson M, Johansen-Berg H, et al. Tract-based spatial statistics: Voxelwise analysis of multi-subject diffusion data. NeuroImage 2006;31(4):1487-1505.
6. Reetz K, Costa AS, Mirzazade S. Genotype-specific patterns of atrophy progression are more sensitive than clinical decline in SCA1, SCA3 and SCA6. Brain 2013:136;905-917.
7. Öz G, Tkàc I. Short-echo, single-shot, full-intensity proton magnetic resonance spectroscopy for neurochemical profiling at 4 T: Validation in the cerebellum and brainstem. Magn Reson Med. 2011;65:901-910.
8. Adanyeguh IM, Henry PG, Nguyen TM, et al. In vivo neurometabolic profiling in patients with spinocerebellar ataxia types 1, 2, 3, and 7. Mov Disord. 2015;30(5):662-670.
Figures