2324
Region-specific damage in Progressive Supranuclear Palsy studied using multimodal quantitative MRI1Neuroradiology department, APHP, Pitié Salpêtrière, Paris, France, 2UPMC Univ Paris 06, UMR S 1127, CNRS UMR 7225, ICM, F-75013, Sorbonne Universités, Paris, France, 3Centre de NeuroImagerie de Recherche – CENIR, ICM, Paris, France, 4Clinique des mouvements anormaux, Département des Maladies du Système Nerveux, Hôpital Pitié-Salpêtrière, APHP, Paris, France, 5Service des pathologies du Sommeil, Hôpital Pitié-Salpêtrière, APHP, Paris, France, 6NeuroSpin, CEA, Gif-Sur-Yvette, France
Synopsis
We used quantitative multimodal MRI to investigate the region-specific damage in progressive supranuclear palsy (PSP) in order to generate a precise model of neurodegeneration at various levels of the central nervous system, including brainstem nuclei, basal ganglia and cortex. PSP patients showed extensive volume decrease and microstructural diffusion changes in the brainstem and the basal ganglia in agreement with previous pathological studies. These results suggest the possibility of direct noninvasive assessment of brain damage in PSP not only in the basal ganglia and the cortex, as done previously, but also in small brainstem nuclei.
Purpose
Progressive supranuclear palsy (PSP) is a heterogeneous neurodegenerative disorder characterized clinically by a varying combination of motor and non-motor symptoms,1 and histologically by neuronal and glial depositions of abnormally phosphorylated tau protein in the basal ganglia, diencephalon, brainstem with limited involvement of the neocortex.2 Areas most involved included the globus pallidus, nucleus basalis of Meynert (NBM), subthalamic nucleus (STN), midbrain, including substantia nigra (SN), superior colliculus, nuclei cuneiformis and pons including pontine tegmentum and pedunculopontine nucleus (PPN).2-3 In contrast, there was no damage in hippocampus or amygdala.2-4 While the formal diagnosis is possible only in postmortem studies, it can be challenging in the absence of reliable, disease-specific biomarkers.1,3 Previous MRI studies have observed volume decrease and diffusion imaging changes in PSP patients in some of the above regions, including mostly the basal ganglia and the mesencephalon.5-6 Here, we studied whether multimodal quantitative MRI was able to detect region-specific damage as it was observed in pathology studies. In addition, we aimed to test the diagnostic accuracy of these markers.Materials and methods
Subjects: Eleven patients with PSP (mean age: 61.7±7.8 years, 5 males, disease duration: 3.8±1.5 years) were compared with 26 age-matched healthy controls (HC) (age 60.8±8.3 years, 12 males). Clinical examination included the Unified Parkinson’s Disease Rating Scale and extensive neuropsychological assessment.
MRI data acquisition: MRI acquisition was performed using a 3 Tesla TRIO TIM system (Siemens, Erlangen, Germany) using a 12-channel receive-only head coil. The protocol included three-dimensional (3D) T1-weighted (T1-w) images, 3D T2-weighted (T2-w) images, DTI and R2* mapping. NM-sensitive images were acquired using two-dimensional (2D) axial turbo spin echo T1-w images (TR/TE/flip angle: 900ms/15ms/180°, voxel size: 0.4*0.4*3mm3, 3 averages). The DTI parameters were as following: TR/TE/flip angle =14000ms/101ms/90°, voxel size = 1.7*1.7*1.7mm3, b-value=1500s/mm2, 60 diffusion gradients directions). R2* mapping was computed using a gradient-echo planar sequence with 6 TEs (range, 24-94 ms), TR/flip angle: 9000 ms/90° and voxel size: 2*2*2 mm3. T2*-w high-resolution images were also acquired at 7 Tesla with the following parameters: TR/TE/flip angle: 2180ms/29.9ms/65°, field of view: 192 mm2, voxel size of 0.5x0.5x0.5 mm3, 40 slices.
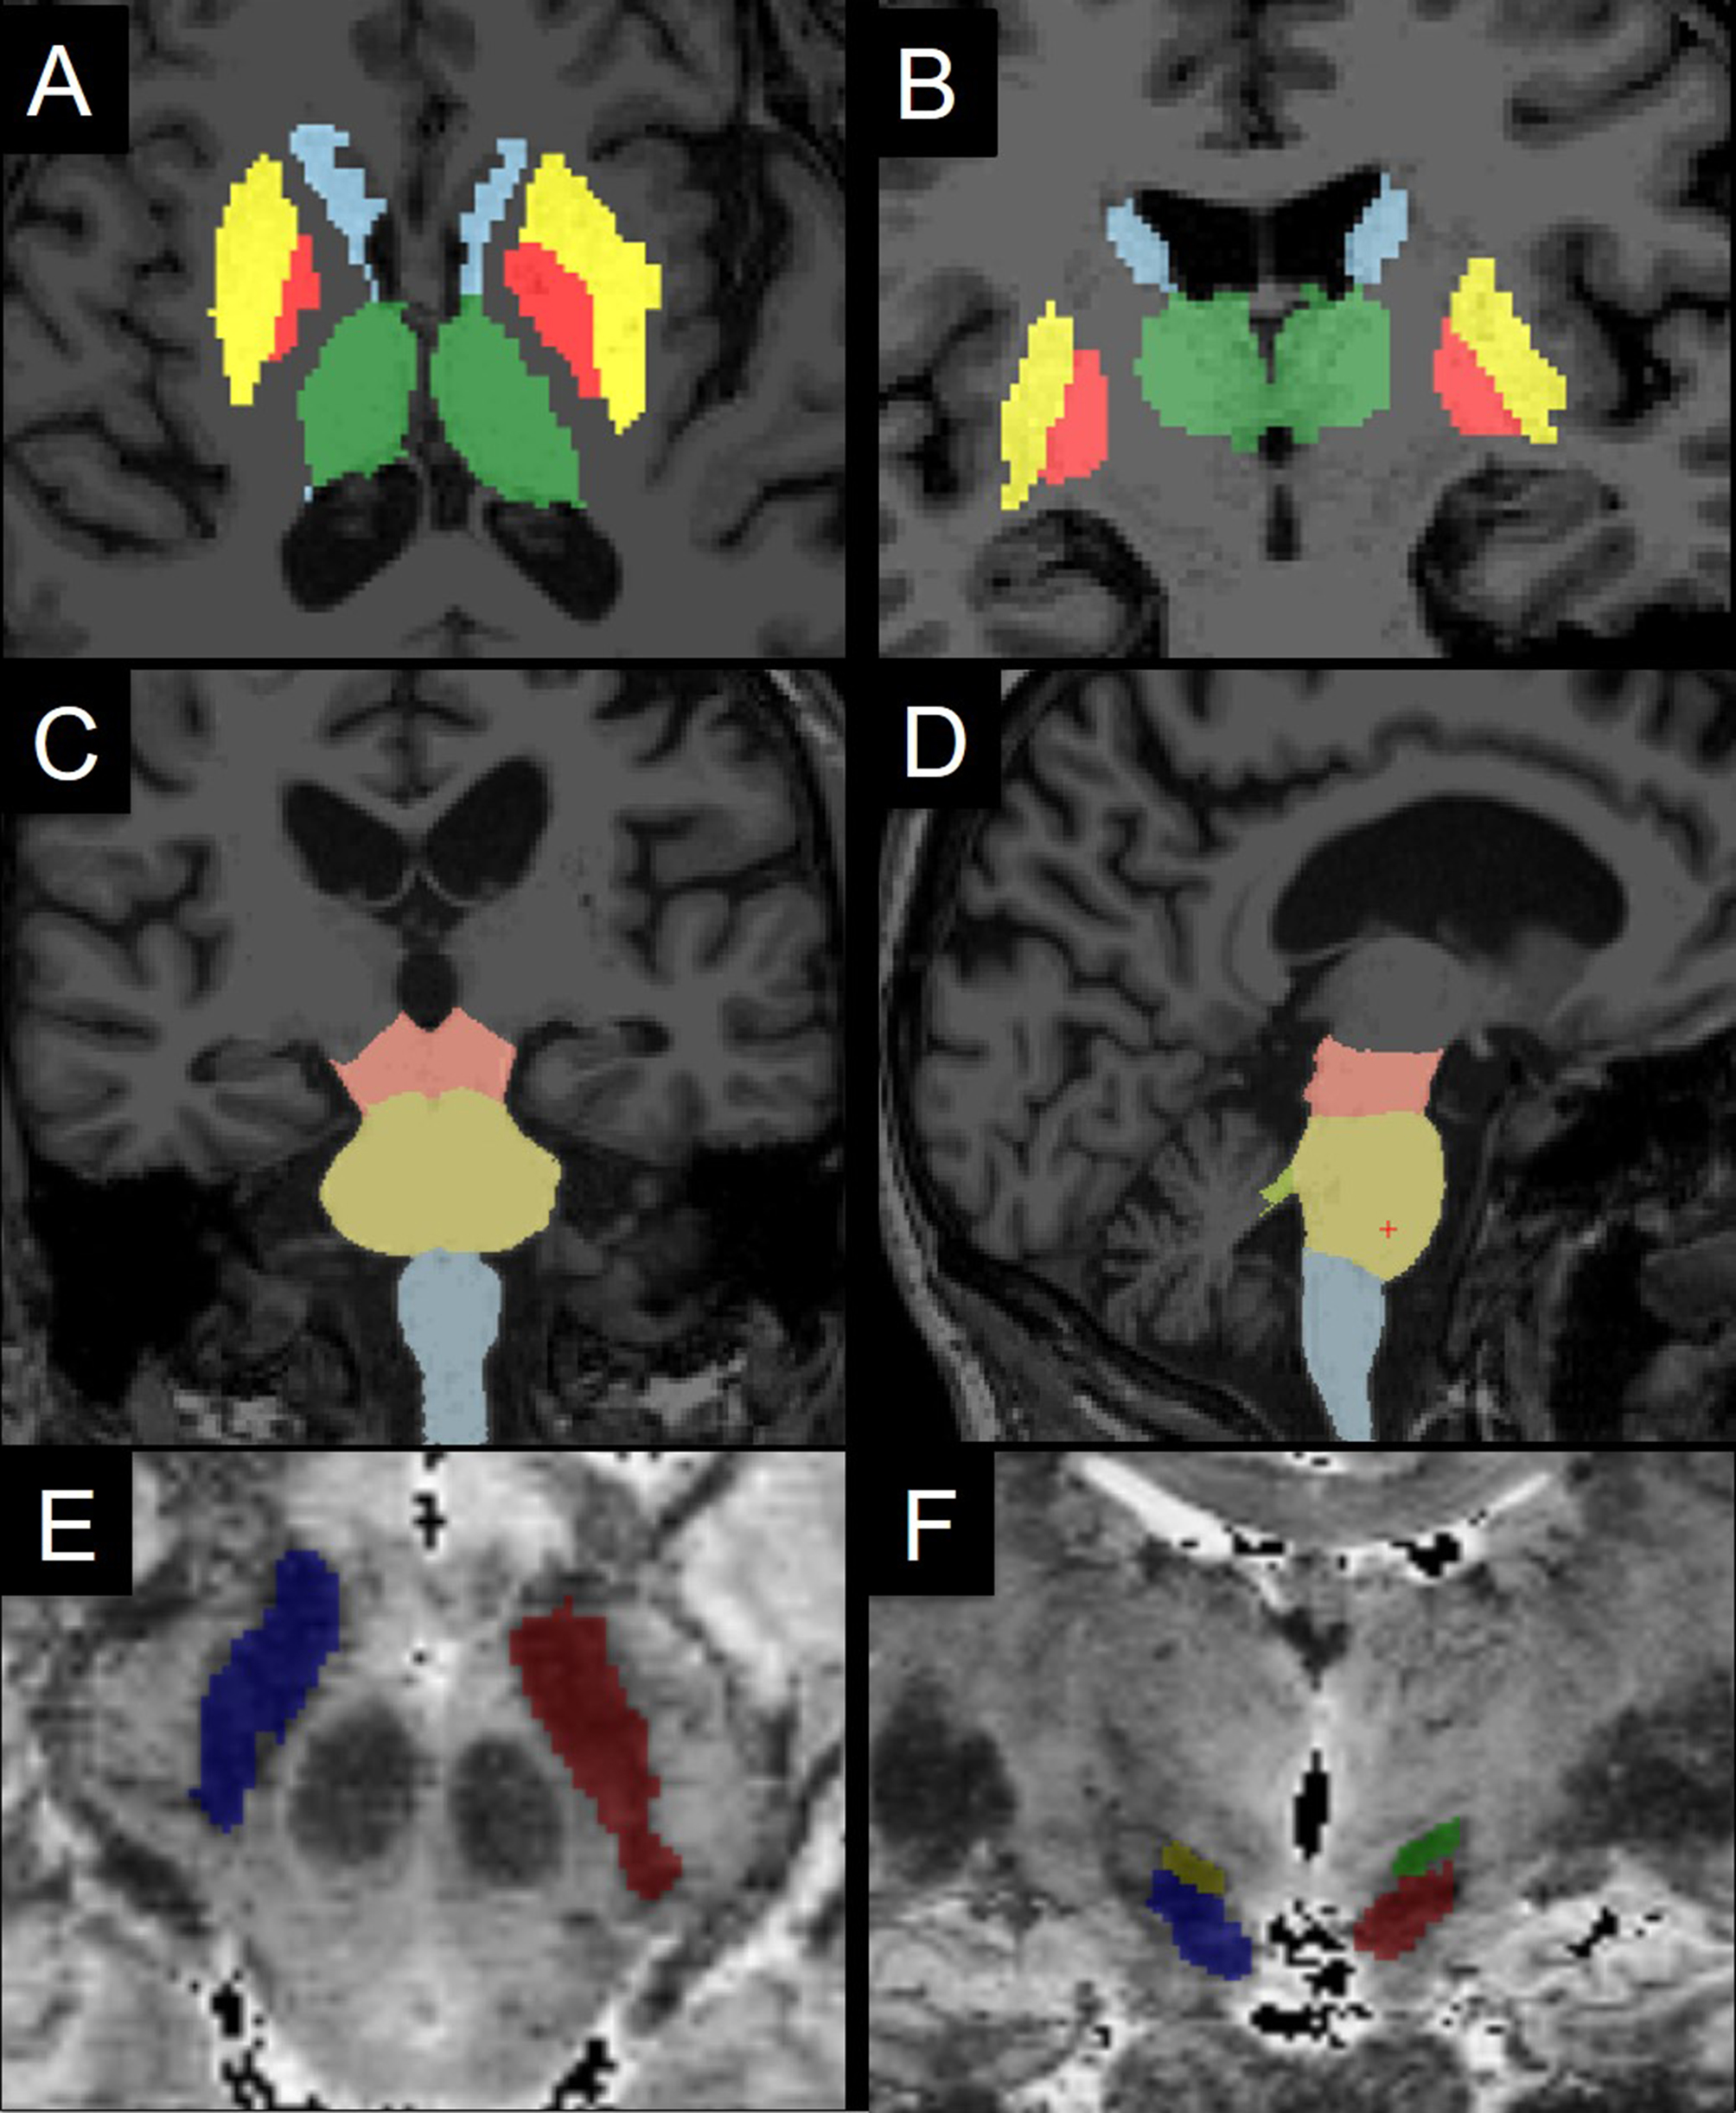
Image analysis: Image processing and analysis were performed using in-house software written in MATLAB. The regions of interest (ROI) were drawn manually at 3T in the SN using NM images, and in the NBM using T1-w and T2-w images, and at 7T in the STN using T2*-w images. Other ROIs were segmented automatically in the basal ganglia (putamen, globus pallidus, caudate nucleus, thalamus) and brainstem (midbrain, pons, medulla oblongata) as well as in hippocampus and amygdala using FreeSurfer (http://freesurfer.net/, MGH, Boston, MA, USA) software. The locus coeruleus, cuneiform nucleus and PPN were segmented semi-automatically with in-house software (Figure 1).7-8 Volume and normalized signal intensity in NM-sensitive images, R2*, fractional anisotropy (FA), axial (AD), radial (RD) and mean diffusivities (MD) were calculated in the ROIs.
Statistical analysis: Measures were compared using Kruskal Wallis test. The diagnosis accuracy was evaluated using ROC analysis.
Results
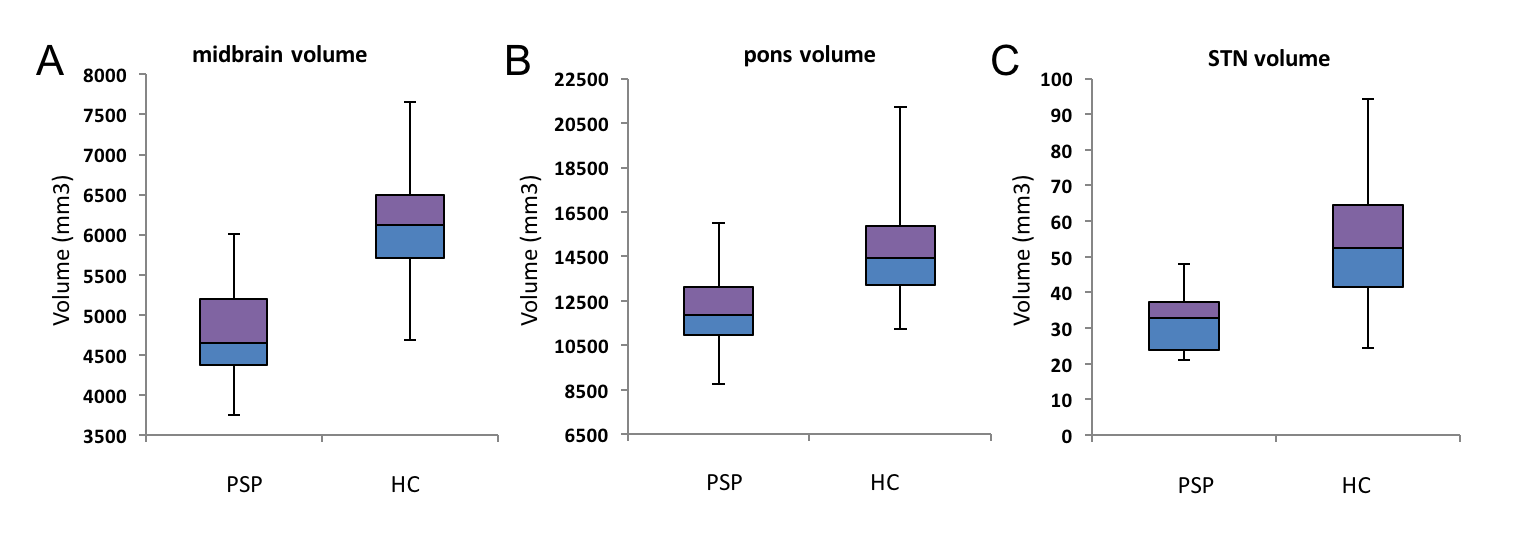
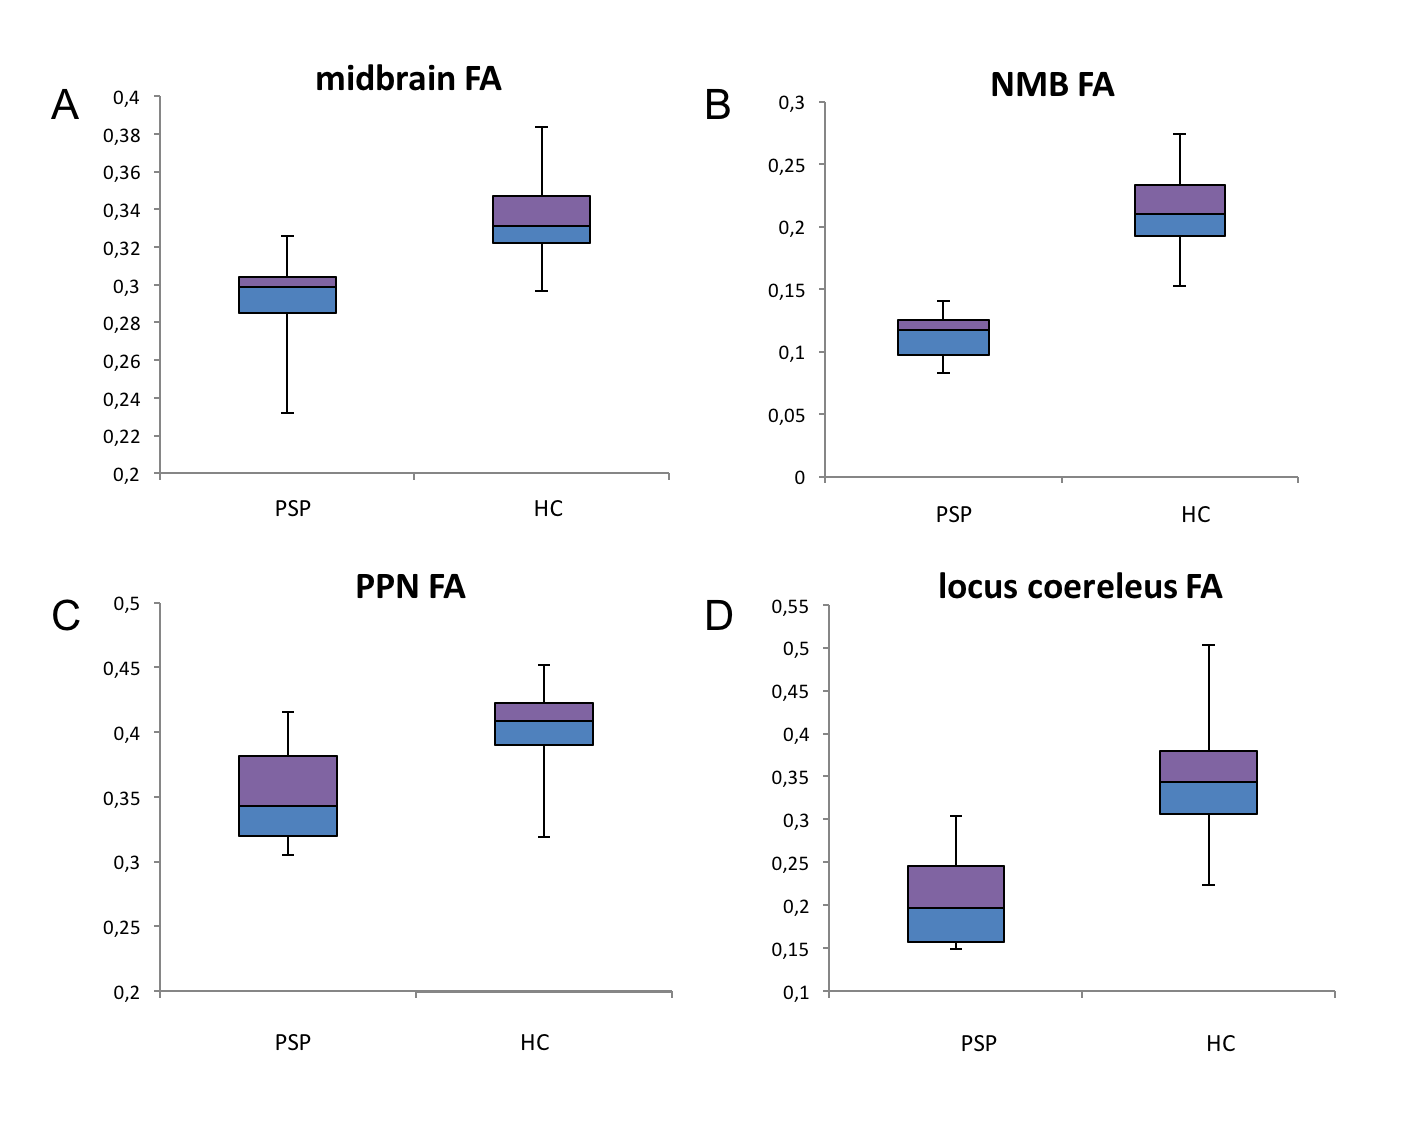
Using T1-w images, patients with PSP showed significant volume decrease in the midbrain (p<0.0001), pons (p<0.0001), medulla oblongata (p=0.007), caudate nucleus (p=0.01), putamen (p<0.0001), globus pallidus (p<0.0001) and thalamus (p=0.003). Volume decrease was evidenced in the SN using NM-sensitive images (p<0.0001) and the STN (p=0.001) (Figure 2). FA was reduced in the midbrain (p=0.0003), pons (p=0.001), thalamus (p=0.003), NBM (p<0.0001), PPN (p<0.0001), locus coeruleus (p<0.0001), cuneiform nucleus (p=0.0002) and SN (p<0.0001) (Figure 3). MD increased in the midbrain (p=0.002), NBM (p<0.001), locus coeruleus (p=0.0008) cuneiform nucleus (p=0.0004) and SN (p=0.001). R2* increase was observed in the caudate nucleus (p=0.03), putamen (p=0.01), globus pallidus (p=0.02) and SN (p=0.01). There were no changes in the hippocampus or amygdala. Several of these biomarkers had excellent diagnostic accuracy >0.9 (volume decrease in midbrain, pons, putamen and globus pallidus, STN, SN, and FA in the locus coeruleus and midbrain).Discussion
We observed extensive damage in the brainstem and the basal ganglia in PSP patients. The damaged regions corresponded to the ones that have been previously described in pathological studies. No damage was found in hippocampus or amygdala in line with pathology studies. These results suggest that direct noninvasive assessment of brain damage in PSP in specific structures including small brainstem and basal forebrain nuclei is attainable using MRI.Conclusion
This study demonstrates that quantitative MRI allows to evidence brain damage in PSP patients in not only in large basal ganglia and brainstem regions, as done previously, but also in small brainstem and basal forebrain structures as evidenced in pathological studies. These biomarkers have also excellent diagnostic accuracy for the PSP characterization.Acknowledgements
ANR nucleipark, DHOS-Inserm, France Parkinson, ENP and the Investissements d'Avenir, IHU-A-ICM, Paris Institute of Translational neuroscience ANR-10-IAIHU-06References
1. Colosimo C, Bak TH, Bologna M, Berardelli A. Fifty years of progressive supranuclear palsy. J Neurol Neurosurg Psychiatry, 2014; 85(8):938-44
2. Steele JC, Richardson JC, Olszewski J. Progressive supranuclear palsy. A heterogeneous degeneration involving the brain stem, basal ganglia and cerebellum with vertical gaze and pseudobulbar palsy, nuchal dystonia and dementia. Arch Neurol 1964; 10:333–359
3. David R Williams, Andrew J Lees. Progressive supranuclear palsy: clinicopathological concepts and diagnostic challenges. Lancet Neurol 2009; 8: 270–79
4. Dennis W. Dickson Parkinson’s Disease and Parkinsonism: Neuropathology Cold Spring Harb Perspect Med. 2012;1;2(8)
5. Zanignia S, Calandra-Buonaura G, Manners DN et al., Accuracy of MR markers for differentiating Progressive Supranuclear Palsy from Parkinson's disease. NeuroImage: Clinical. 2016; 736–742
6. Piattella MC, Upadhyay N, Bologna M, Neuroimaging evidence of gray and white matter damage and clinical correlates in progressive supranuclear palsy. J Neurol. 2015; 262(8):1850-8.
7. Bardinet E, Bhattacharjee M, Dormont D et al., A three-dimensional histological atlas of the human basal ganglia. II. Atlas deformation strategy and evaluation in deep brain stimulation for Parkinson disease. J Neurosurg. 2009; 110(2):208-19
8. García-Lorenzo D, Longo-Dos Santos C, Ewenczyk C, et al. The coeruleus/subcoeruleus complex in rapid eye movement sleep behaviour disorders in Parkinson’s disease. Brain J Neurol. 2013;136:2120–2129
Figures