2312
Graph-based analysis of brain structural MRI data in Multiple System Atrophy1Department of Biomedical and NeuroMotor Sciences, University of Bologna and Functional MR Unit, Policlinico S. Orsola - Malpighi, Bologna, Italy, Bologna, Italy, 2INFN-Bologna, Bologna, Italy, 3Department of Biomedical and NeuroMotor Sciences, University of Bologna and IRCCS Istituto delle Scienze Neurologiche di Bologna, Bologna, Italy, 4Department of Physics and Astronomy, Bologna, Italy, 5Centro Enrico Fermi, Roma, Italy
Synopsis
We investigated the differences in global and regional topological properties and the modular organization of brain networks derived from anatomical covariance of structural MRI between Multiple System Atrophy patients (subdivided in the variants MSA-C, MSA-P) and healthy controls (HC). No differences were found in global, local and small-worldness measures between MSA and HC or between MSA-C and MSA-P. The investigation of modular organization, which reflects differences in properties that underlie the functionality of the brain, has shown a segregation in a cortical-subcortical motor network in patient groups, which may underpin both the typical parkinsonian and cerebellar features of the disorder.
Introduction
Multiple System Atrophy (MSA) is a neurodegenerative movement disorder characterized by parkinsonism associated with various combinations of autonomic, pyramidal and cerebellar signs1. The predominant parkinsonian (MSA-P) and the predominant cerebellar (MSA-C) variants of MSA are mainly characterized by striatonigral degeneration and olivopontocerebellar atrophy, respectively2. In recent years, graph theoretical analysis has become increasingly popular in the neuroimaging field; the structural brain network constructed using the group-level morphometric covariance exhibits a small-world architecture in physiological condition3, offering an alternative method to regional approaches to investigate the pathophysiology of neurological disorders. The aim of this study was to investigate the differences in global and regional topological properties and the modular organization of brain networks derived from anatomical covariance of structural MRI data between MSA-C, MSA-P patients and healthy controls (HC).Materials and Methods
We evaluated 36 patients (20 MSA-C and 16 MSA-P) and 27 HC (Table 1). All participants underwent a brain-MR protocol comprising high-resolution T1-w volumetric sequences (1 mm3 resolution) on a 1.5T GE scanner. A structural correlation network based on regional gray matter volume was constructed for HC, MSA, MSA-C and MSA-P groups. Correlation matrices were constructed based on pair-wise correlations (Pearson’s correlation) between ROI pairs (negative correlations were replaced with zero). ROIs were obtained by the Freesurfer parcellation for cortical and subcortical structures and by the manual delineation of infratentorial structures of interest on the MNI template for a total of 89 nodes (Figure 1). Linear regression was performed in each ROI to regress out the effect of age and total brain volume as calculated in the HC group. The correlation coefficients were binarized at a range of network densities (0.1-0.45) to generate adjacency matrices. Differences in global and regional topological metrics between MSA and HC groups and between MSA-C and MSA-P groups were examined with a nonparametric permutation test4, with a significant p threshold <0.05. We then identified the modules of each network using an optimized algorithm5.Results
No differences were found in global, local and small-worldness measures between MSA and HC (data not shown) or between MSA-C and MSA-P (Figure 2 and 3). Four major modules were found for HC, but five for MSA, MSA-C and MSA-P. One module is analogous for the three patient groups: it includes the bilateral cerebellum cortex, and bilateral superior and medial peduncles. We focused on the cortical-subcortical motor network, which includes the bilateral motor and sensorimotor cortex, the paracentral cortex, the basal ganglia and the infratentorial structures. It is segregated in the patient groups, with cortical, subcortical and infratentorial structures belonging to three different modules (Figure 4a), while this segregation is not observed for HC (Figure 4b). The segregation of this network was the same for MSA, MSA-C and MSA-P.Discussion and Conclusions
This is the first study which characterizes brain networks derived from anatomical covariance of structural MRI data in MSA patients exploring possible differences between the cerebellar and parkinsonian forms of MSA. We found no significant alteration in the topological parameters of networks between groups. However, the investigation of modular organization of the different groups, which reflect differences in the network properties that underlie the functionality of the brain, has shown a segregation in the cortical-subcortical motor network, in line with the pathophysiology of MSA, and it may underpin both the typical parkinsonian and cerebellar features of the disorder.Acknowledgements
We thank INFN Group V NextMRReferences
1. Gilman S, Wenning GK, Low PA, Brooks DJ, Mathias CJ, Trojanowski JQ, Wood NW, Colosimo C, Dürr A, Fowler CJ, Kaufmann H, Klockgether T, Lees A, Poewe W, Quinn N, Revesz T, Robertson D, Sandroni P, Seppi K, Vidailhet M. Second consensus statement on the diagnosis of multiple system atrophy. Neurology 2008
2. Van Wijk BC, Stam CJ, Daffertshofer A. Comparing brain networks of different size and connectivity density using graph theory. PLoS One. 2010
3. He Y, Evans A. Graph theoretical modeling of brain connectivity. Curr Opin Neurol. 2010
4. Hosseini SM, Hoeft F, Kesler SR. GAT: a graph-theoretical analysis toolbox for analyzing between group differences in large-scale structural and functional brain networks. PLoS One. 2012
5. Blondel VD, Guillaume J-L, Lambiotte R, Lefebvre E. Fast unfolding of communities in large networks. J. Stat. Mech. 2008
Figures

Figure 1.
Cortical and subcortical ROIs obtained by the Freesurfer parcellation of the T1-w high resolution images (a). Manual delineation of infratentorial ROIs on MNI reported as an example in a sagittal (b) and an axial view (c) of the template.
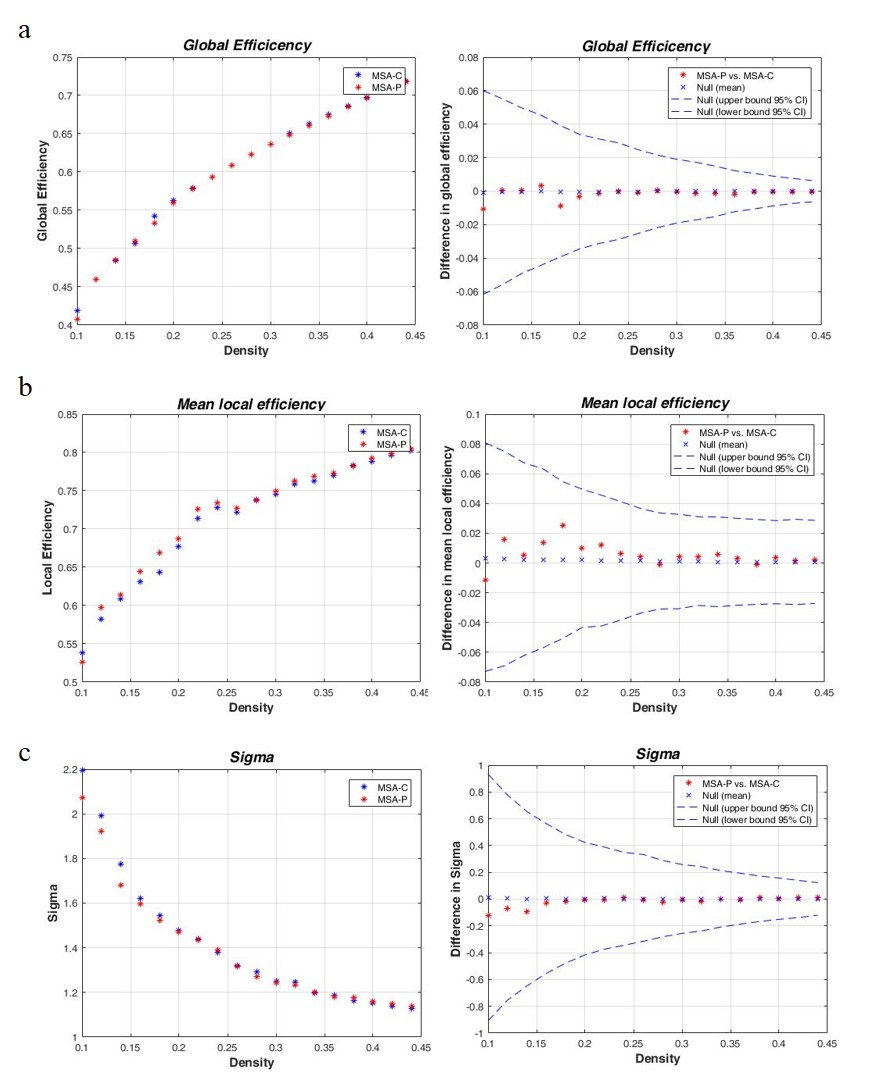
Figure 2.
Global Efficiency of MSA-C and MSA-P patients (a on the left) and their between groups comparison (a on the right). Mean local efficiency (b on the left) and small-worldness (c on the left) of MSA-C and MSA-P and their between groups comparison (b and c respectively, on the right). No significant differences were found.
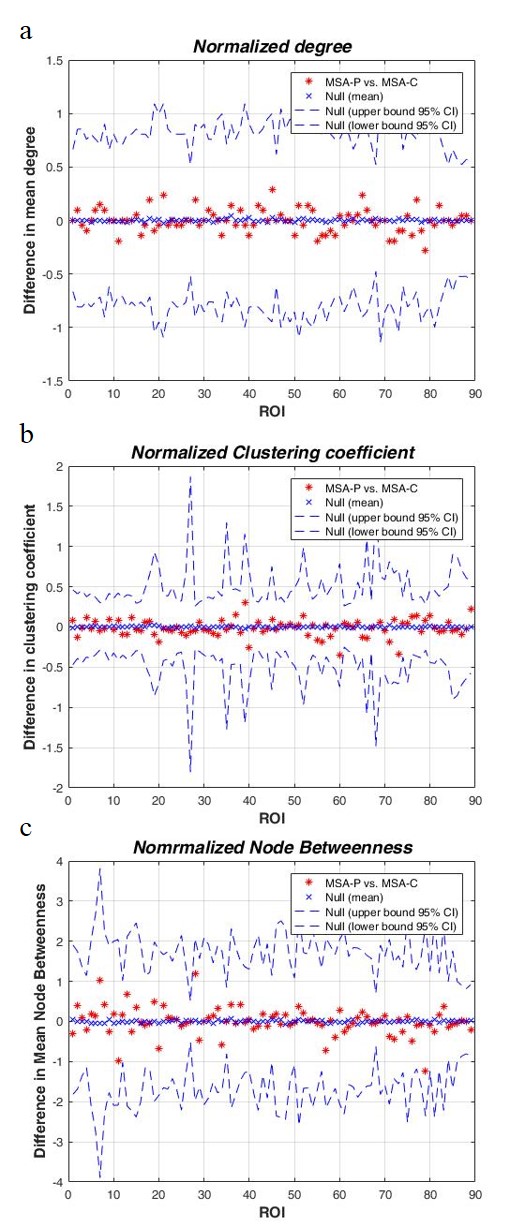
Figure 3.
Between groups comparison of MSA-C vs MSA-P patients in regional network properties: normalized degree (a), nomalized clustering coefficient (b) and normalized node betweenness centrality. No significant differences were found.
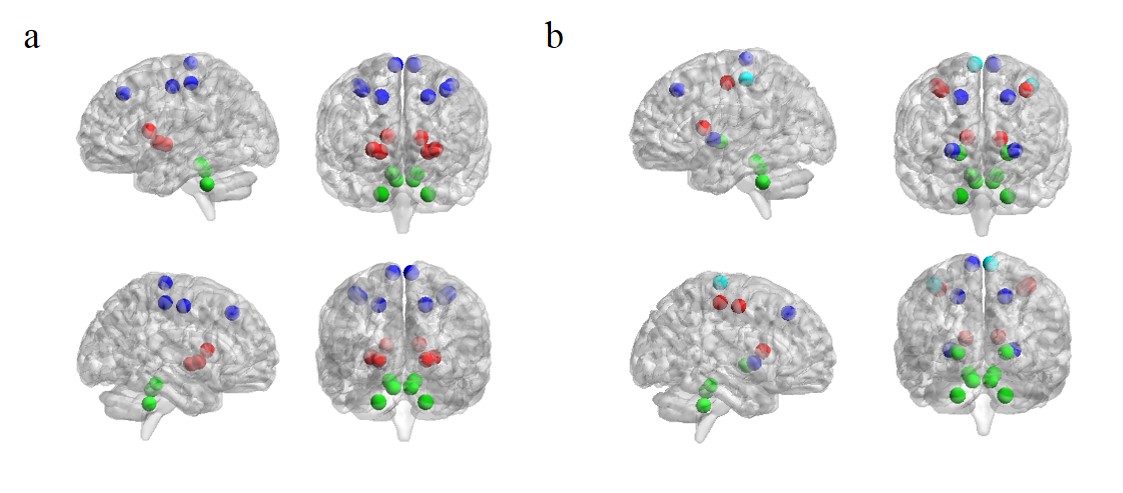
Figure 4.
Modules that contains regions of the cortical-subcortical motor network for MSA patients (a) and HC (b). Blu regions belong to Module I, red regions belong to Module II and dark-blu regions belong to Module III, light-blu regions (only in HC) belong to Module IV.
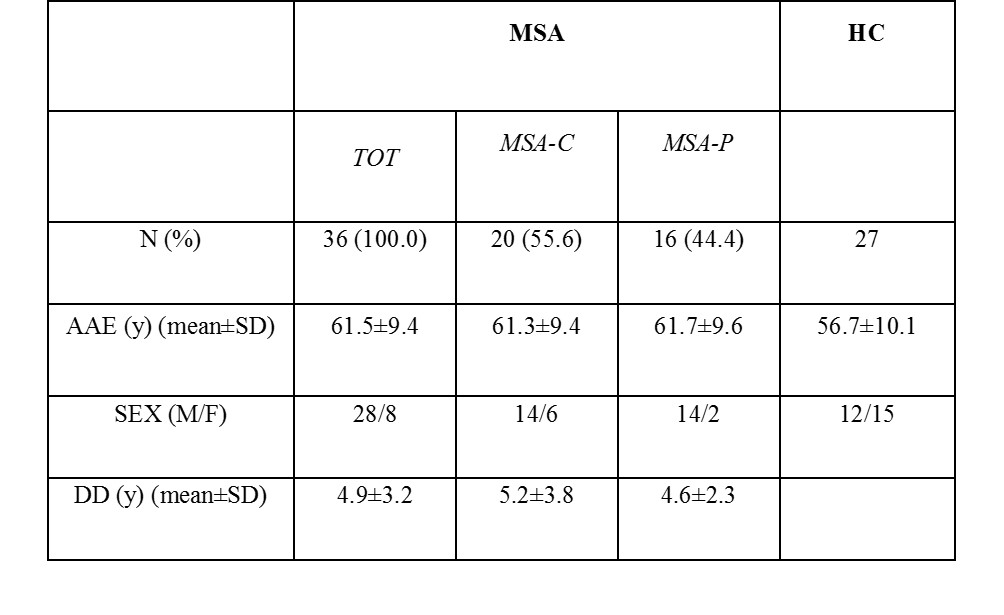
Table 1.
Demographic and clinical features of cases and healthy controls at the day of MR scan.
Legend: HC: healthy controls; MSA: Multiple System Atrophy patients subdivided in MSA-C and MSA-P; AAE: age at evaluation; DD: disease duration.