2311
DTI of the Sciatic Nerve in Patients with Charcot-Marie-Tooth Diseases1Vanderbilt Institute of Imaging Science, Vanderbilt University, Nashville, TN, United States, 2Neurology, Vanderbilt University, Nashville, TN, United States, 3Radiology and Radiological Sciences, Vanderbilt University, Nashville, TN, United States
Synopsis
This study examines the sensitivity of DTI metrics to proximal sciatic nerve pathology in a cohort of patients with Charcot-Marie-Tooth (CMT) diseases and matched controls, with the longer-term goal of developing objective biomarker of disease progression and treatment response. Prior studies have shown that DTI metrics can relate to disability in other neuropathies. Here we demonstrate that robust DTI can be performed in the proximal sciatic nerve of patients with CMT, and the resulting metrics are sensitive to myelin and/or axonal pathologies. Future studies will test if DTI measures predict disability in patients with CMT.
Purpose
There is a need for sensitive and responsive biomarkers of disease progression and treatment response for future clinical trials in patients with inherited neuropathies, or Charcot-Marie-Tooth (CMT) diseases1,2. CMT refers to a family of inherited demyelinating and axonal neuropathies that are subtyped based upon the specific genetic mutation (e.g., CMTX results from mutations in the gene for connexin 32). CMT subtypes are typically characterized by de/dysmyelinaton and/or length-dependent axonal loss, resulting in distal nerves that are often fully degenerated and insensitive to progression1,3-5. Proximal nerves are partially preserved in patients with CMT and, therefore, may be an ideal target for detecting disease progression. Unfortunately, these proximal nerves are mostly inaccessible via current tools (e.g., nerve conduction studies)4. Diffusion tensor imaging (DTI), which probes the effect of tissue barriers on the apparent diffusivity of water, is well suited for probing proximal nerves; and the resulting metrics (e.g., fractional anisotropy, FA) have been shown to relate to disability in other neuropathies5,6. In this study, we examined the sensitivity of DTI metrics to proximal sciatic nerve (SN) pathology in a cohort of patients with CMT and matched controls.Methods
Eight healthy subjects (20-57 years old; 4 female) and 10 CMT patients (18-61 years old; 7 females; 1 CMT2F, 2 CMTX, 6 HNPP, and 1 unidentified CMT subtype) were imaged using 3.0-T Phillips Achieva MR scanner. A two-channel body coil was used for RF transmission and a six-channel cardiac coil was used for RF reception. A scout scan was performed to measure the length of the femur, and subsequent scans were centered at 1/3 this length to normalize volume selection across patients. DTI data were acquired with the following parameters: b-value = 900 s/mm2, 16 diffusion-encoding directions, resolution = 1.5x1.5x9.6 mm3, 10 slices, TR/TE = 4000/62 ms, SENSE factor = 1.5, combined SPAIR/gradient reversal fat suppression, NEX = 6, and scan time ≈ 10 minutes. DTI analyses was performed using a custom processing pipeline in MATLAB R2016b. Within this pipeline, data were corrected for motion/eddy currents via FSL7 and maps of axial/mean/radial diffusivities (AD/MD/RD) and FA were estimated via a weighted linear least-squares method (Camino8). Nerve and muscle regions were automatically masked via MIPAV’s fuzzy C-means algorithm; and ROIs were manually selected for the SN and mean slice-wise DTI parameters were estimated.Results
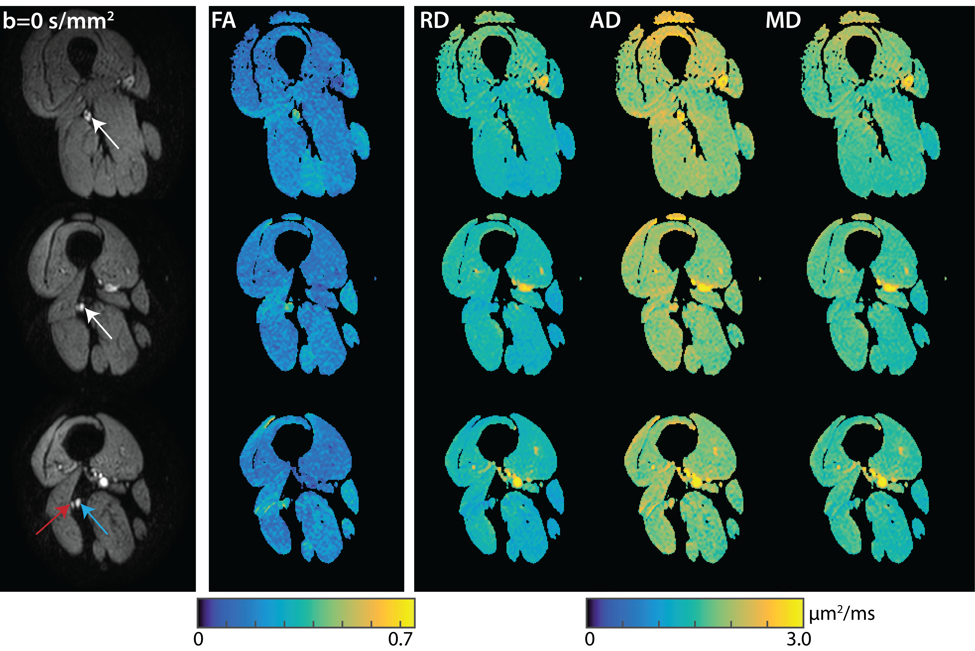
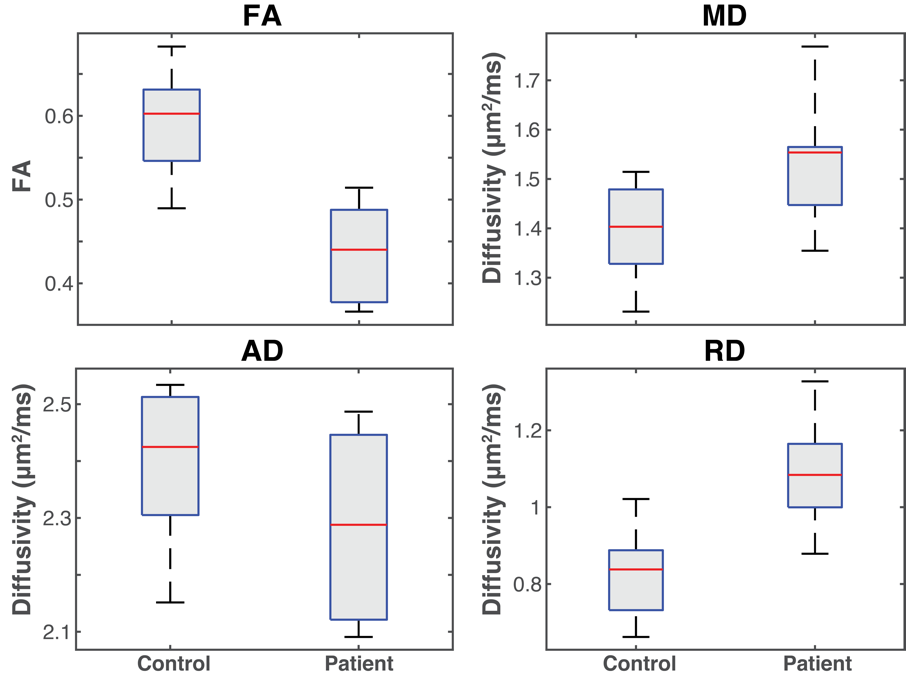
Figure 1 shows representative DTI data and parameter maps from a healthy subject for three of the ten slices, while Figure 2 shows similar representative data for a patient with HNPP. Robust fat suppression, which is essential to minimize the influence of fat that surrounds the nerve, was achieved in all subjects. Furthermore, for the higher resolutions required for peripheral nerve imaging, high fidelity maps were obtained within a clinically feasible ten-minute scan time. Note the branching of the sciatic nerve into the tibial and common peroneal branches was observed in the more distal slices. These nerves were grouped together with the more proximal sciatic nerve ROIs for the sake of analysis. Mean DTI parameters in the SN are summarized in the boxplots shown in Figure 3. Significant reductions were observed in the SN FA values (p<0.01, two-sample t-test) of patients (0.44±0.06) relative to controls (0.59±0.07). For the diffusivities, significant increases were observed for MD (patients:1.54±0.13 μm2/ms; controls:1.40±0.10 μm2/ms; p=0.02) and RD (patients:1.09±0.14 μm2/ms; controls: 0.82±0.12 μm2/ms; p<0.01), while no difference was detected between cohorts for AD (patients:2.28±0.16 μm2/ms; controls: 2.40±0.14 μm2/ms; p=0.12).Discussion and Conclusion
Herein, we demonstrated that i) robust DTI can be performed in the proximal sciatic nerve of patients with CMT and ii) the resulting metrics are sensitive to myelin and/or axonal pathologies. In the CMT cohort studied, reductions in FA were found to be primarily driven primarily by increases in RD, suggesting that myelin pathologies may be primarily responsible for the observed FA differences between cohorts. This is because previous studies in nerve have indicated that RD is primarily sensitive to myelination, while AD is primarily sensitive to axonal degeneration and loss9. In all subjects, we obtained the clinical evaluation subset of the CMT neuropathy score (CMTES) to assess clinical impairment. Unfortunately, we do not have the statistical power required to test for correlations between DTI metrics and the CMTES at this time. As data are acquired in a larger cohort, we will perform these tests to determine if —similar to our previous magnetization transfer findings in sciatic nerve2—DTI measures of proximal nerve microstructure are predictive of disability in patients with CMT.Acknowledgements
K25 EB13659-04 and R01NS066927 for funding.References
1. Shy ME, Blake J, Krajewski K, et al. Reliability and validity of the CMT neuropathy score as a measure of disability. Neurology 2005;64:1209–1214.
2. Dortch R, Dethrage L, Gore J, et al. Proximal nerve magnetization transfer MRI relates to disability in Charcot-Marie-Tooth diseases. Neurology 2014;83:1545-1553.
3. Dyck PJ, Lambert EH. Lower motor and primary sensory neuron diseases with peroneal muscular atrophy: I: neurologic, genetic, and electrophysiologic findings in hereditary polyneuropathies. Arch Neurol 1968;18:603–618.
4. Dyck PJ. Lower motor and primary sensory neuron diseases with peroneal muscular atrophy: II: neurologic, genetic, and electrophysiologic findings in various neuronal degenerations. Arch Neurol 1968;18:619–625.
5. Mathys C, Aissa J, Meyer Zu Hörste G, et al. Peripheral neuropathy: assessment of proximal nerve integrity by diffusion tensor imaging. Muscle Nerve 2013;48:889– 896.
6. Chung KW, Suh BC, Shy ME, et al. Different clinical and magnetic resonance imaging features between Charcot- Marie-Tooth disease type 1A and 2A. Neuromuscular Disorders 2008;18:610–618.
7. M. Jenkinson, C.F. Beckmann, T.E. Behrens, M.W. Woolrich, S.M. Smith. FSL. NeuroImage, 62:782-90, 2012
8. Cook P, Bai Y, Nedjati-Gilani S, Seunarine K, Hall M, Parker G, Alexander D. Camino: open-source diffusion-MRI reconstruction and processing. 2006:2759.
9. Heckel A. Peripheral Nerve Diffusion Tensor Imaging: Assessment of Axon and Myelin Sheath Integrity. PLOS ONE. 2015
Figures