2307
Correlation Between Cerebral Blood Flow And Whole Brain Perfusion In Children Undergoing Deep Sedation.1MRI Research, University Children Hospital, Zurcih, Switzerland, 2BioFlow, University Picardie Jules Verne, Amiens, France, 3MRI Research, University Children Hospital, Zurich, Switzerland, 4Anesthesia, University Children Hospital, Zurich, Switzerland, 5Radiology, University Children Hospital, Zurich, Switzerland
Synopsis
Anaesthetics such as those used for sedation in paediatric MRI affect cerebral blood flow and hemodynamics to varying degrees. This study examines the link between brain perfusion measured by arterial-spin-labelling and cerebral blood flow measured by phase-contrast MRI in 2 cohorts of children undergoing sedation either with propofol or a combination of propofol and ketamine. Significant correlations were observed between these 2 variables for both groups.
Purpose
Propofol-based deep sedation is the most common technique used in pediatric MRI [1]. It has been shown that propofol based sedation has both cardiovascular and respiratory side effects [2,3], and previous studies reported an increase of cerebral hemodynamics with ketamine [4]. The purpose of this investigation was to compare whole brain perfusion (WBP) obtained by pseudo-continuous arterial spin labelling (ASL) to cerebral blood flow (CBF) obtained by cine phase-contrast MRI in a cohort of children undergoing deep sedation with propofol (Prp) and a combination of propofol + ketamine (PrKt)
Material and Methods
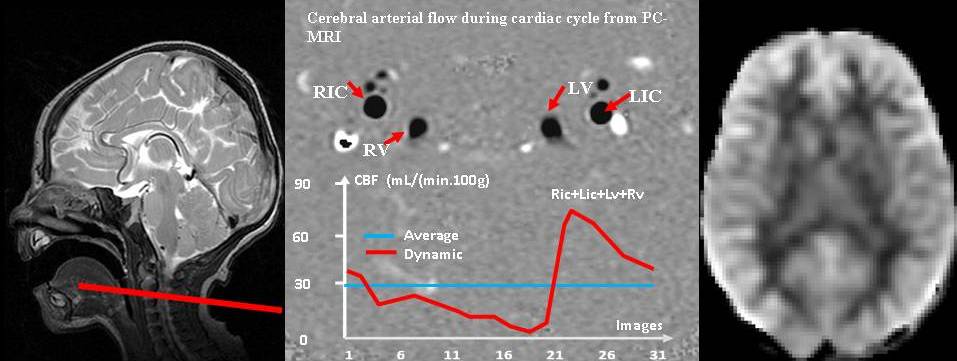
A randomized double blinded investigation was initiated to investigate 216 children referred for MRI under sedation, comparing induction with ketamine 1 mg/kg plus propofol boli as needed, followed by propofol 5 mg/kg/hour vs. propofol 1-2 mg/kg at induction followed by propofol 10 mg/kg/hour... Cerebral MRIs were reviewed by a neuroradiologist and a subset of n=83 cerebral MRI cases were reported as normal. Of these normal brain exams, 58 subjects had simultaneously both cine PC and ASL. The acquisitions were performed on two 3T and one 1.5T GE scanners. Single slice 2D cine PC was acquired about 5 min after injection of either Prp or PrKt to assess both venous and arterial blood flows. The slice was prescribed at the level of the spine (C2C3) and perpendicular to the jugular veins, the internal carotid arteries and the vertebral arteries. The imaging parameters are: Xres=256, Yres=160, 2 Nex, 2 VPS, flip-angle=20°, TR=7-8ms, TE=3-4ms, 32 cardiac phases, peripheral gating, Venc=100 cm.s-1, FOV=140x105mm2. Brain perfusion images were acquired with a 3D background-suppressed, multishot, segmented (ASL) perfusion sequence, using a stack of spirals readout with TR=5.5 s, TE=25 ms, matrix=64x64, thickness=3 mm, and FOV=24 cm. Perfusion images were quantified assuming an inversion efficiency of 71% (based on the estimated efficiency of the PCASL labelling (0.95) combined with the estimated loss of efficiency from the background suppression (0.75) [5]. Arterial and venous blood flows (mL/min) were processed using tidam software [6]. Flow measurements were performed bilaterally on the internal carotid arteries and the vertebral arteries. The two sides were combined and the carotid and vertebral flows were summed to extract the arterial inflow. Total CBF (mL.min-1) values were adjusted to 100g of brain mass (CBF100g = mL.min-1.100g-1) using the brain weight changes per age range during the life span [7]. Average WBP values were extracted from the ASL perfusion images using a grey matter mask derived from the AAL atlas, registered to the ASL perfusion maps in native space. Shapiro-Wilk tests were used to test for normality of the whole brain perfusion values.Results
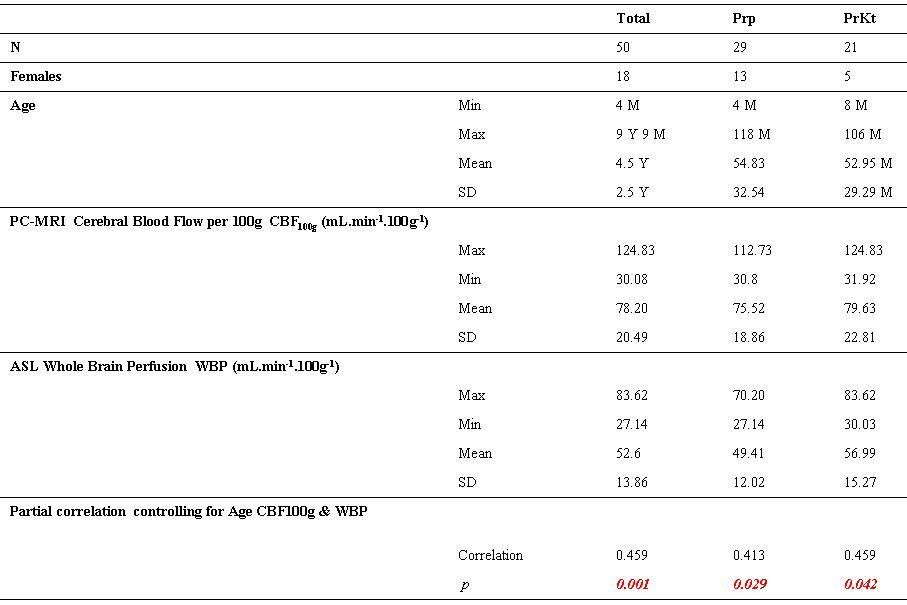
A between group comparison of the Prp vs PrpKt groups (controlling for age at MRI) revealed a trend towards a difference in their CBF100g values (p=0.06, adjusted R2 = 0.037), but no significant difference in their CBF values (p=0.33, adjusted R2 = 0.003). A trend towards a difference in WBP values was also observed (p=0.052, adjusted R2 = 0.043), which became significant when adding the scanner as an additional covariate (p=0.022, adjusted R2 = 0.309). Combined groups: A partial correlation analysis controlling for age at MRI (table 1) shows a significant correlation (p=0.001, R=0.459) between the mean WBP (53.6 ± 13.8 mL.min-1.100g-1) and the mean CBF100g (78.2 ± 20.4 mL.min-1.100g-1). Prp group: The partial correlation analysis (table 1) showed significant correlation (p=0.029, R=0.413) between the mean WBP (49.4±12 mL.min-1.100g-1) and the mean CBF100g (75.5 ± 18.8 mL.min-1.100g-1). PrpKt group: The partial correlation analysis demonstrated a significant correlation (p=0.042, R=0.459). between the mean WBP (56.9±15.2 mL.min-1.100g-1) and the mean CBF100g (79.6 ± 22.8 mL.min-1.100g-1)
Discussion
In both the Prp and PrpKt groups, the WBP values correlate closely with the mean CBF100g, calculated from PC-MRI after correcting for the brain weight as a function of age. However, the ASL perfusion values appear to underestimate the whole brain flow values, suggesting that the inversion efficiency, (71%) assumed for the ASL quantification, underestimates the true inversion efficiency in this paediatric group. While the underestimate of perfusion apparent in the ASL images could also arise partly from partial volume effects, previous studies have reported that the inversion efficiency can be underestimated when the blood velocity in the feeding arteries is elevated5, as is the case in children relative to adults [8]. Therefore, in studies of children, calibration of the ASL inversion efficiency using PC-MRA may improve the quantification accuracy of ASL perfusion values.
Acknowledgements
No acknowledgement found.References
[1] Kamat PP, et al. (2015). Pediatric Crit Care Med. 16(1):11-20
[2] TL Slovis (2011). Pediatr Radiol. 41 (Suppl 2):S514-S516
[3] Starkey E,
et al. (2010). Arch Dis Child Educ Pract Ed. Jun;96(3):101-6.
[4] Langsjo JW et al. (2005) Anesthesiology; 103:258–68
[5] S Aslan, et al. (2010), MRM March 63(3):765-771
[6] Baledent O, et al. (2001) Invest Radiol 36: 368 – 377
[7] Dekaban AS and Sadowsky D (1978) Ann Neurol4:345-356
Figures