2305
DTI-based Connectome Analysis to Predict Outcome of Picture Exchange Communication System (PECS) in Young Children with Autistic Spectrum Disorders1Pediatrics, Wayne State University, Detroit, MI, United States, 2Translational Imaging Lab, Children's Hospital of Michigan, Detroit, MI, United States
Synopsis
The aim of this study is to apply DTI-based
connectome analysis to investigate the neural substrate and mechanism of picture
exchange communication system (PECS) in young children with ASD. Seventeen
non-verbal children with ASD who underwent PECS and 3T DTI (age: 3.05±0.82 years, 10 boys) were retrospectively selected
for whole brain connectome analysis . Compared with 5 children who failed PECS (non-verbal after PECS), 12 children who succeeded PECS (verbal after PECS) showed significantly increased betweeness, local efficiency and nodal
strength in anterior inferior occipital gyrus (p <0.01). Such increases may
be an effective imaging marker to detect ASD children who will become verbal
after PECS.
Purpose
Serious deficit in communication is known as the primary diagnostic criteria for autism spectrum disorders (ASD). It has been estimated that about one-third to on-half of children with ASD do not have functional speech1. The picture exchange communication system (PECS) is a well-known intervention for improving functional communication skills in young children with ASD2. Significantly improved communication skills were reported in 62% of previous literatures which applied PECS to young children with ASD3 but the neurological substrate associated with the effectiveness of PECS has not been studied yet. The aim of this study is to apply DTI-based connectome analysis to investigate the neural substrate and mechanism of PECS in young children with ASD.Method
Seventeen non-verbal children with ASD who underwent PECS were retrospectively selected for the study (age: 3.05±0.82 years, 10 boys). The outcome of PECS was assessed at least 1 year after completing 6 months of PECS, categorized as two groups, PECT positive group (verbal after PECS, n=12) and PECS negative group (non-verbal after PECS, n=5). All participants underwent a 3T diffusion weighted MRI with eight channel head coil at TR = 12,500ms, TE = 88.7ms, FOV = 24cm, 128×128 acquisition matrix (nominal resolution = 1.89mm), contiguous 3mm thickness in order to cover entire axial slices of whole brain using 55 isotropic gradient directions with b= 1000s/mm2, one b=0 acquisition, and number of excitations=1. For each subject, an independent component analysis with ball and stick model4 was applied for whole brain tractography. A total of 27 cortical nodes of interest in temporal and occipital lobe of left hemisphere underlying language-visual perception pathway were generated by fitting a deformable template of automated anatomical labeling atlas (AAL, http://www.gin.cnrs.fr/spip.php), resulting in a 27×27 connectivity matrix in which the elements quantify the pair-wise connectivity scores (i.e., fiber numbers connecting any two given cortical regions which were normalized by the corresponding tract mean lengths5). Brain Connectivity Toolbox (BCT, https://sites.google.com/site/bctnet) was utilized to assess the following network metrics at individual node: strength (the number of the shortest paths), local efficiency (the measure of local integration), and betweeness (the measure of centrality). Finally, one-way ANOVA corrected by Benjamini and Hochberg procedure for multiple comparisons was performed to identify specific connections and nodes showing significant between-group difference.Results
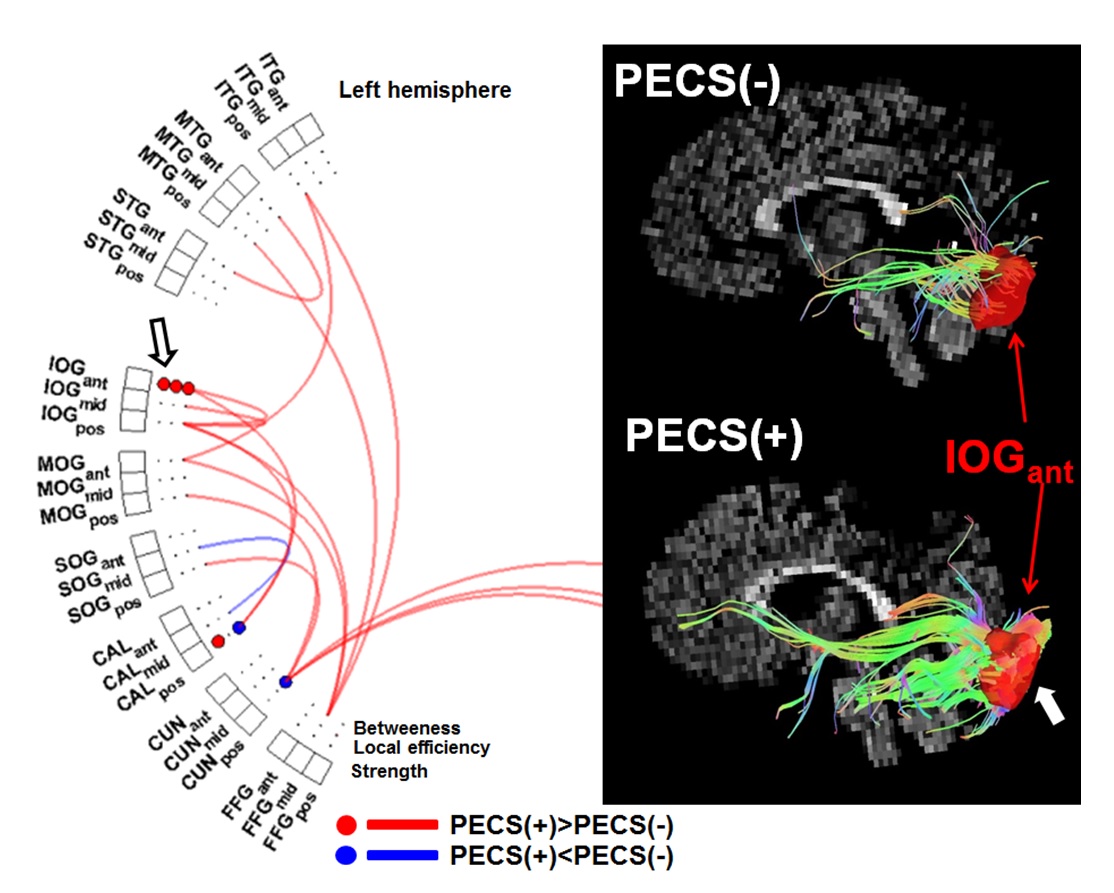
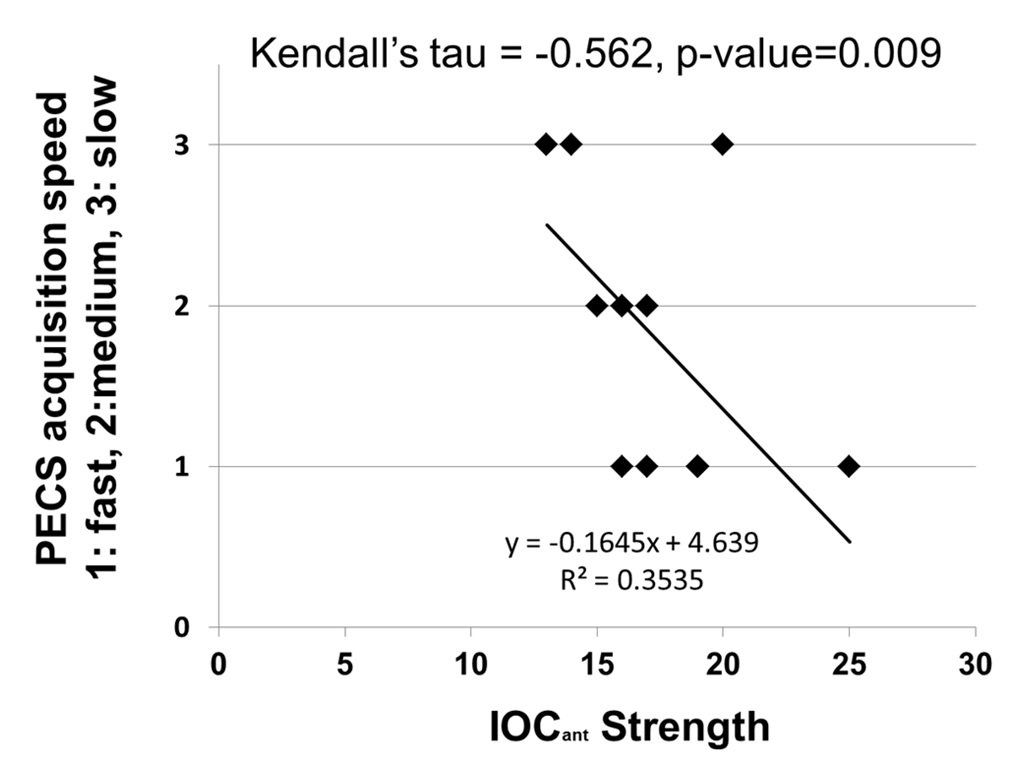
Three temporo-occipital connections showed statistically significant group difference after correcting for multiple comparisons (Fig. 1), posterior inferior temporal gyrus-anterior middle occipital gyrus (F=6.76, p-value <0.005), posterior inferior temporal gyrus-middle fusiform gyrus (F=6.62, p-value <0.005), posterior middle temporal gyrus- middle fusiform gyrus (F=6.91, p-value<0.005). Compared with PECS (-), PECS(+) showed significantly increased scores in these connections. Also, significantly increased betweeness, local efficiency and nodal strength were found in anterior inferior occipital gyrus of PECS (+) (i.e, F > 3.12 and p-value <0.01). Correlation analysis revealed a linear tendency between nodal strength of anterior inferior occipital gyrus and PECS acquisition speed (Fig. 2, Kendall’s τ= -0.56, P=0.009).Discussion and Conclusion
ASD children who became verbal after completing PECS showed significantly increased axonal connectivity, most pronounced in inferior temporal-middle occipital-fusiform pathway and inferior occipital gyrus of left hemisphere. Such an increased connectivity may be an effective imaging marker to detect ASD children who will become verbal after PECS and better understand neural substrates of PECS commonly identified in nonverbal children with ASD who do not respond to PECS.Acknowledgements
Author would like to thank all participants and their families for their time and interest in this study. The authors declare no conflicts of interest.References
1.Mirenda, P. Toward functional augmentative and alternative communication for students with autism: manual signs, graphic symbols, and voice output communication aids. Language, Speech, and Hearing Services in Schools, 2003; 34:203-216. doi: 10.1044/0161-1461.
2.Preston D, Carter M. A review of the efficacy of the picture exchange communication system intervention. J Autism Dev Disord. 2009; 39:1471-1486.
3.Tien KC. Effectiveness of the picture exchange communication system as a functional communication intervention for individuals with autism spectrum disorders: a practice-based research synthesis. Education and training in developmental disabilities. 2008; 43(1):61-77.
4. Jeong JW, Asano E, Yeh FC, Chugani DC, Chugani HT. Independent component analysis tractography combined with ball and stick model to isolate intra-voxel crossing fibers of the corticospinal tracts in clinical diffusion MRI. Mag Reson Med 2013;70:441-53.
5. Ge B, Tian Y, Hu X, Chen H, Zhu D, Zhang T, Han J, Guo L, Liu T. Construction of multi-scale consistent brain networks: methods an applications. PLoS One. 2015; 10(4):e0118175. doi: 10.1371/journal.pone.011875.
Figures