2300
Divergent trajectory of age-related cerebellar volume change in children with ataxia telangiectasia1Radiological Sciences, University of Nottingham, Nottingham, United Kingdom, 2Radiotherapy and Radiation Oncology, University Hospital Carl Gustav Carus of the Technische Universität Dresden, Dresden, Germany, 3Paediatric Neurology, Nottingham University Hospitals NHS Trust, Nottingham, United Kingdom, 4Division of Child Health, University of Nottingham, Nottingham, United Kingdom
Synopsis
Cerebellar atrophy occurs in the inherited neurodegenerative syndrome Ataxia Telangiectasia (A-T) but the trajectory of cerebellar atrophy across childhood and its relationship to clinical status is unknown. We report cerebellar and fourth ventricular volumes (normalized to intracranial volume) from 24 children with A-T and 24 matched controls. Cerebellar volume declined linearly with increasing age in the A-T group with a divergent trajectory of age-related cerebellar volume change compared to normally-developing children. Fourth ventricular volume increased with age in children with A-T and correlated with clinical status, and may provide an imaging marker of neurological status in childhood A-T.
PURPOSE
Ataxia Telangiectasia (A-T) is an autosomal recessive condition associated with childhood-onset cerebellar neurodegeneration, respiratory disease and increased risk of cancer. Defects in the Ataxia Telangiectasia mutated (ATM) gene lead to absent or defective production of the ATM protein kinase which has known roles in repair of double stranded DNA breaks and in regulating the cellular response to oxidative stress1,2. Patients with classical A-T have a complete absence of functioning ATM protein while individuals with A-T like disorders (A-TLD) lack ATM gene mutations but have mutations in genes for proteins linked to the ATM protein functions and have a similar phenotype to A-T. Cerebellar atrophy is the neuroimaging hallmark of A-T but the trajectory of cerebellar volume loss across childhood and its relationship to clinical features is unknown. In this work we use structural MRI from a cohort of children with A-T and healthy controls to establish relationships between cerebellar volume, age and clinical status.METHODS
The study was approved by UK National Research Ethics Service (Reference 14/EM/1175). Informed consent was obtained in all cases. Participants in the A-T group were recruited from the National Paediatric A-T Clinic, Nottingham, UK. Age-matched healthy control children were recruited from local community groups. A-TNEST3 was used to quantify the neurological disability in participants in the A-T group. A-TNEST scores are expressed as a percentage, with higher score indicating a better neurological status. Participants underwent MRI at 3T (Discovery MR750, GE Healthcare, Milwaukee, WI) including 3D fast spoiled gradient echo (FSPGR) T1w MRI with 1 mm isotropic resolution. T1 images were segmented into 138 structures using the MALP-EM algorithm4,5. The standard MALP-EM segmentation was refined with an additional step to remove residual CSF from cerebellar labels. This was achieved by labelling all voxels in the cerebellar region with an intensity lower than a threshold (corresponding to 90th percentile of intensities in the 4th ventricle label) as CSF. Volumes from the resulting cerebellar labels were combined to give total cerebellar volume. Volumes from all labels plus additional CSF not covered by the MALP-EM mask (obtained by means of registration and mask propagation with a standard MNI T1 template) were combined to give total intracranial volume. Cerebellar and fourth ventricular volumes were expressed relative to total intracranial volume to give normalised cerebellar (nCblmV) and 4th ventricle (n4VV) volumes. Following testing of normality of data distribution, group comparison was performed using 2-tailed independent sample t-tests, and correlations between volumes, age and neurological disability were performed with Pearson correlation.RESULTS
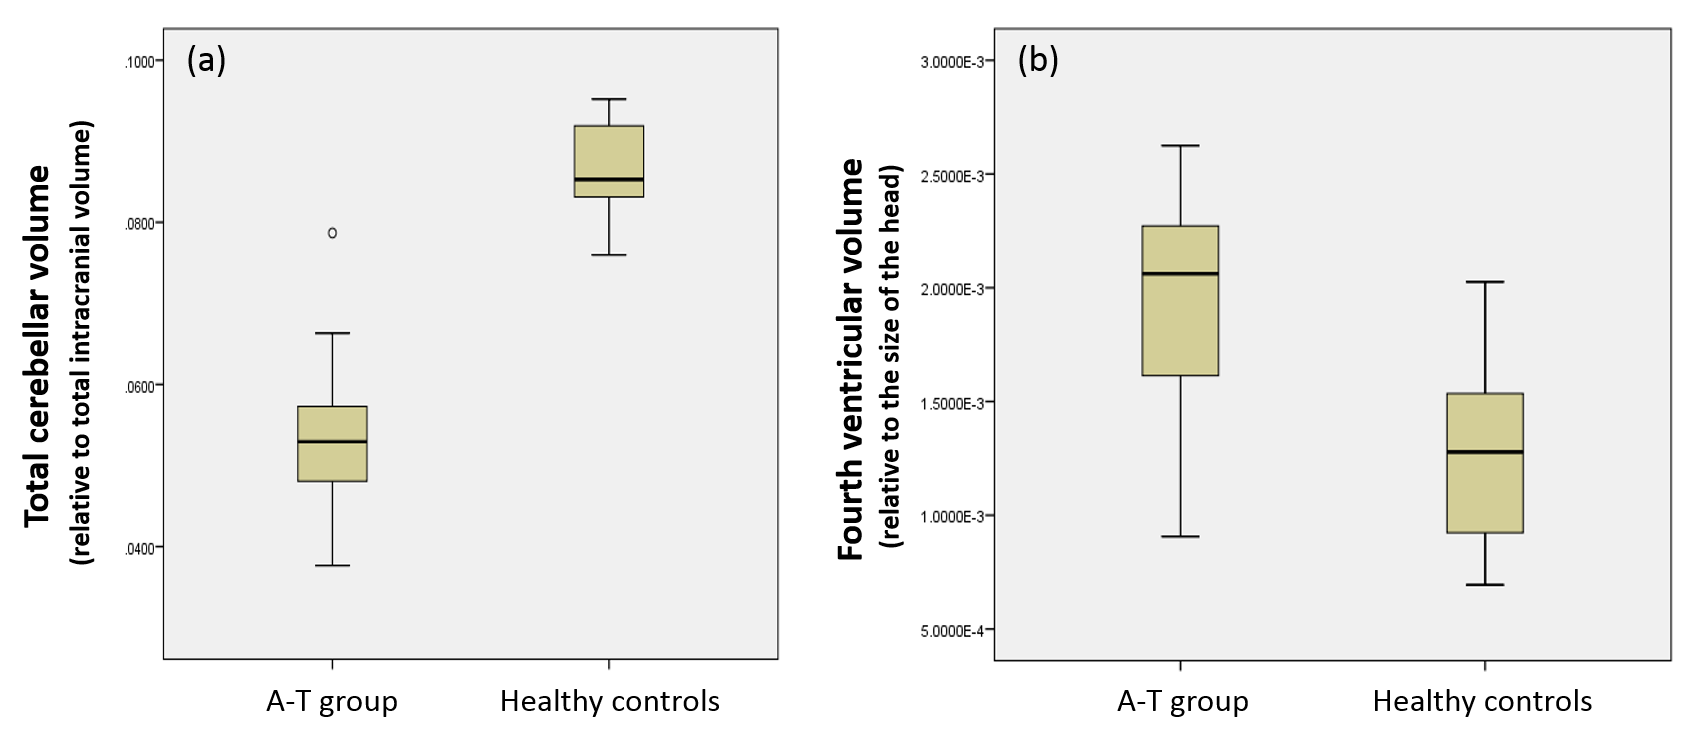
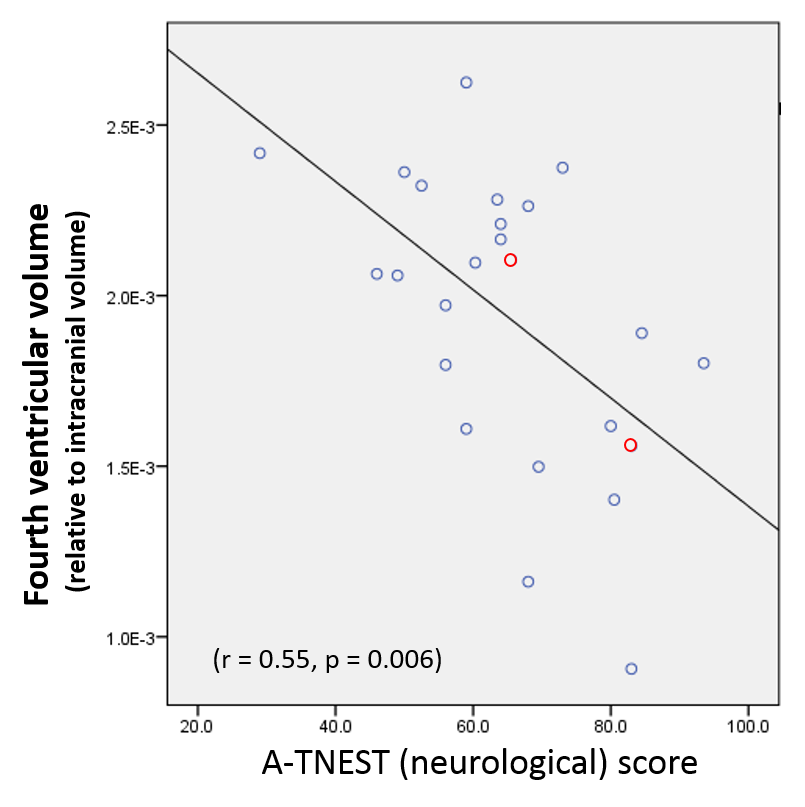
The A-T group comprised 24 children (11 females, median age 10.5 years, range 6.1 to 17.8 years); 22 had A-T and 2 had A-TLD. Median total A-TNEST neurological score was 64% (range 29% to 93.5%). 24 healthy individuals (12 females, median age 11.2 years, range 6.5 to 18.4 years) were recruited. There was no group difference in age distribution (t = -.274. p= .786). nCblmV was significantly lower (5.4% vs 8.7%, p<0.0005) and n4VV significantly higher (1.9% vs 1.3%, p<0.0005) in children with A-T compared to controls (figure 1). nCblmV reduced linearly with increasing age in the A-T group (r=-0.67, P<0.0005), but increased with age in healthy children (r=0.45, p=0.026) (figure 2a); there was a significant difference in the regression slopes between groups (t=-4.7, P<0.0005). n4VV increased significantly with age in the A-T group (r=0.61, p<0.0005), but not in healthy children (r=0.34, P=0.10) (figure 2b). n4VV, but not nCblmV, correlated with neurological disability (r = 0.56, p = 0.004) (figure 3).DISCUSSION
Cerebellar atrophy is the neuroimaging hallmark of A-T, but the clear negative linear relationship between normalized cerebellar volume with age in children with A-T has not to our knowledge been shown previously. Comparison with healthy control data shows significant divergence of trajectory normalized cerebellar volumes with increasing age. Despite the clear age-dependent cerebellar volume loss, we did not find correlation between normalized cerebellar volume and neurological status. Normalized fourth ventricular volumes increased in the A-T group but not healthy controls and correlated with neurological status. Normalized fourth ventricular volumes are likely to reflect atrophy of both the cerebellum and brainstem which may account to the stronger correlation with neurological status. The two children with A-TLD had imaging measures falling within the distribution of the children with classical A-T.CONCLUSION
A significantly different and divergent trajectory of age-related cerebellar volume change is seen in children with A-T compared to normally-developing children. Normalized fourth ventricular volumes may provide a simple imaging marker of neurological status in childhood A-T warranting further investigation.Acknowledgements
We gratefully acknowledge the study funders: A-T Children's Project and Action for A-T. We also thank the A-T Society for their support, and of course the participant's and their families.References
1. Lavin MF. Ataxia-telangiectasia: from a rare disorder to a paradigm for cell signalling and cancer. Nat Rev Mol Cell Biol 2008; 9(10): 759-69.
2. Ditch S, Paull TT. The ATM protein kinase and cellular redox signaling: beyond the DNA damage response. Trends in Biochemical Sciences 2012; 37(1): 15-22.
3. Jackson TJ, Chow G, Suri M, Byrd P, Taylor MR, Whitehouse WP. Longitudinal analysis of the neurological features of ataxia-telangiectasia. Developmental Medicine & Child Neurology 2016; 58(7): 690-7.
4. Ledig C, Heckemann RA, Hammers A, et al. Robust whole-brain segmentation: Application to traumatic brain injury. Medical Image Analysis 2015; 21(1): 40-58.
5. Heckemann RA, Ledig C, Gray KR, et al. Brain Extraction Using Label Propagation and Group Agreement: Pincram. PLoS ONE 2015; 10(7): e0129211.
Figures