2299
Myelin-Water-Imaging in Hypomyelinating Leukodystrophies1Department of Pediatric and Adolescent Medicine, Department of Pediatric and Adolescent Medicine, University Medical Center Goettingen, Goettingen, Germany, 2Department of Neuroradiology, University Medical Center Goettingen, Goettingen, Germany, 3Department of Neuroadiology, University Hospital Carl Gustav Carus, Technische Universität Dresden, Dresden, Germany, 4Department of Cognitive Neurology, University Medical Center Goettingen, Goettingen, Germany, 5Department of Pediatrics and Adolescent Medicine, University Medical Center Goettingen, Goettingen, Germany, 6Advanced Baby Imaging Lab, Brown University School of Engineering, Providence, Providence, RI, United States, 7Department of Radiology, University of Colorado Denver, Denver, CO, United States
Synopsis
Emerging clinical research in hypomyelinating leukodystrophies (HLD) necessitates definition of surrogate markers as endpoints in possible clinical trials. Standardized assessment of myelination using myelin sensitive MRI is therefore highly desirable. Proposed protocols comprise DTI, MT-imaging and myelin water imaging employing the mcDESPOT sequence. We report first experiences applying mcDEPSOT in patients with cerebral folate deficiency. Myelin water fraction (MWF) allowed assessment of subtle gradual and regional changes with sufficient spatial resolution. The extent of the myelin deficit in diffuse hypomyelination can more reliably be evaluated using the MWF parameter. McDESPOT seems a feasible, system independent method to study pediatric HLD.
Target audience: clinicians in the
fields of neuropediatrics, neurology, neuroradiology, as well as clinical MR researchers.
Introduction:
Hypomyelinating leukodystrophies (HLD) constitute the
largest category among childhood white matter (WM) disorders and represent a
genetically heterogeneous, clinically overlapping group. Emerging clinical
research in HLDs necessitates definition of surrogate markers as endpoints in
possible clinical trials. Standardized assessment of myelination using myelin
sensitive MRI is therefore highly desirable [1]. Besides DTI and MT-imaging
myelin water fraction (MWF) imaging has gained significant importance facilitated
by technical improvements of the multi-component driven equilibrium single
pulse observation of T1 and T2 (mcDESPOT) sequence [2]. Consequently, mcDESPOT
has been integrated in our clinical imaging protocol for WM disorders. Here, we
report first clinical experiences investigating patients with genetically
proven HLDs using the sequence.
Subjects and Methods:
The patients included were diagnosed with folate
transport receptor α deficiency due to mutation in the FOLR1 gene (Pat. 1, age 12 yrs, male and 2, age 5 yrs, female) [3].
Pat. 3 (age 3 yrs, male) had a cerebral folate deficiency due to a mutation in
the SLC46A1 gene. A 3T scanner (Tim
TRIO, Siemens Healthcare, Germany) and a 8-channel RF coil were used for all
studies. Multi-component T1 and T2 information were derived from SPGR data (TR/TE/a=5.4/2.5 ms/{3, 4, 5,.6, 7, 9, 13, 18}° und SSFP (TR/TE/a=5.0/2.5 ms/{different angles}, 1.7 mm3 isotropic resolution,
acquisition time ~15 min. Data postprocessing comprised brain extraction
and co-registration (ANTsSPM/FSL) [4] and calculation of MWF maps from SPGR and
SSFP data applying established mcDESPOT theory and processing methods [2]. Maps
were colorcoded as displayed in Fig. 2 (center). For Pats. 2 and 3 the mean MWF
of the whole WM was obtained by applying mcDESPOT fitting algorithm [2]. Z-score
maps were created for Pat.3 by comparing individual values with age-matched
means in brain standard space.
Results:
Pat.1 showed confluent lesions on T1-w and T2-w images
(Fig.1 upper row) which correspond to regions of reduced MWF signal on the MWF map
(Fig 1 middle row). Z-score statistic map (Fig.1 lower row) confirmed the decrease
of MWF signal being most pronounced in the WM lesions. Areas of significant
reduction are represented by the Z<-4 map. The diffuse hypomyelination of
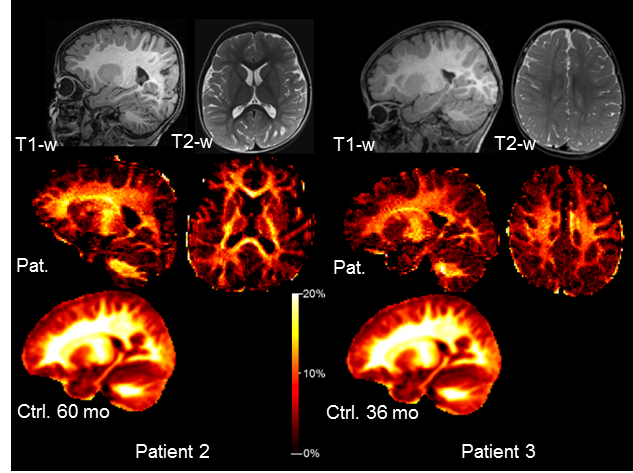
Pat. 2 and 3 is best appreciated on T2-w image (Fig 2, upper row). The MWF
signal was diminished throughout the entire WM of both patients as displayed in
Fig. 2 (middle row) which is emphasized by comparing the patients maps to age
matched control templates from the Advanced Baby Imaging
Lab (Fig. 2, lower row). Mean MWF values (±SD) of global WM
were: Pat. 2: 8.4% (±0.03), control template 60 months (mo): 12.2% (±0.05);
Pat. 3: 9.1% (±0.03), control template 36 mo: 11.8% (±0.05).
Discussion
and Conclusion:
MWF allowed detailed assessments of myelination in
hypomyelinating conditions. Subtle gradual changes of MWF signal could be
appreciated on the maps with sufficient spatial resolution. The extent of the
myelin deficit can more reliably be evaluated using the MWF as can be seen Pats.
2 and 3 were overall MWF signal was surprisingly low considering the WM signal
intensity of the T1-w images. mcDESPOT seems a feasible, system independent method
to study pediatric HLD. The myelin specific parameters obtained will be of high
importance for studying myelination and effects of therapies on myelination.
Acknowledgements
No acknowledgement found.References
1. Pouwels P et al. Ann Neurol 2014;76:5; 2. Deoni S et al. Magn Reson Med 2008;6:1372. 3. Steinfeld R et al. Am J Hum Genet 2009;85:354. 4. Kitzler H et al. NeuroImage 2012;59:2670.Figures