2297
BOLD MR Imaging of Placenta in Congenital Heart Disease1Radiology, University of Pittsburgh, Pittsburgh, PA, United States, 2Radiology, Children's Hospital of Pittsburgh UPMC, Pittsburgh, PA, United States, 3Radiology, University of Pittsburgh Medical Center, Pittsburgh, PA, United States, 4Obstetrics, Gynecology and Reproductive Sciences, University of Pittsburgh Medical Center, Pittsburgh, PA, United States, 5Radiology, Children's Hospital of Los Angeles, Los Angeles, CA, United States, 6Epidemiology, University of Pittsburgh, Pittsburgh, PA, United States
Synopsis
We examined whether features of placental BOLD MRI in underlying setting of fetal congenital heart disease (CHD) differ from those of healthy controls, and the imaging data correlated with first trimester maternal serum markers (PAPP-A, β-hCG) known to influence vasculogenesis/angiogenesis. We explored correlation between fetal brain resting stat networks and imaging and hormonal biomarkers of the placenta. We used temporal, spatial, and spatio-temporal to analyze the squared-root-mean variance and distribution differences in BOLD signal between CHD and controls. Difference in spatial and temporal BOLD signal variance is present in CHD pregnancies compared to healthy controls were observed.
Introduction
Complex congenital heart disease (CHD) has been linked to structural and metabolic abnormalities in fetal brain development1,2. One concern in CHD is absence of normal levels of oxygenation to the fetus. Recent studies have shown impairment of placental function in congenital heart disease (CHD), possibly secondary to a placental vasculogenesis/angiogenesis abnormality3. Placental blood oxygen level dependent (BOLD) may serve as a viable imaging proxy measure of placental oxygenation and vascularity in utero. In this study we tested the hypotheses: (1) features of placental BOLD MRI in fetal CHD differ from those of healthy controls, (2) levels of first trimester maternal serum markers of placental origin (PAPP-A, β-hCG), known to influence vasculogenesis/angiogenesis, are correlated with third trimester specific placental BOLD characteristics, and (3) there is correlation between previously reported fetal brain resting state networks (RSNs) (ISMRM 2016), and the aforementioned imaging and hormonal placental biomarkers.Materials and Methods
As part of a prospective longitudinal study on fetal and neonatal brain imaging in CHD, dedicated placental and fetal BOLD MR imaging on 15 CHD and 14 healthy control maternal subjects were obtained using a 3T Skyra (Siemens, Ehrlangen Germany) with the following sequence parameters: FOV=256mm TE/TR=32/2200 ms with an in-plane resolution of 4x4 mm2 and slice thickness of 4mm with 4mm space. Due to dielectric artifact related to maternal obesity/motion, 4 CHD and 1 control were excluded leaving 11 CHD (GA=34.7±2.5 wks) and 13 control (GA=32.9±2.3 wks) in the analysis. Both the total volume of the placenta and fetal brain were manually extracted using volume of interest mask which was then applied to the successive frames in the time series. Each frame was manually checked and any volume with discrepancies due to motion artifacts were adjusted or excluded.
Placental BOLD values (normalized to signal from adjacent amniotic fluid), including average, standard deviation, and fractional signal changes from global mean were quantitated using software developed in-house in MATLAB4 and IDL5. Temporal, spatial, and spatio-temporal squared-root-mean variance of these metrics were calculated. Additional analysis on histogram-based distribution differences were conducted using a two-sample Kolmogorov-Smirnov non-parametric test. These temporal, spatial, and spatio-temporal relationships were further studied within the context of maternal serum biomarkers, with a median split of PAPP-A and β-hCG values collected in the first trimester.
For correlation with fetal brain, the signal variance values originating from the frontal, posterior and sensory-motor RSNs, previously characterized from ICA analysis (MELOCID, FSL6) were used.
Results
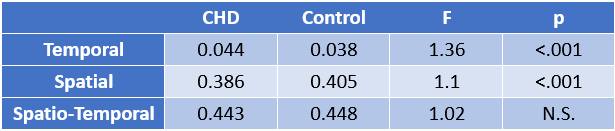
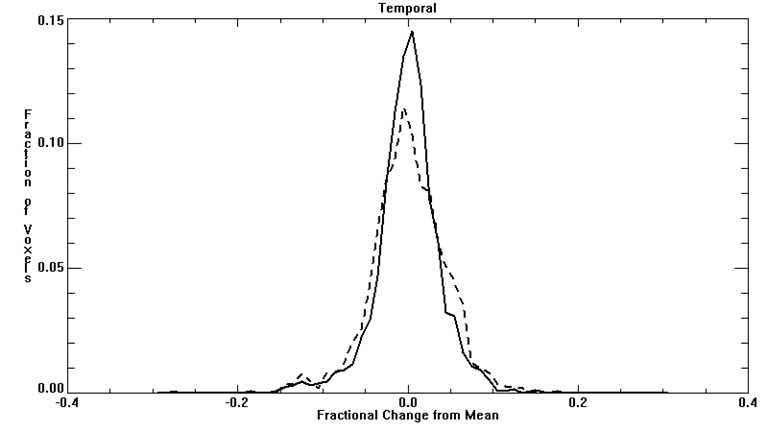
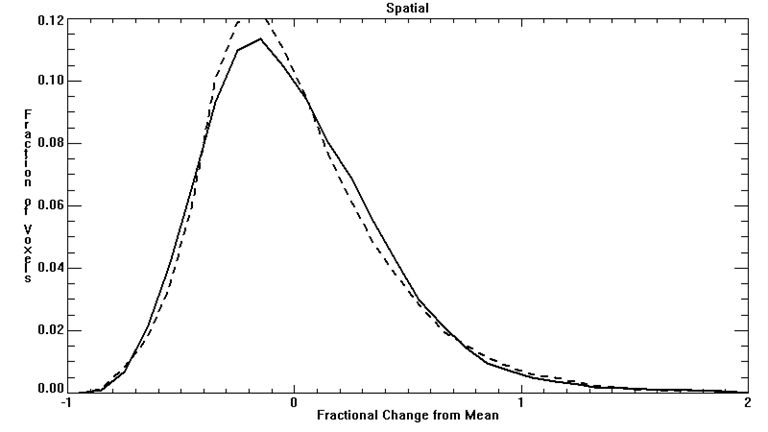
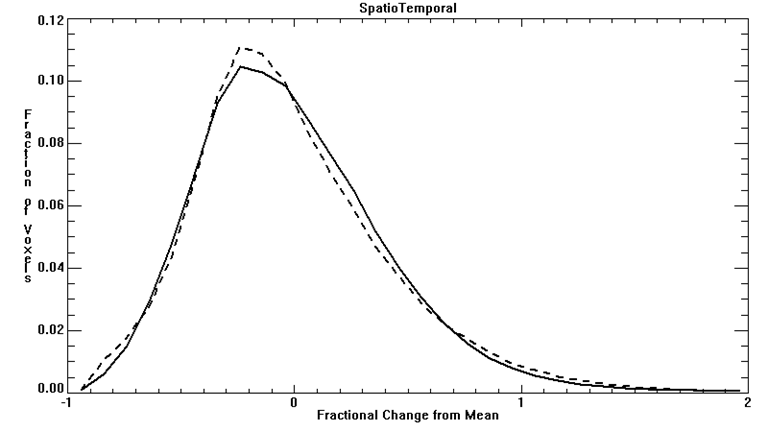
Demographic factors were similar between CHD and control groups (maternal and gestational age at imaging). Average BOLD signal for the entire VOI did not significantly differ between CHD and controls. However, temporal and spatial variability in BOLD signal (square root of mean variance) significantly differed, with CHD’s having greater temporal variance (p<0.001) and smaller spatial variance (p<0.001) compared to controls (Table 1). This difference is further supported by the K-S test, where the distribution showed CHDs with wider variance in the Temporal histogram (Figure 1; D=0.79, p<0.002), and narrower variance in the Spatial histogram (Figure 2; D=0.18, p<0.001). Consequently, when considering spatial and temporal variances together, the CHDs and controls showed comparable spatio-temporal variance (CHD=44.3% vs Controls=44.8%). However, their distributions are significantly different with CHD having a more leptokurtic distribution than controls (Figure 3; D=0.018, p<0.001).
High spatial and temporal variability differences in BOLD signal were seen in placentas within the low β-hCG (<50th percentile) group (p<0.001 and p<0.001, respectively), and in the high PAPP-A (>50th-percentile) group (p<0.001 and p<0.001, respectively).
Correlation between signal variance from fetal brain ICA and placental bold showed association between high standard deviation (of normalized placental BOLD) and high variance in Frontal (p=0.024) and Posterior (p=0.036) RSNs. Similar regression analysis showed with CHD status and maternal serum biomarkers showed, CHD having higher Posterior RSN variance (p=0.038) and higher PAPP-A associated with lower Posterior RSN variance (p=0.020). However, further post-hoc analysis using generalized linear regression showed no association between RSNs and placental BOLD within the context of CHD status or maternal serum biomarkers.
Discussion
Difference in spatial and temporal BOLD signal variance is present in CHD pregnancies compared to healthy controls, suggesting altered placental function related to both oxygenation (temporal) and vascular anatomy (spatial). Low β-hCG and high PAPPA-A levels were present along with the differences in spatial variance of placental BOLD signal supporting the hypothesis that intrinsic vasculogenesis/angiogenesis abnormality may exist in CHD. The correlation between fetal and placental BOLD variance as well as maternal serum biomarkers bear further investigation with simultaneous fetal-placental BOLD coupling studies.Acknowledgements
No acknowledgement found.References
[1] Limperopoulos, C., Tworetzky, W., McElhinney, D.B., Newburger, J.W., Brown, D.W., Robertson, R.L., Guizard, N., McGrath, E., Geva, J., Annese, D. and Dunbar-Masterson, C., 2010. Brain volume and metabolism in fetuses with congenital heart disease evaluation with quantitative magnetic resonance imaging and spectroscopy. Circulation, 121(1), pp.26-33.
[2] Paquette, L.B., Wisnowski, J.L., Ceschin, R., Pruetz, J.D., Detterich, J.A., Del Castillo, S., Nagasunder, A.C., Kim, R., Painter, M.J., Gilles, F.H. and Nelson, M.D., 2013. Abnormal cerebral microstructure in premature neonates with congenital heart disease. American Journal of Neuroradiology, 34(10), pp.2026-2033.
[3] Lim, J., Muthusami, P., Madathil, S., Zhu, M., Saini, B.S., Porayette, P., Chau, V., Portnoy, S., Macgowan, C., Sled, J.G. and Kingdom, J.C., 2016. OC25. 01: Cerebral oxygen delivery, brain growth and white matter maturation are reduced in congenital heart disease fetuses. Ultrasound in Obstetrics & Gynecology, 48(S1), pp.44-45.
[4] (MATLAB 2015b, The MathWorks Inc., Natick, MA, USA)
[5] Exelis Visual Information Solutions. 2010. Name of the manual. Boulder, Colorado: Exelis Visual Information Solutions. pages used.
[6] Jenkinson, M., Bannister, P., Brady, M. and Smith, S., 2002. Improved optimization for the robust and accurate linear registration and motion correction of brain images. Neuroimage, 17(2), pp.825-841.
Figures