2295
Constrained spherical deconvolution has the potential to better characterize neuronal structure in Cerebral Palsy before and after therapy.1Biomedical Engineering, University of Arizona, Tucson, AZ, United States, 2Phoenix Children's Hospital, Phoenix, AZ, United States, 3Pediatrics, University of Arizona, Tucson, AZ, United States
Synopsis
Cerebral Palsy is a nonprogressive condition that results in very heterogenous motor and other deficits that usually arises during the peripartum period. Many studies have tried to characterize changes in the brain of patients with cerebral palsy using fractional anisotropy and tractography based on diffusion tensor imaging, but few have utilized any of the more recent techniques, such as constrained spherical deconvolution, to more adequately account for complex fiber structures. These more recent techniques also offer more descriptive scalar measures of microstructure, such as apparent fiber density, that can be used to better characterize changes in neural structure.
Purpose
High angular resolution diffusion imaging (HARDI) provides increased ability to distinguish complex tissue architecture over diffusion tensor imaging (DTI)1. Despite the ability of HARDI to provide more accurate descriptions of axon fiber crossing, and therefore better inform tractography algorithms, many clinical studies investigating Cerebral Palsy using diffusion MRI still employ the DTI2,3,4 This preliminary work aims to demonstrate the ability of constrained spherical deconvolution (CSD), a common HARDI technique, to more completely map out corticospinal pathways in a child with Cerebral Palsy before and after physical therapy. In addition, we highlight the potential utility of the scalar parameter, apparent fiber density, derived from CSD5Methods
Two patients, a 2 year old female subject, and a 15 month old male subject, diagnosed with cerebral palsy, were scanned pre (immediately) and post (36 weeks) physical therapy. The MRI protocol included a 64-direction, b = 1000 s/mm2 single shot EPI diffusion MRI sequence with 6 b = 0 s/mm2 volumes interspersed for motion correction. The resolution of the dMRI is 2.25 mm isotropic, with a TR/TE of 8150/109 ms. One b = 0 s/mm2 was collected with a reversed phase encode direction for EPI distortion correction. A T1-weighted image was collected for anatomical reference with 0.9mm isotropic resolution. Diffusion-MRI data was processed using FSL’s TOPUP6 and EDDY7 for distortion correction, LPCA denoising8 was performed using MATLAB 2015b, and constrained spherical deconvolution, diffusion tensor fitting, fractional anisotropy and apparent fiber density calculation, and probabilistic tractography were performed using MRtrix31,5,9,10,11.
The above two patients are a part of a larger study in which patients are placed into one of two groups. The first group receives 12 weeks of Intensive Perception-Action Physical Therapy (IPAPT), 5 days a week for 30 minutes a day, followed by 36 weeks of standard of care physical therapy twice a week. The second group receives 36 weeks of standard of care physical therapy, followed by 12 weeks of (IPAPT). Due to the preliminary nature of this work, we are still blinded to which group the above patients belong.
Results
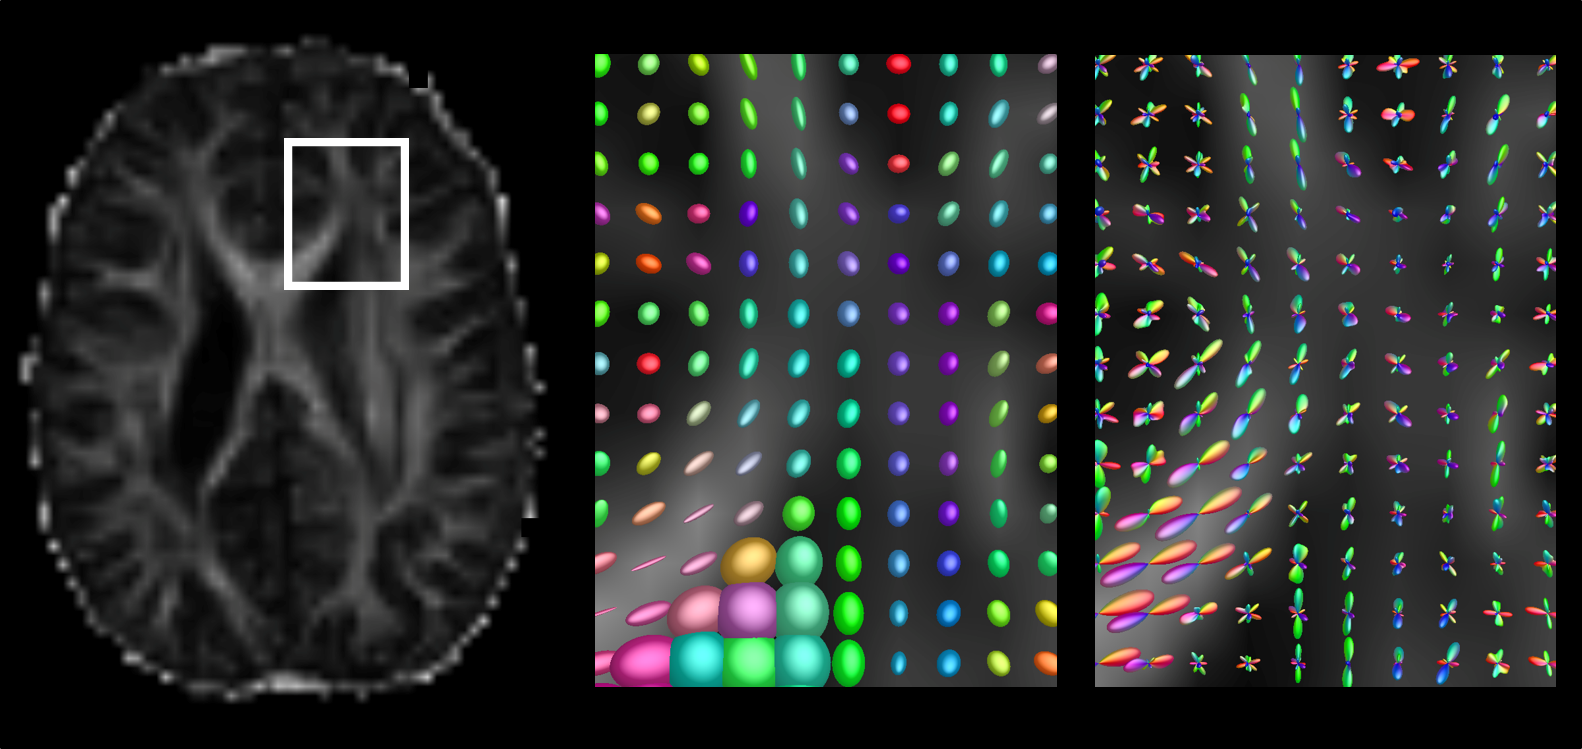
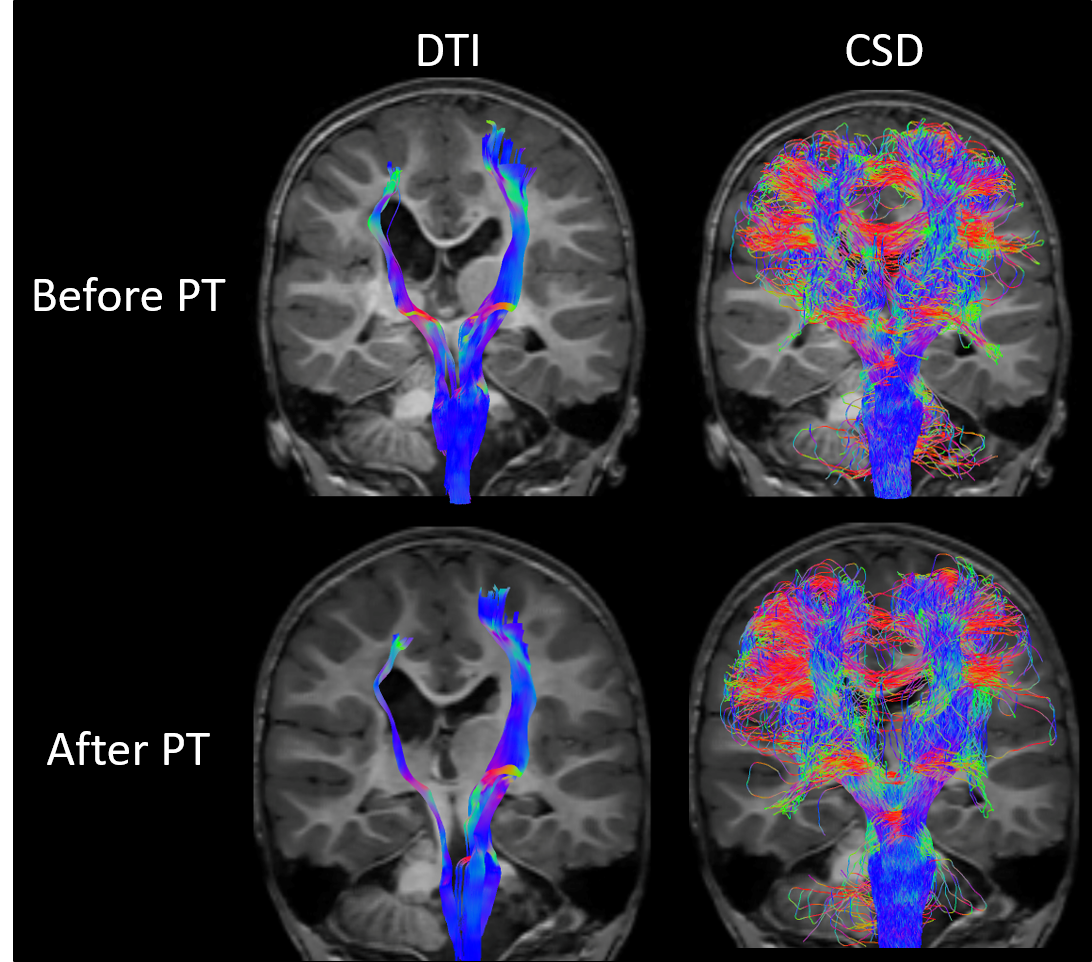
Figure 1 demonstrates the now well-known concept that diffusion tensor imaging fails to capture more complex nature of diffusion in voxels containing more than one fiber population. Both tensors and fiber orientation distributions (FODs) in the corpus callosum accurately portray the diffusion process in those voxels, but the tensors in the centrum semiovale take on a more planar appearance, failing to capture the crossing fiber architecture. Figure 2 builds upon this idea by showing the probabilistic tractograms produced using the diffusion tensor model, and constrained spherical deconvolution. The DTI-based tractography shows pathways that only reach the superior-medial cortical regions. The CSD-based tractography more fully covers the entire motor cortex. Only tractograms and tensor/FOD fields for the 2 year old female are shown.
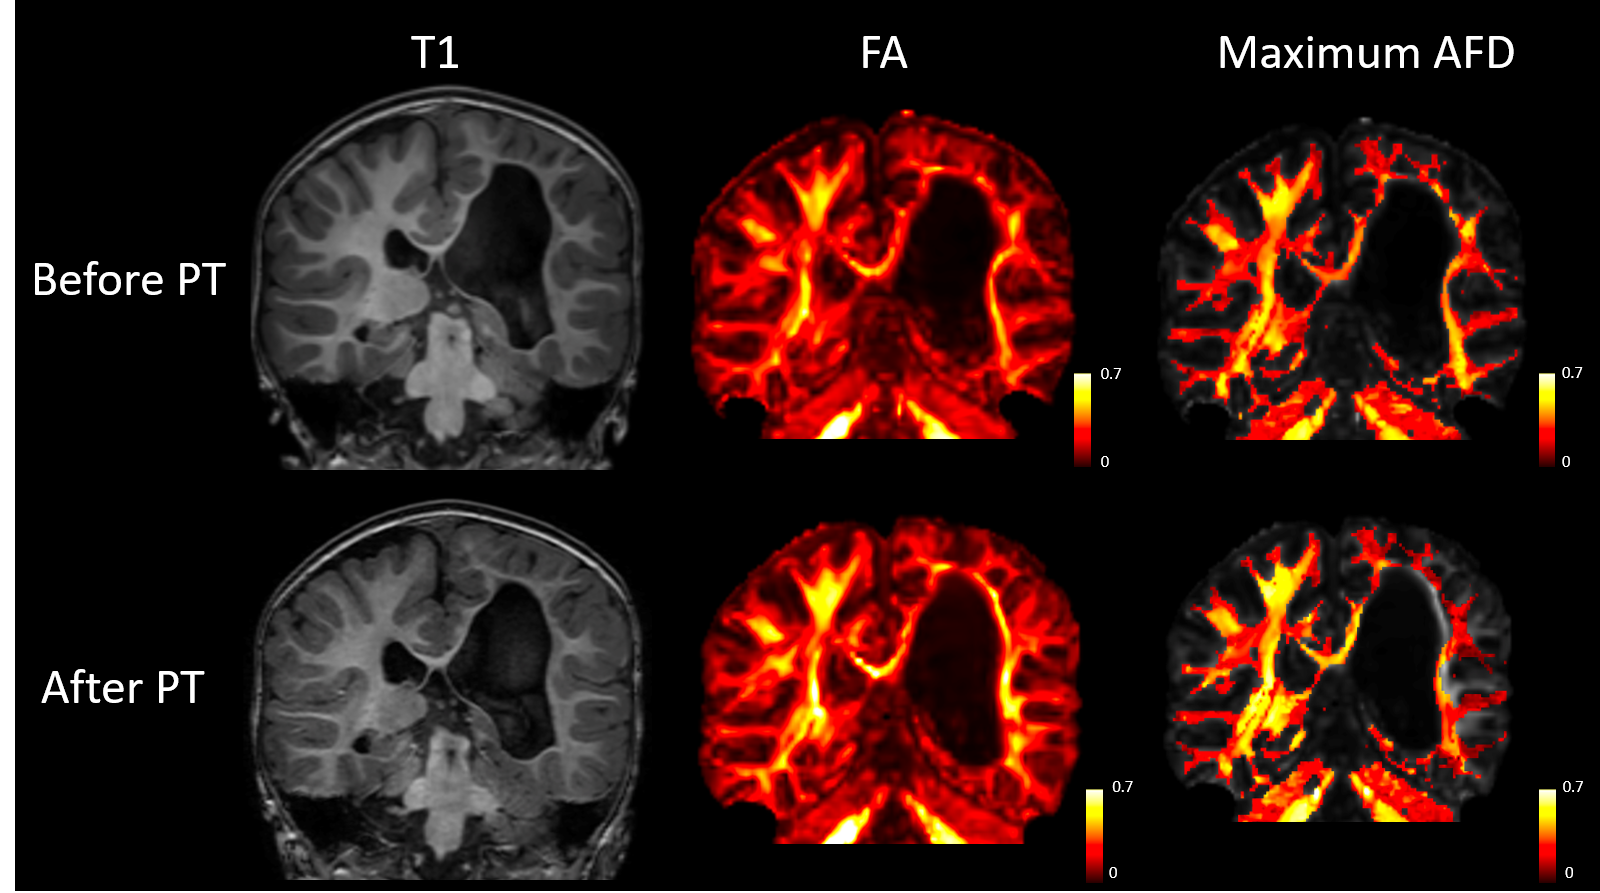
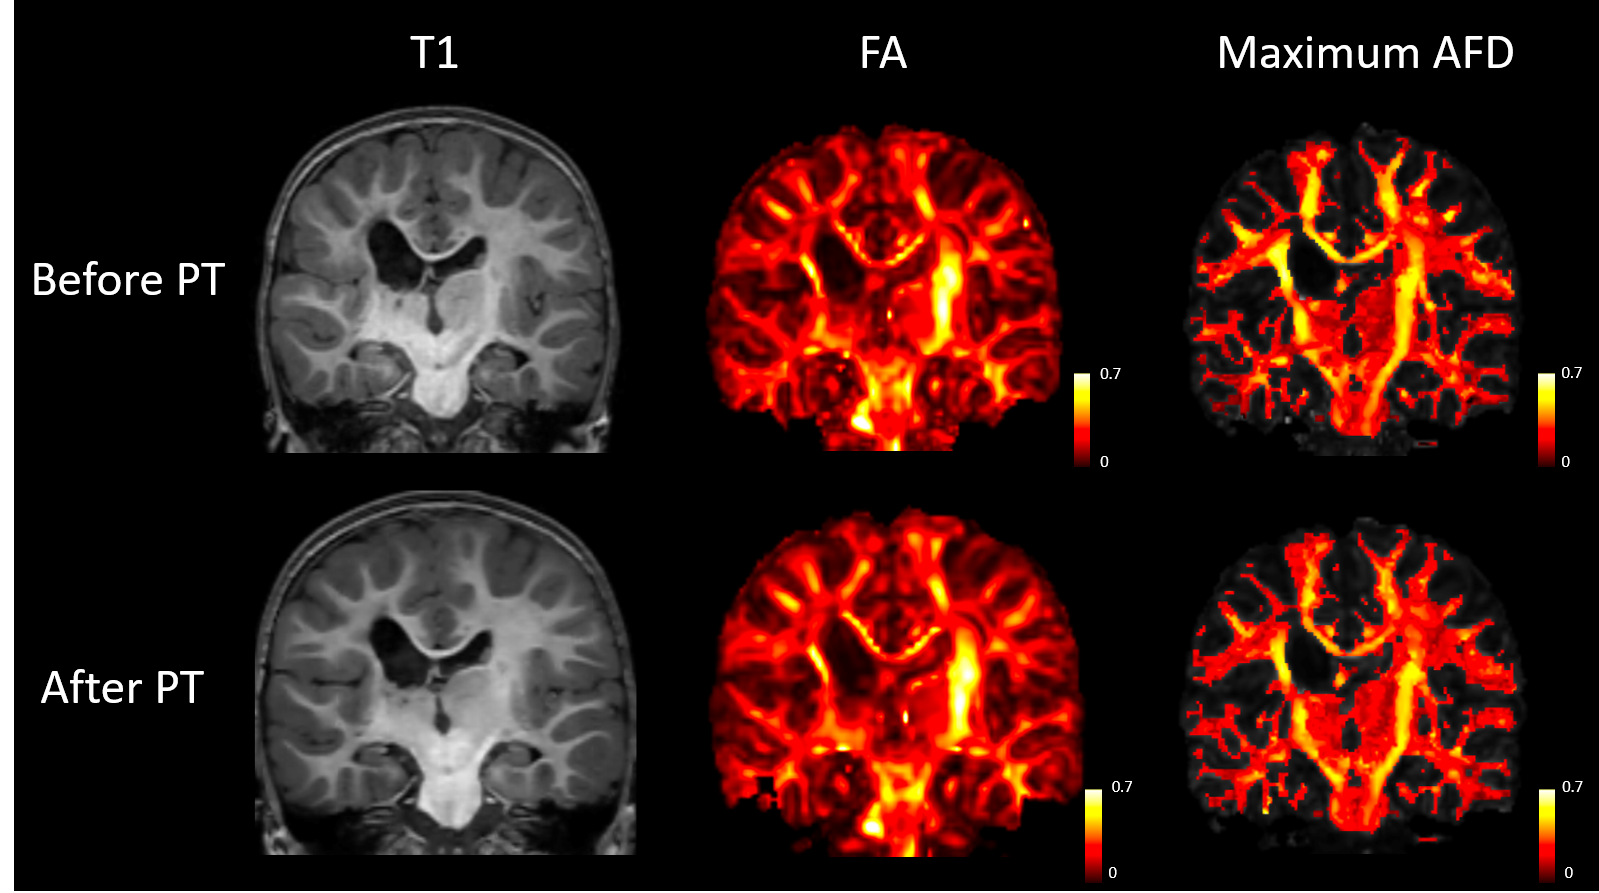
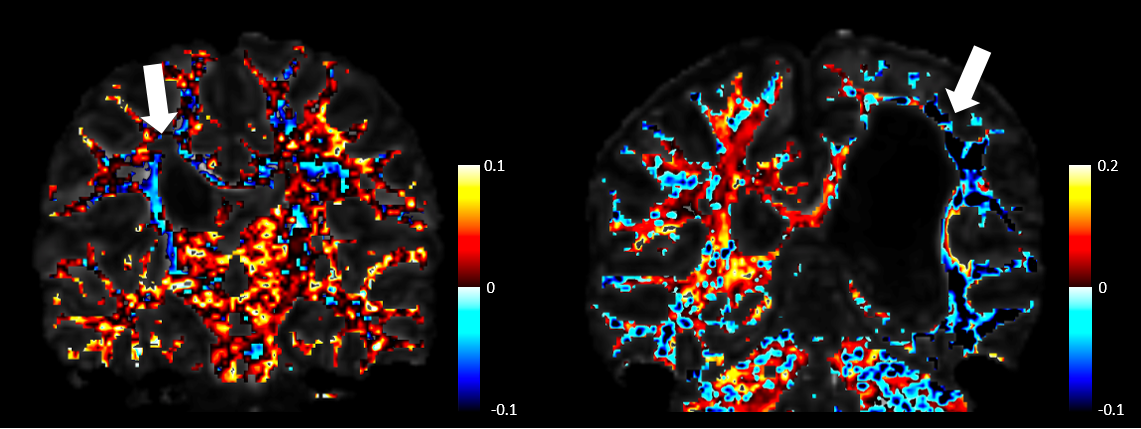
As seen in figures 3 and 4, differences in T1-weighted images are very difficult to observe before and after therapy in both patients. In addition, fractional anisotropy maps look very similar before and after therapy. The maximum apparent fiber density within each voxel appears to very closely mimic fractional anisotropy. Both are shown using a heat map for ease of comparison. Figure 5 shows the absolute difference in maximum apparent fiber density on a voxel-wise basis. In both patients, it appears that there is a general decrease in fiber density on the affected side of the brain following physical therapy and a general increase in fiber density on the unaffected side of the brain.
Discussion
While differences in FA can and have been used to describe differences in neural structure following physical therapy, FA is not a very specific measure, and changes in FA cannot be attributed to any single process. Apparent fiber density, on the other hand, provides a direct estimate of cross sectional area of axon populations in each voxel, which can be more easily used to describe structural changes in the brain associated with changing motor ability in children before and after physical therapy. While this work is preliminary, and the structural and phenotypical heterogeneity of cerebral palsy introduces several challenges in analysis pipelines, we think it indicates that scalar measures that account for more complex structures within the brain, such as the apparent fiber density, can provide better insight into disease processes and the structural changes in the brain that accompany them.Acknowledgements
NIH Grant R01 HD079498References
1. Tournier, J. D., Calamante, F., & Connelly, A. (2007). Robust determination of the fibre orientation distribution in diffusion MRI: Non-negativity constrained super-resolved spherical deconvolution. NeuroImage, 35(4), 1459–1472.
2. Englander, Z. A., Sun, J., Case, L., Mikati, M. A., Kurtzberg, J., & Song, A. W. (2015). Brain structural connectivity increases concurrent with functional improvement: Evidence from diffusion tensor MRI in children with cerebral palsy during therapy. NeuroImage: Clinical, 7, 315–324.
3. Schertz, M., Shiran, S. I., Myers, V., Weinstein, M., Fattal-Valevski, A., Artzi, M., … Green, D. (2015). Imaging Predictors of Improvement From a Motor Learning-Based Intervention for Children With Unilateral Cerebral Palsy. Neurorehabilitation and Neural Repair. Neurorehabilitation and Neural Repair, 30(7), 647-660
4. Arrigoni, F., Peruzzo, D., Gagliardi, C., Maghini, C., Colombo, P., Servodio Iammarrone, F., … Turconi, A. C. (2016). Whole-brain DTI assessment of white matter damage in children with bilateral cerebral palsy: Evidence of involvement beyond the primary target of the anoxic insult. American Journal of Neuroradiology, 37(7), 1347–1353.
5. Raffelt, D., Tournier, J. D., Rose, S., Ridgway, G. R., Henderson, R., Crozier, S., … Connelly, A. (2012). Apparent Fibre Density: A novel measure for the analysis of diffusion-weighted magnetic resonance images. NeuroImage, 59(4), 3976–3994.
6. J.L.R. Andersson, S. Skare, J. Ashburner How to correct susceptibility distortions in spin-echo echo-planar images: application to diffusion tensor imaging. NeuroImage, 20(2):870-888, 2003.
7. Jesper L. R. Andersson and Stamatios N. Sotiropoulos. An integrated approach to correction for off-resonance effects and subject movement in diffusion MR imaging. NeuroImage, 125:1063-1078, 2016.
8. J. V. Manjon, P. Coupé, L. Concha, A. Buades, D. L. Collins, M. Robles. Diffusion Weighted Image Denoising using overcomplete Local PCA. PLoS ONE 8(9): e73021.
9. Tournier, J.-D.; Calamante, F. & Connelly, A. Improved probabilistic streamlines tractography by 2nd order integration over fibre orientation distributions. Proceedings of the International Society for Magnetic Resonance in Medicine, 2010, 1670
10. Jones, D. Tractography Gone Wild: Probabilistic Fibre Tracking Using the Wild Bootstrap With Diffusion Tensor MRI. IEEE Transactions on Medical Imaging, 2008, 27, 1268-1274
11. Basser, P. J.; Mattiello, J. & Lebihan, D. MR diffusion tensor spectroscopy and imaging. Biophysical Journal, 1994, 66, 259-267
Figures