2293
Multi-parametric brain morphometry using a big data approach1Laboratory of Neuro Imaging, Keck School of Medicine of USC, Los Angeles, CA, United States, 2Laboratory of Neuro Imaging
Synopsis
Many studies have explored the relationship between neuroanatomical measures (such as cortical thickness or surface area) and cognition or health. Conventionally, generalized linear models are used to identify between-group differences within single measurements (e.g., regional cortical thickness), which ignores the possible interaction between neuroanatomical features. Incorporating a large number of regressors is not recommended in regression analyses, mainly due to the curse of dimensionality [1]. Multi-parametric classification approaches can be used to ameliorate the latter issue and to capture brain complexity [2]. The down side is that these approaches have less interpretability compared to regression techniques –because these techniques primarily focus on prediction accuracy rather than building an interpretable model. Here we present an approach that enables multi-parametric regression analysis by employing big data routine.
Purpose
We demonstrate the application of a ‘big data’ approach to enable multi-parametric regression analysis of brain morphology and test it on PNC neurodevelopment study cohort. We aimed to gain detailed morphological insight about neurodevelopmental differences across gender. Therefore, we explored the interaction between multi-parametric brain structural information. We used a dataset that consists of structural MRI and demographic information of 997 subjects and performed a novel processing routine.Method
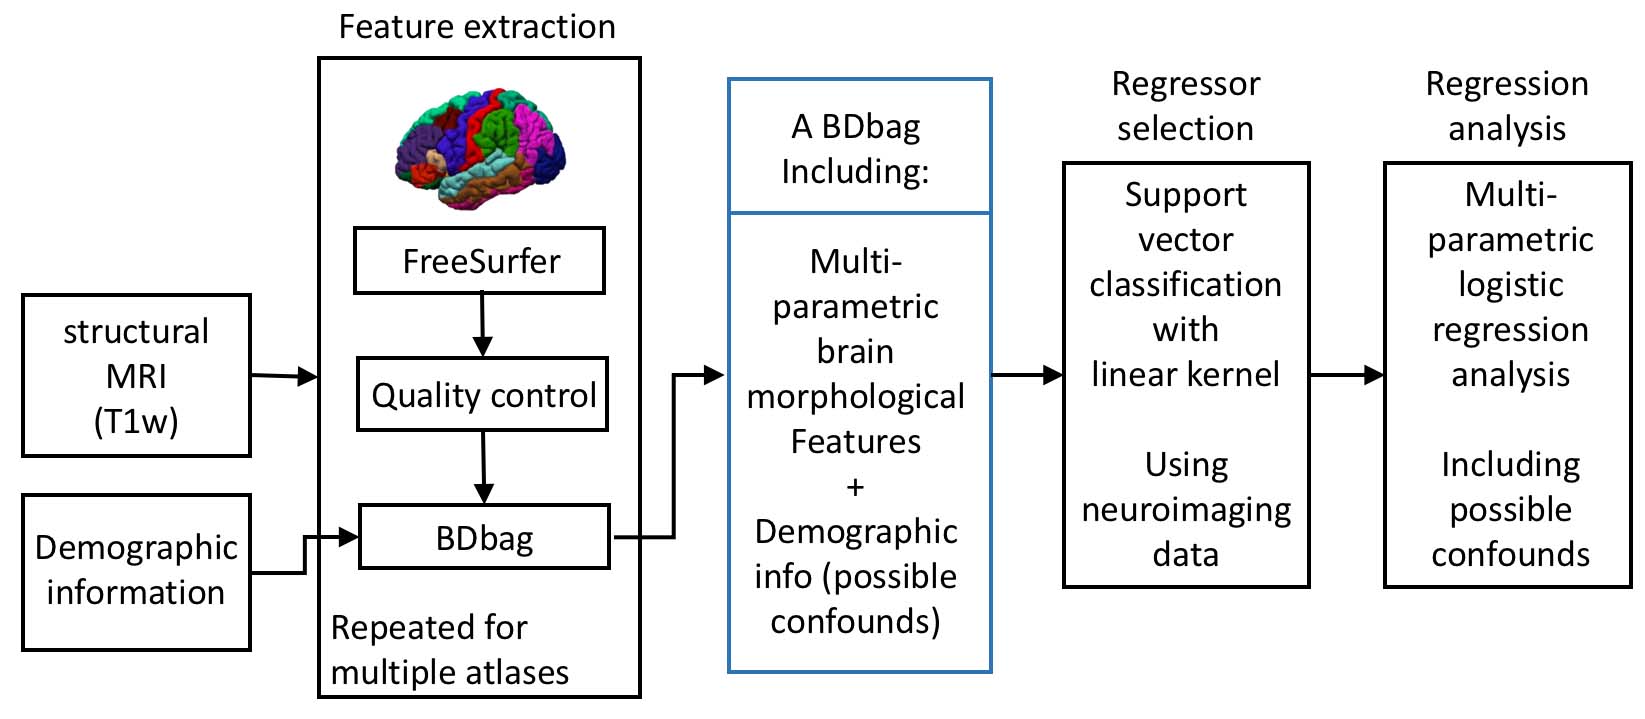
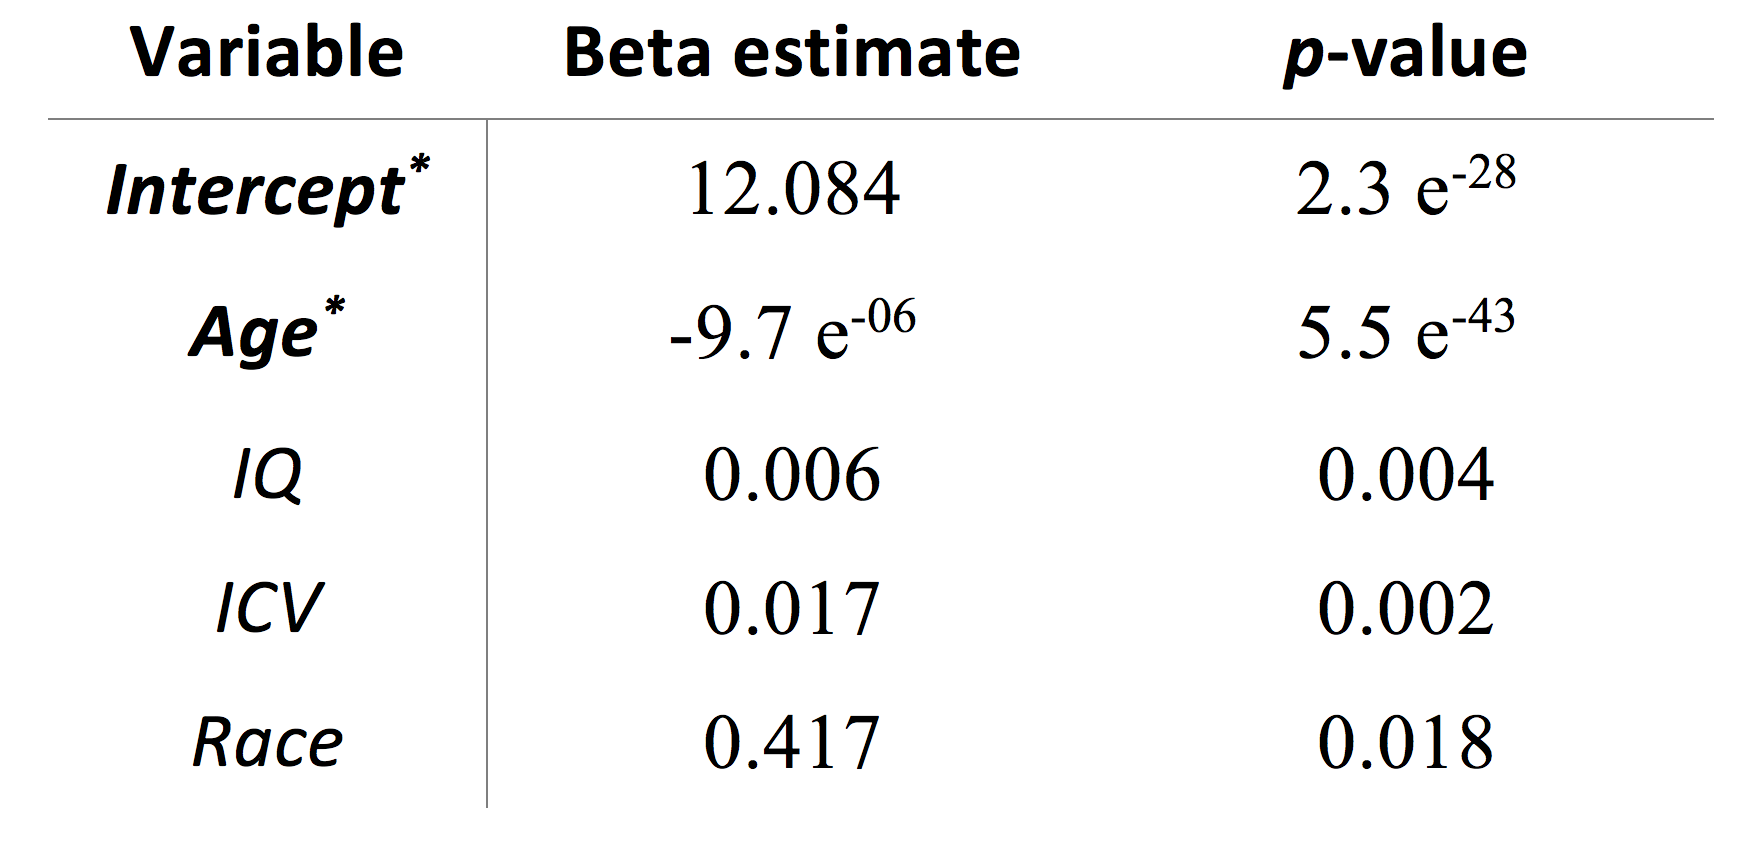
The big data approach that was carried out is summarized in Figure 1. In brief: Data: 997 subjects from PNC study [3,4], in the age range of 8 to 21 years (512 female). Pre-processing and data management: Morphological features were extracted using FreeSurfer (v5.3.0) software package (http://surfer.nmr.mgh.harvard.edu/). Processing was performed using LONI pipeline system (http://pipeline.loni.usc.edu) [5,6]. The extracted cortex in each individual subject was visually inspected, and any inaccuracies in different steps of processing were manually corrected and re-inspected. Data management was carried out using Deriva Scientific Data Asset management system (http://bd2k.ini.usc.edu/education/software/), which decreases the chance of researcher data management errors and also increases reproducibility. Data (including neuroimaging data and demographic information) was then retrieved using BDbag tool (http://bd2k.ini.usc.edu/tools/bdbag/), which tracks data provenance, ensures data integrity, and streamlines the transfer of very large data sets. Feature space and response: All morphological features such as cortical thickness, volume, folding, and surface area (both mean and std) from different atlases (listed in Fig 2) were put together, leading to a matrix of 997x2087 (997 subjects and 2087 brain morphological features). Gender was assigned as the “outcome” to predict. Classification-informed regressor selection: Support vector classifier was trained on the above data to predict gender. All features were standardized. Linear kernel was used to enable regressor selection based on feature’s discrimination power. Equal importance weight was assigned to all features. Sequential minimizer optimization with 1000 iterations was utilized to minimize the cost function. 5-fold cross-validation technique was used to measure classification performance. Classification performances were evaluated based on prediction accuracy, false positive (FP) and true positive (TP) rates, and the area under the curve (AUC). Prediction performances were compared first (liberally) against chance (51% given the gender distribution) and then (conservatively) against prediction performance of a data consisting of age, race, IQ and ICV as features (prediction accuracy = 68%, FP = 0.26, TP = 0.71, AUC = 0.81). Feature space and dimensionality: We also tested support vector classification on multi-parametric features derived from individual atlases and compared their performances against the full dataset that included all atlases. Multi-parametric regression: Informative regressors were extracted from support vector beta estimates. Five features with highest absolute beta value (accounting for weights bigger than 99.5 percentile) were selected, combined with possible confounds (age, race, IQ and ICV), and undergone logistic regression.Result and discussion
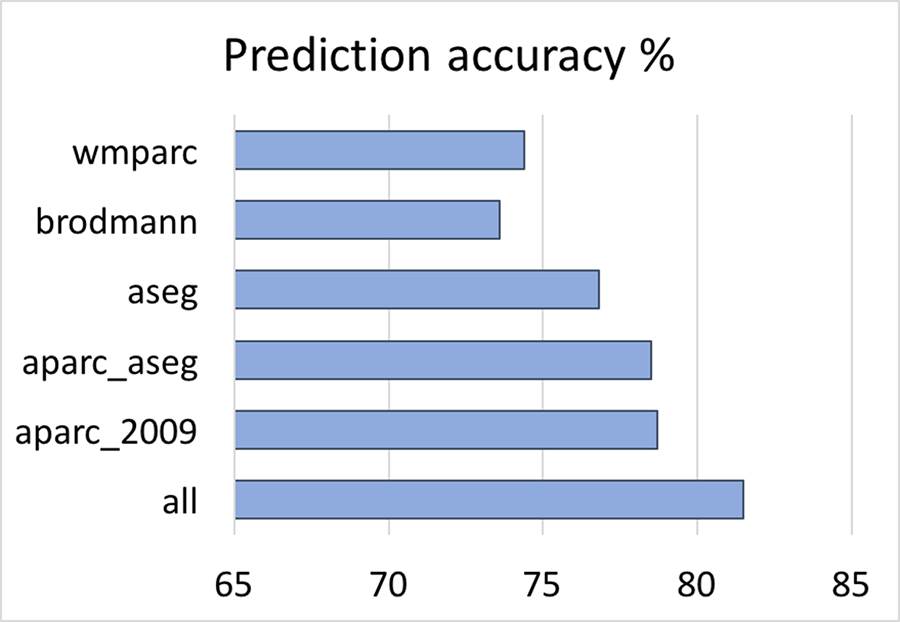
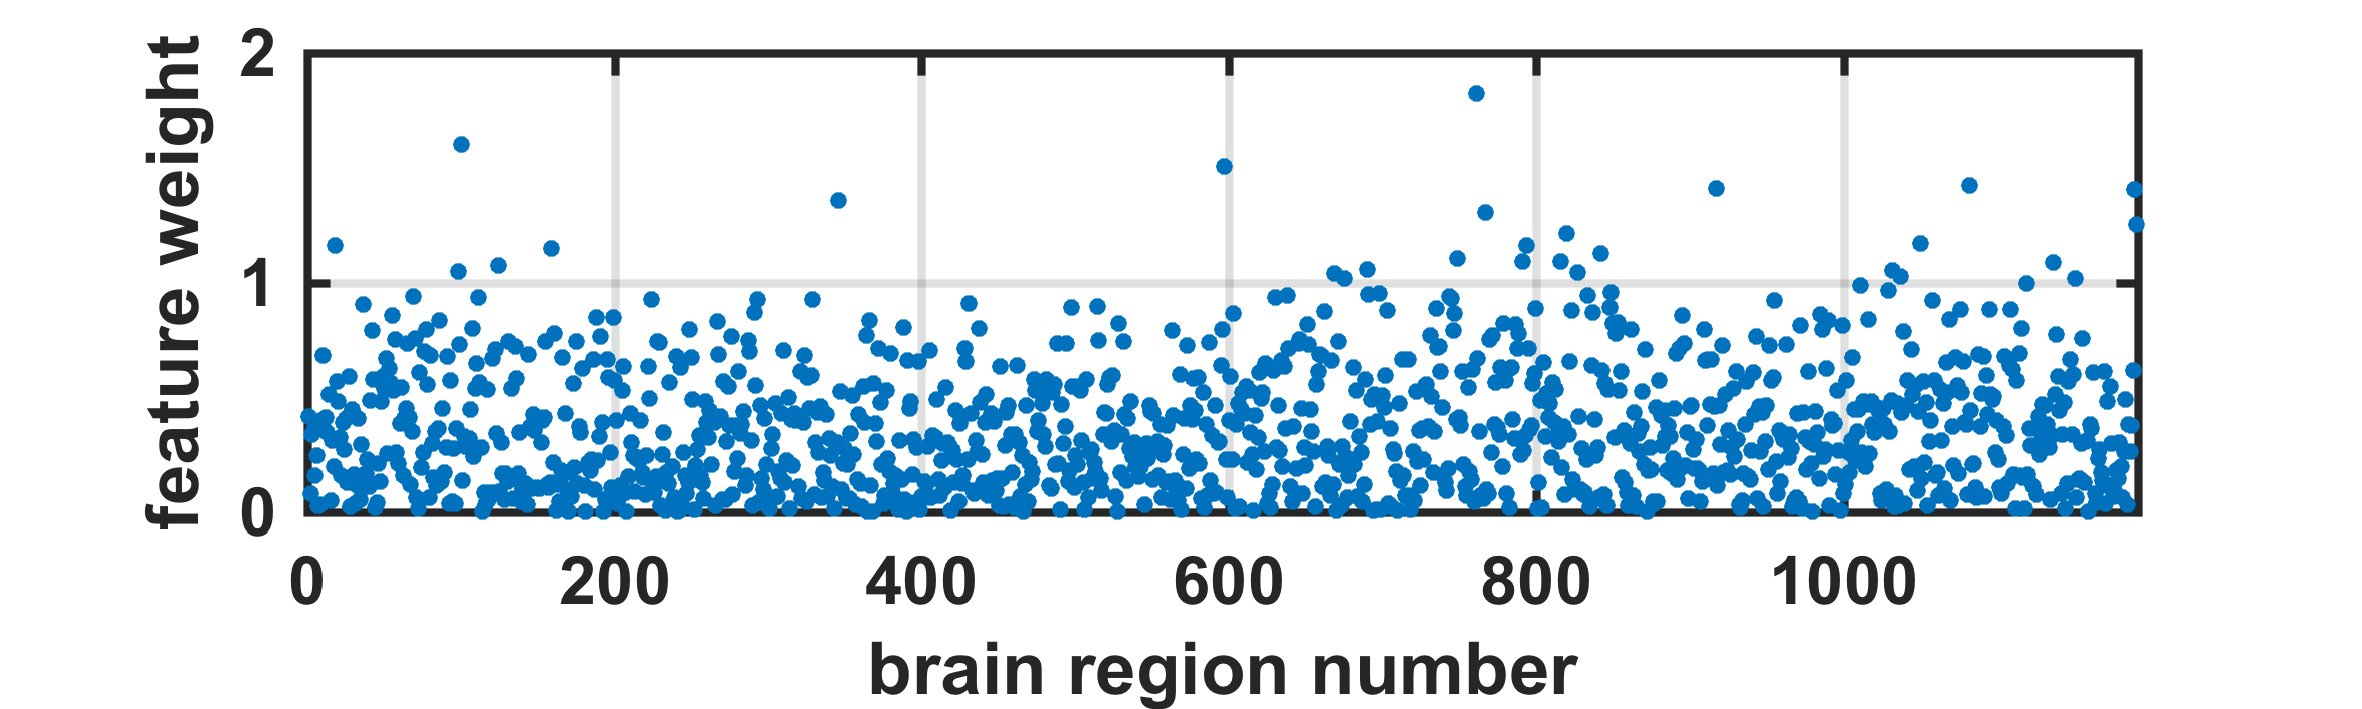
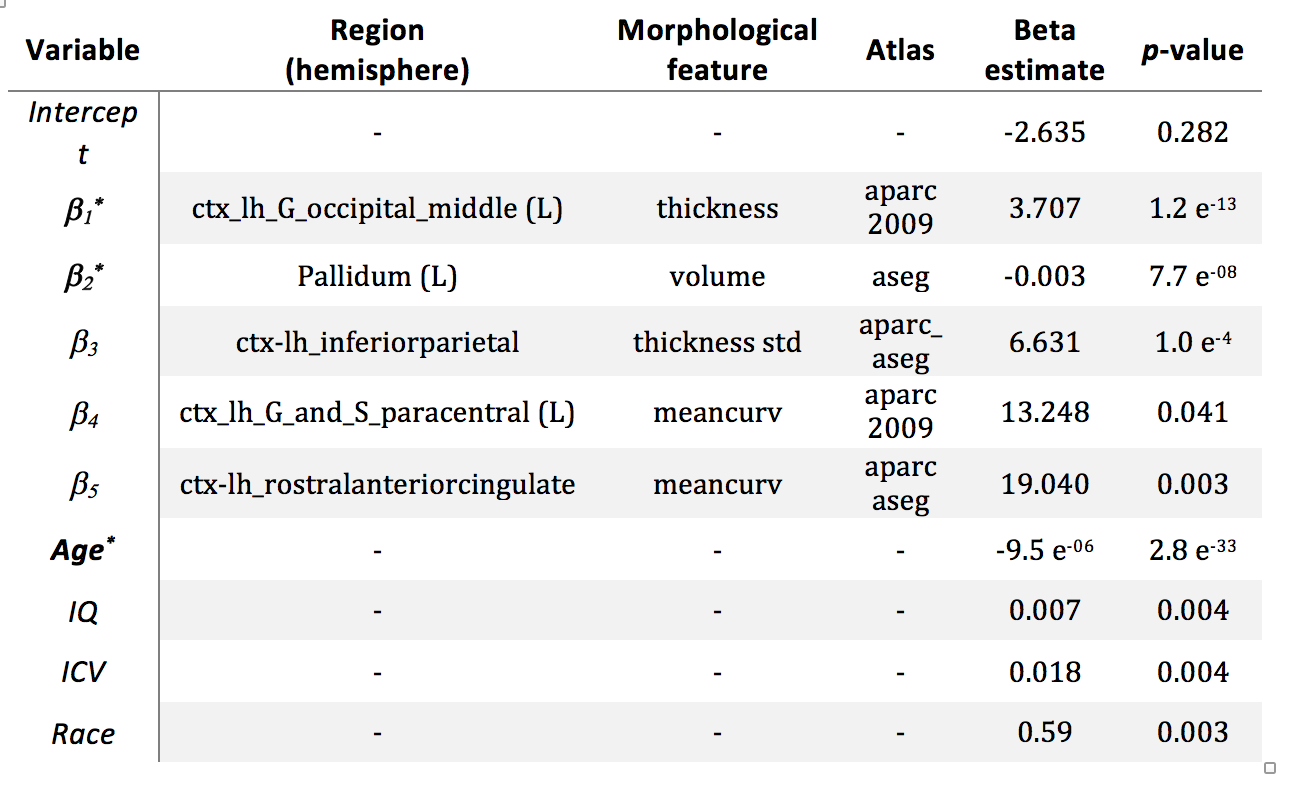
When neuroanatomical features were incorporated, classification performance was superior to both liberal and conservative baselines (prediction accuracy = 81%, FP = 0.16, TP = 0.79, AUC = 0.89). Classification performance was also highest when all 2087 features were utilized (Fig 2). Destrieux and Desikan-Killiany (aparc_2009 and aparc_aseg) atlases appeared to have more predictive power compared to other atlases. Support vector beta estimates of all 2087 neuroanatomical features were plotted (Fig 3). Given we utilized a linear kernel, these values are relative weights of the orthogonal vectors to the discriminant hyperplane of support vector machine. Classification-informed regression analysis resulted in discovering two morphological features (Table 2) that are significant contributors to gender-associated difference in neurodevelopment (when Bonferoni p-value correction was applied).Summary
We reported a big data approach for mining neuroimaging data and tested it on a large neurodevelopment dataset. Proposed neuroanatomical regressor selection routine enabled multi-parametric regression analysis to deal with the curse of dimensionality. The outcomes of this approach are more interpretable than those derived only from classification beta values, and could capture brain complexity to a higher degree compared with classical single-parameter regression techniques. In this study, we noticed that with a large feature space (by including morphological parameters and atlases) prediction power increases, which motivates further investigations to better understand the interaction of sample size and feature space. Finding the optimum number of regressors (from classification outcome) remains a challenge in an analysis routine of this kind. A greedy incremental search can also be used to obtain a pseudo-optimum number.Acknowledgements
This work was supported by R21NS091586, R00HD065832, R01MH094343, P41EB015922, and U54EB020406References
1. Friedman, J., Hastie, T. and Tibshirani, R., 2001. The elements of statistical learning (Vol. 1). Springer, Berlin: Springer series in statistics. 2. Plonski P, Gradkowski W, Altarelli I, Monzalvo K, van Ermingen-Marbach M, Grande M, et al. Multi-parameter machine learning approach to the neuroanatomical basis of developmental dyslexia. Hum Brain Mapp. 2016 Oct 6. 3. Satterthwaite, T.D., Elliott, M.A., Ruparel, K., Loughead, J., Prabhakaran, K., Calkins, M.E., Hopson, R., Jackson, C., Keefe, J., Riley, M. and Mentch, F.D., 2014. Neuroimaging of the Philadelphia neurodevelopmental cohort. Neuroimage, 86, pp.544-553. 4. Satterthwaite, T.D., Connolly, J.J., Ruparel, K., Calkins, M.E., Jackson, C., Elliott, M.A., Roalf, D.R., Hopsona, K.P.R., Behr, M., Qiu, H. and Mentch, F.D., 2016. The philadelphia neurodevelopmental cohort: a publicly available resource for the study of normal and abnormal brain development in youth. Neuroimage, 124, pp.1115-1119. 5. Dinov, I., Lozev, K., Petrosyan, P., Liu, Z., Eggert, P., Pierce, J., Zamanyan, A., Chakrapani, S., Van Horn, J., Parker, D.S. and Magsipoc, R., 2010. Neuroimaging study designs, computational analyses and data provenance using the LONI pipeline. PloS one, 5(9), p.e13070. 6. Dinov, I., Van Horn, J., Lozev, K., Magsipoc, R., Petrosyan, P., Liu, Z., MacKenzie-Graha, A., Eggert, P., Parker, D.S. and Toga, A.W., 2009. Efficient, distributed and interactive neuroimaging data analysis using the LONI pipeline. Frontiers in neuroinformatics, 3, p.22.Figures