2289
Non-negative matrix factorisation reveals developmental trajectories of structural subnetworks1Developmental Imaging, Murdoch Children's Research Institute, Melbourne, Australia, 2Department of Paediatrics, University of Melbourne, Melbourne, Australia
Synopsis
We model the structural network architecture of the brain as a set of superposed subnetworks, or network components. We use non-negative matrix factorisation, an unsupervised and data-driven approach, to reliably identify separable subnetworks and track their development over the human lifespan. In the NKI-Rockland lifespan sample (n=196), we find evidence for an increased reliance on local communication between neighbouring regions, rather than through heavily-connected network hubs in older age. This method shows good potential for further exploration of the human structural connectome.
Introduction
At a millimetre-scale, structural connections between brain regions can be conceptualised as a complex network. This leads to the broad characterisation of the macroscale organisation of the mammalian brain as a near-decomposable system built on multiple, parallel and partially segregated modules1,2. Network modules are organised hierarchically3 and linked by overarching, densely interconnected hub regions that facilitate distributed interactions across the network4–6.
Here, we propose to model the structural network architecture of the brain as a set of superposed subnetworks, or network components. We use non-negative matrix factorisation, an unsupervised and data-driven approach, to reliably identify separable subnetworks and track their development over the human lifespan.
Methods
Connectivity matrices from 196 healthy participants (114 male; age range: 4-85y), collected as part of the NKI/Rockland lifespan study, were available from the USC Multimodal Connectivity database7,8. Matrices were derived from 3 Tesla diffusion MRI (64 directions, b: 1000 s/mm2 ; TR/TE: 10000/91ms; voxel size: 2mm3) and tractography performed using the FACT algorithm. Connectivity strength was modelled as the log-transformed streamline count between 182 cerebral regions.
To identify network components, we use a variant of non-negative matrix factorisation (NMF)9, called projective NMF10. Projective NMF seeks a low rank approximation of the data to solve:
$$\min_{W \geq 0}\parallel{V-WW^TV\parallel_F}$$
where $$$V$$$ is the $$$n$$$ subject-by-$$$m$$$ feature data matrix and $$$W$$$ is a non-negative $$$m$$$-by-$$$r$$$ matrix with $$$r \lt n$$$ basis images, or components.
Projective NMF results in a set of highly orthogonal network components, each comprising a sparse set of connections (i.e.: the edge structure of different components does not overlap) and a corresponding subject-specific weighting. Together, these elements can then be combined to approximately reconstruct the full connectivity network of any given subject.
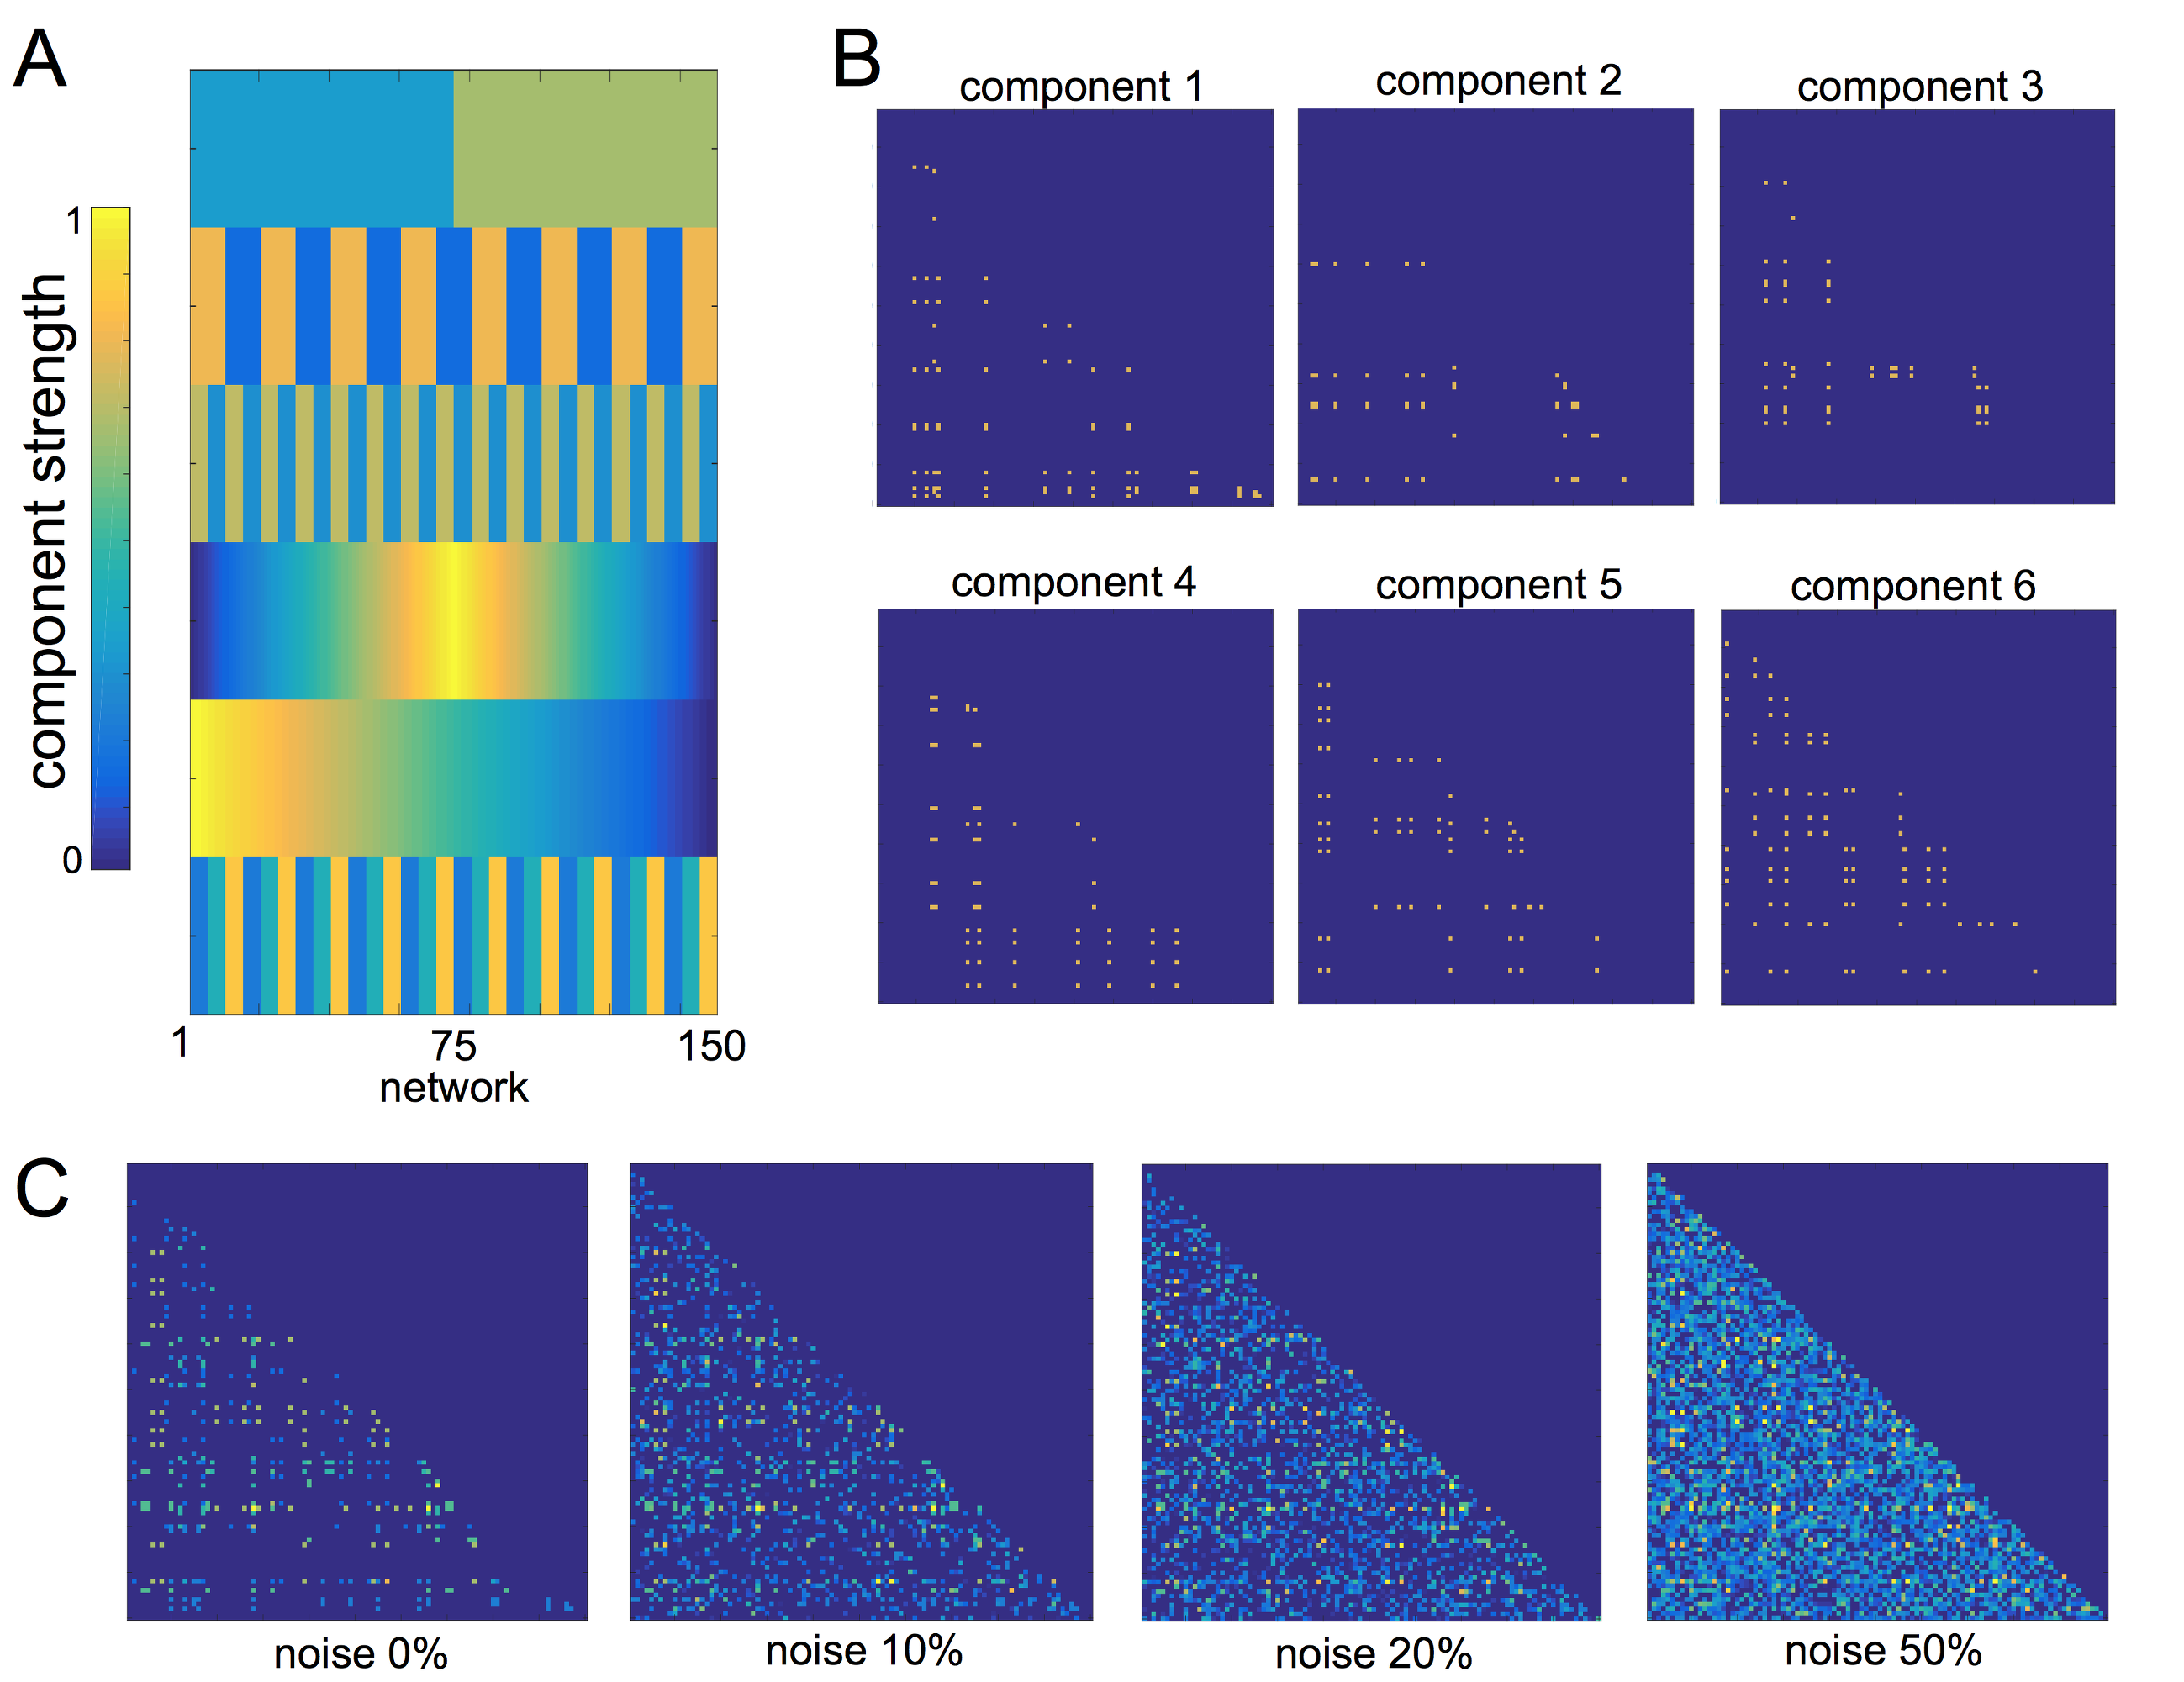
We performed a set of simulation experiments to demonstrate the application of PNMF to connectivity matrices (Fig 1). 150 simulated 100x100 networks were constructed from a set of six network components. Each component comprised 10-20 randomly connected nodes, and were weighted according to a set population-varying pattern. Final networks were formed from the weighted linear combination of all components, along with an additive noise matrix with edge density of 0, 10, 20 or 50%.
For the real data, projective NMF was applied to the concatenated connectivity matrices of all subjects and, for each component, subject loading over the lifespan was modelled using polynomial regression (up to power 3) with age as a covariate and sex as an additional factor. The Akaike Information Criterion (AIC) was used to select the best model for each component (i.e.: linear, quadratic, or cubic; with or without sex).
Results
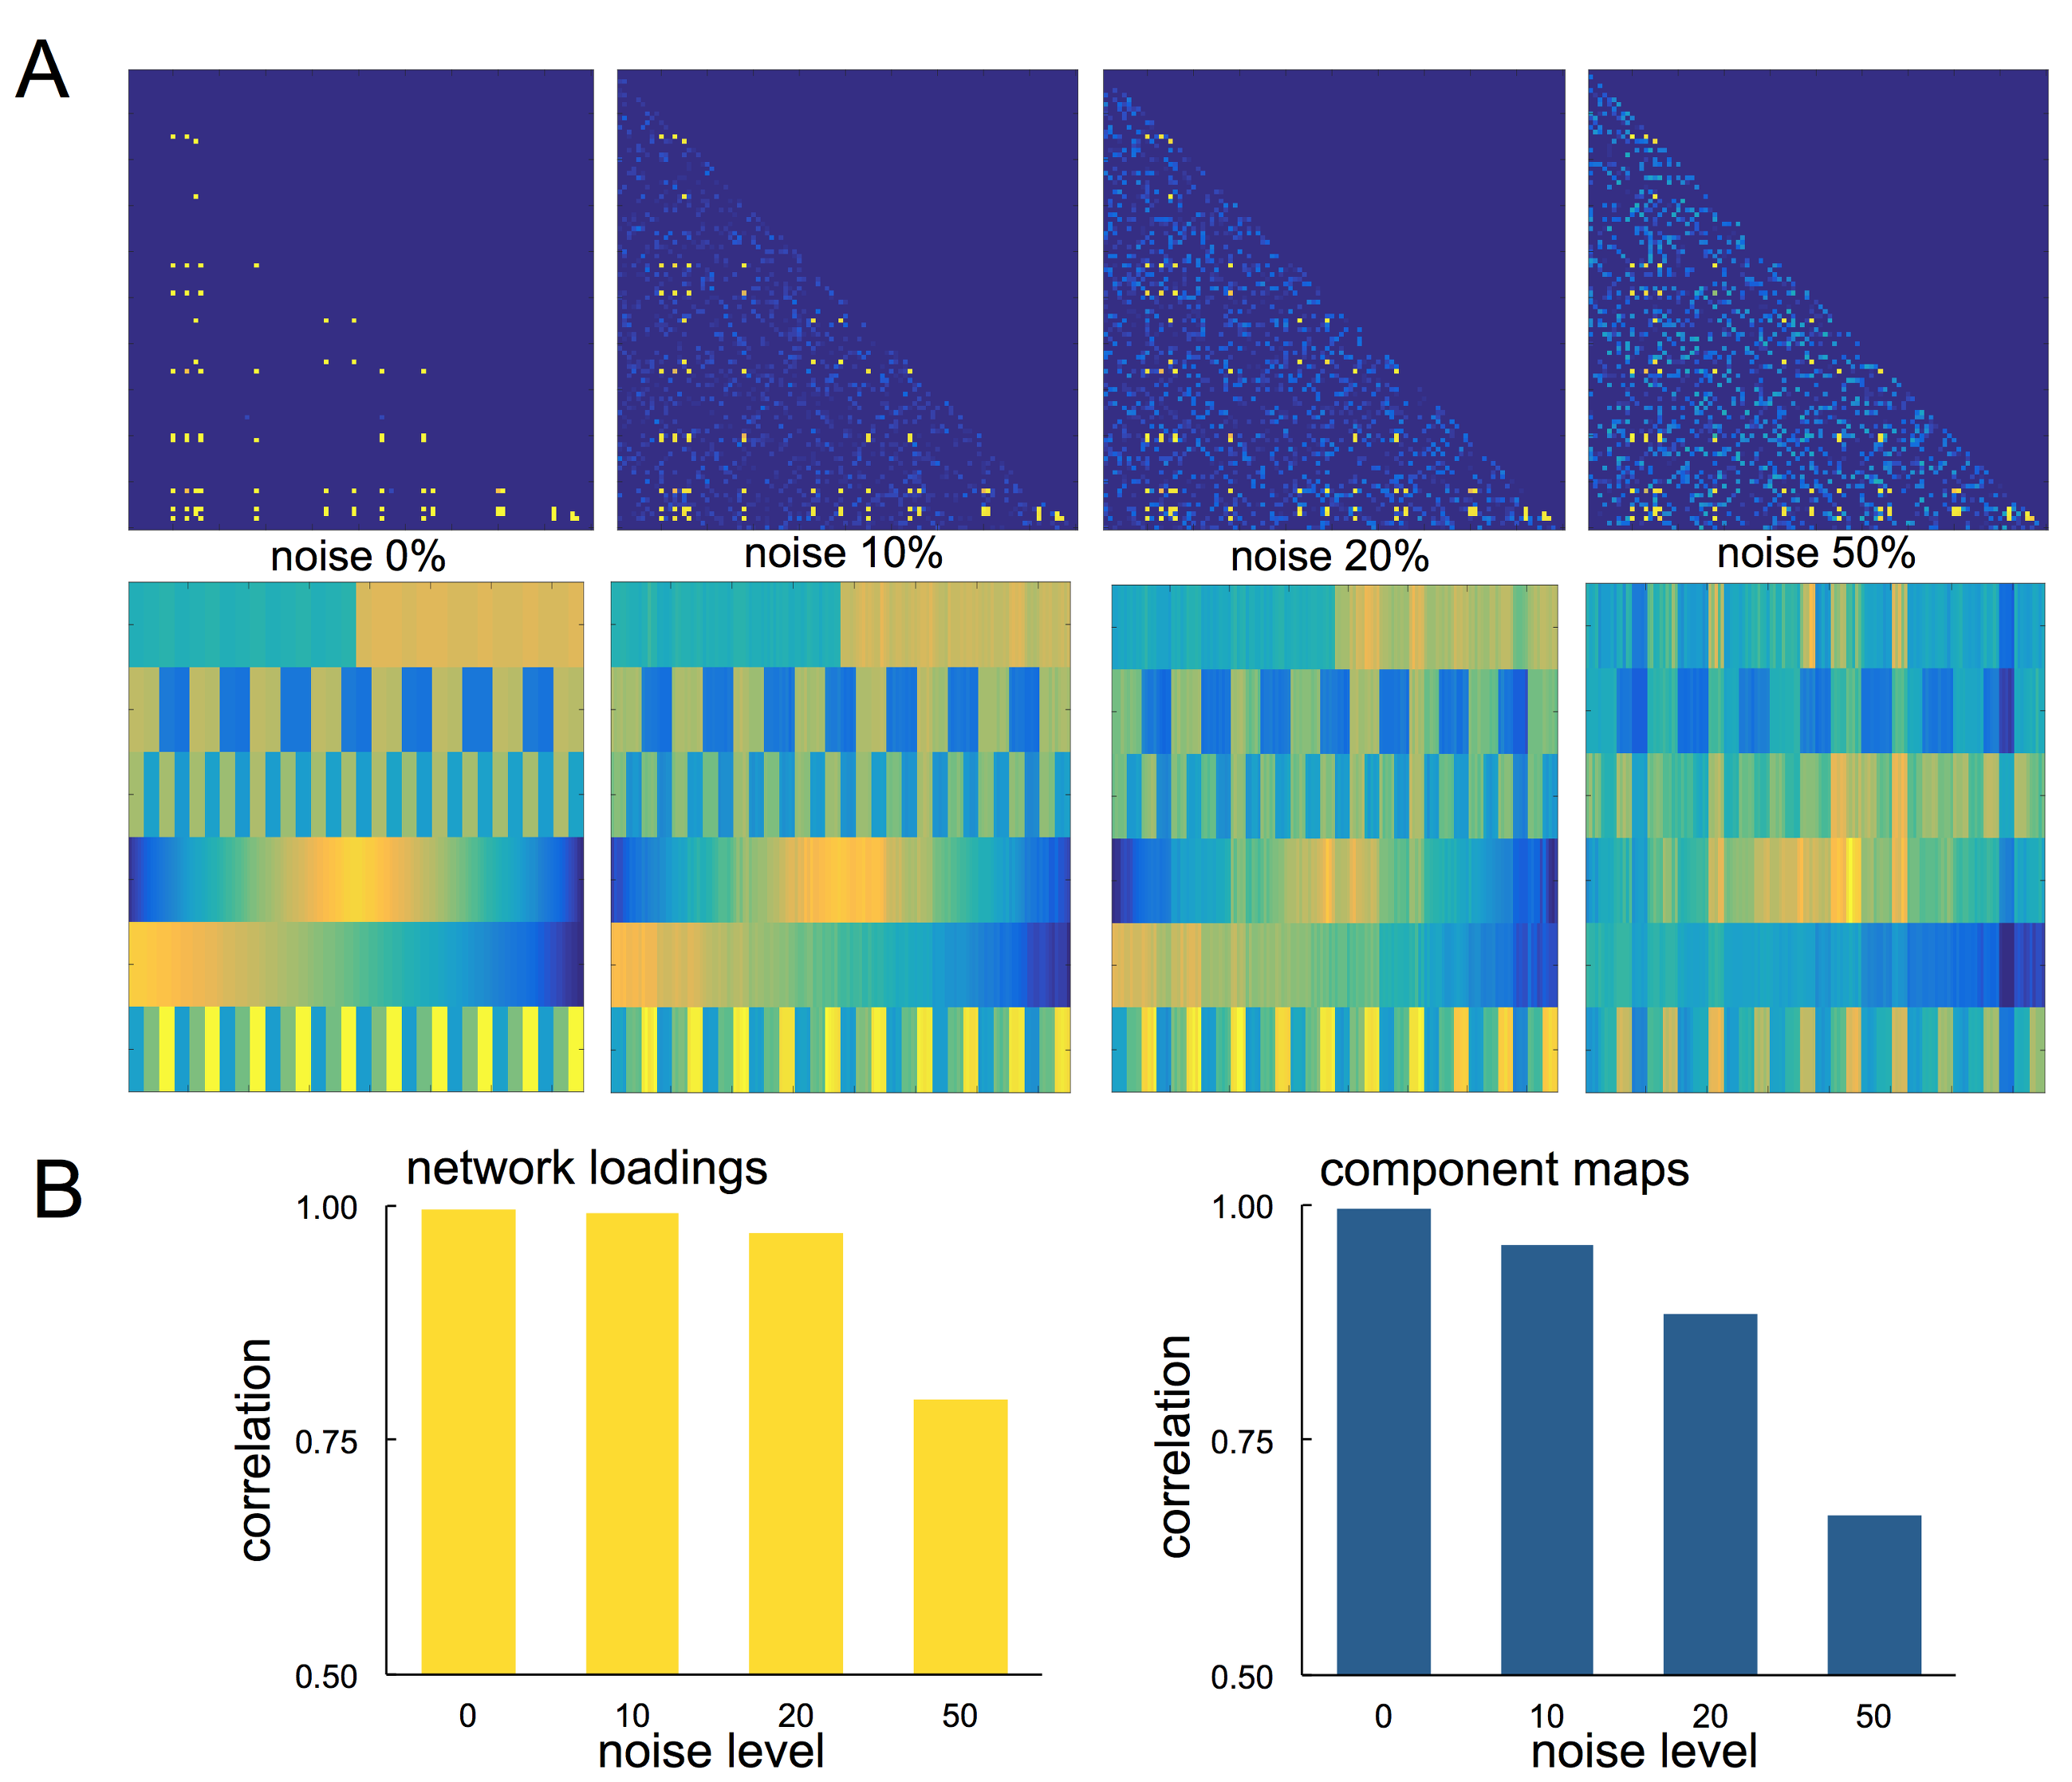
In simulated data, projective NMF was able to recover component connectivity maps and population-varying network loadings with high accuracy at all noise levels (Fig 1). The average spatial similarity between the original and recovered component maps was: 0.99, 0.97, 0.86 and 0.79 for noise levels: 0, 10, 20, 50% respectively. The average correlation between the original and recovered component loadings was 0.99, 0.99, 0.89 and 0.84 (Fig 2).
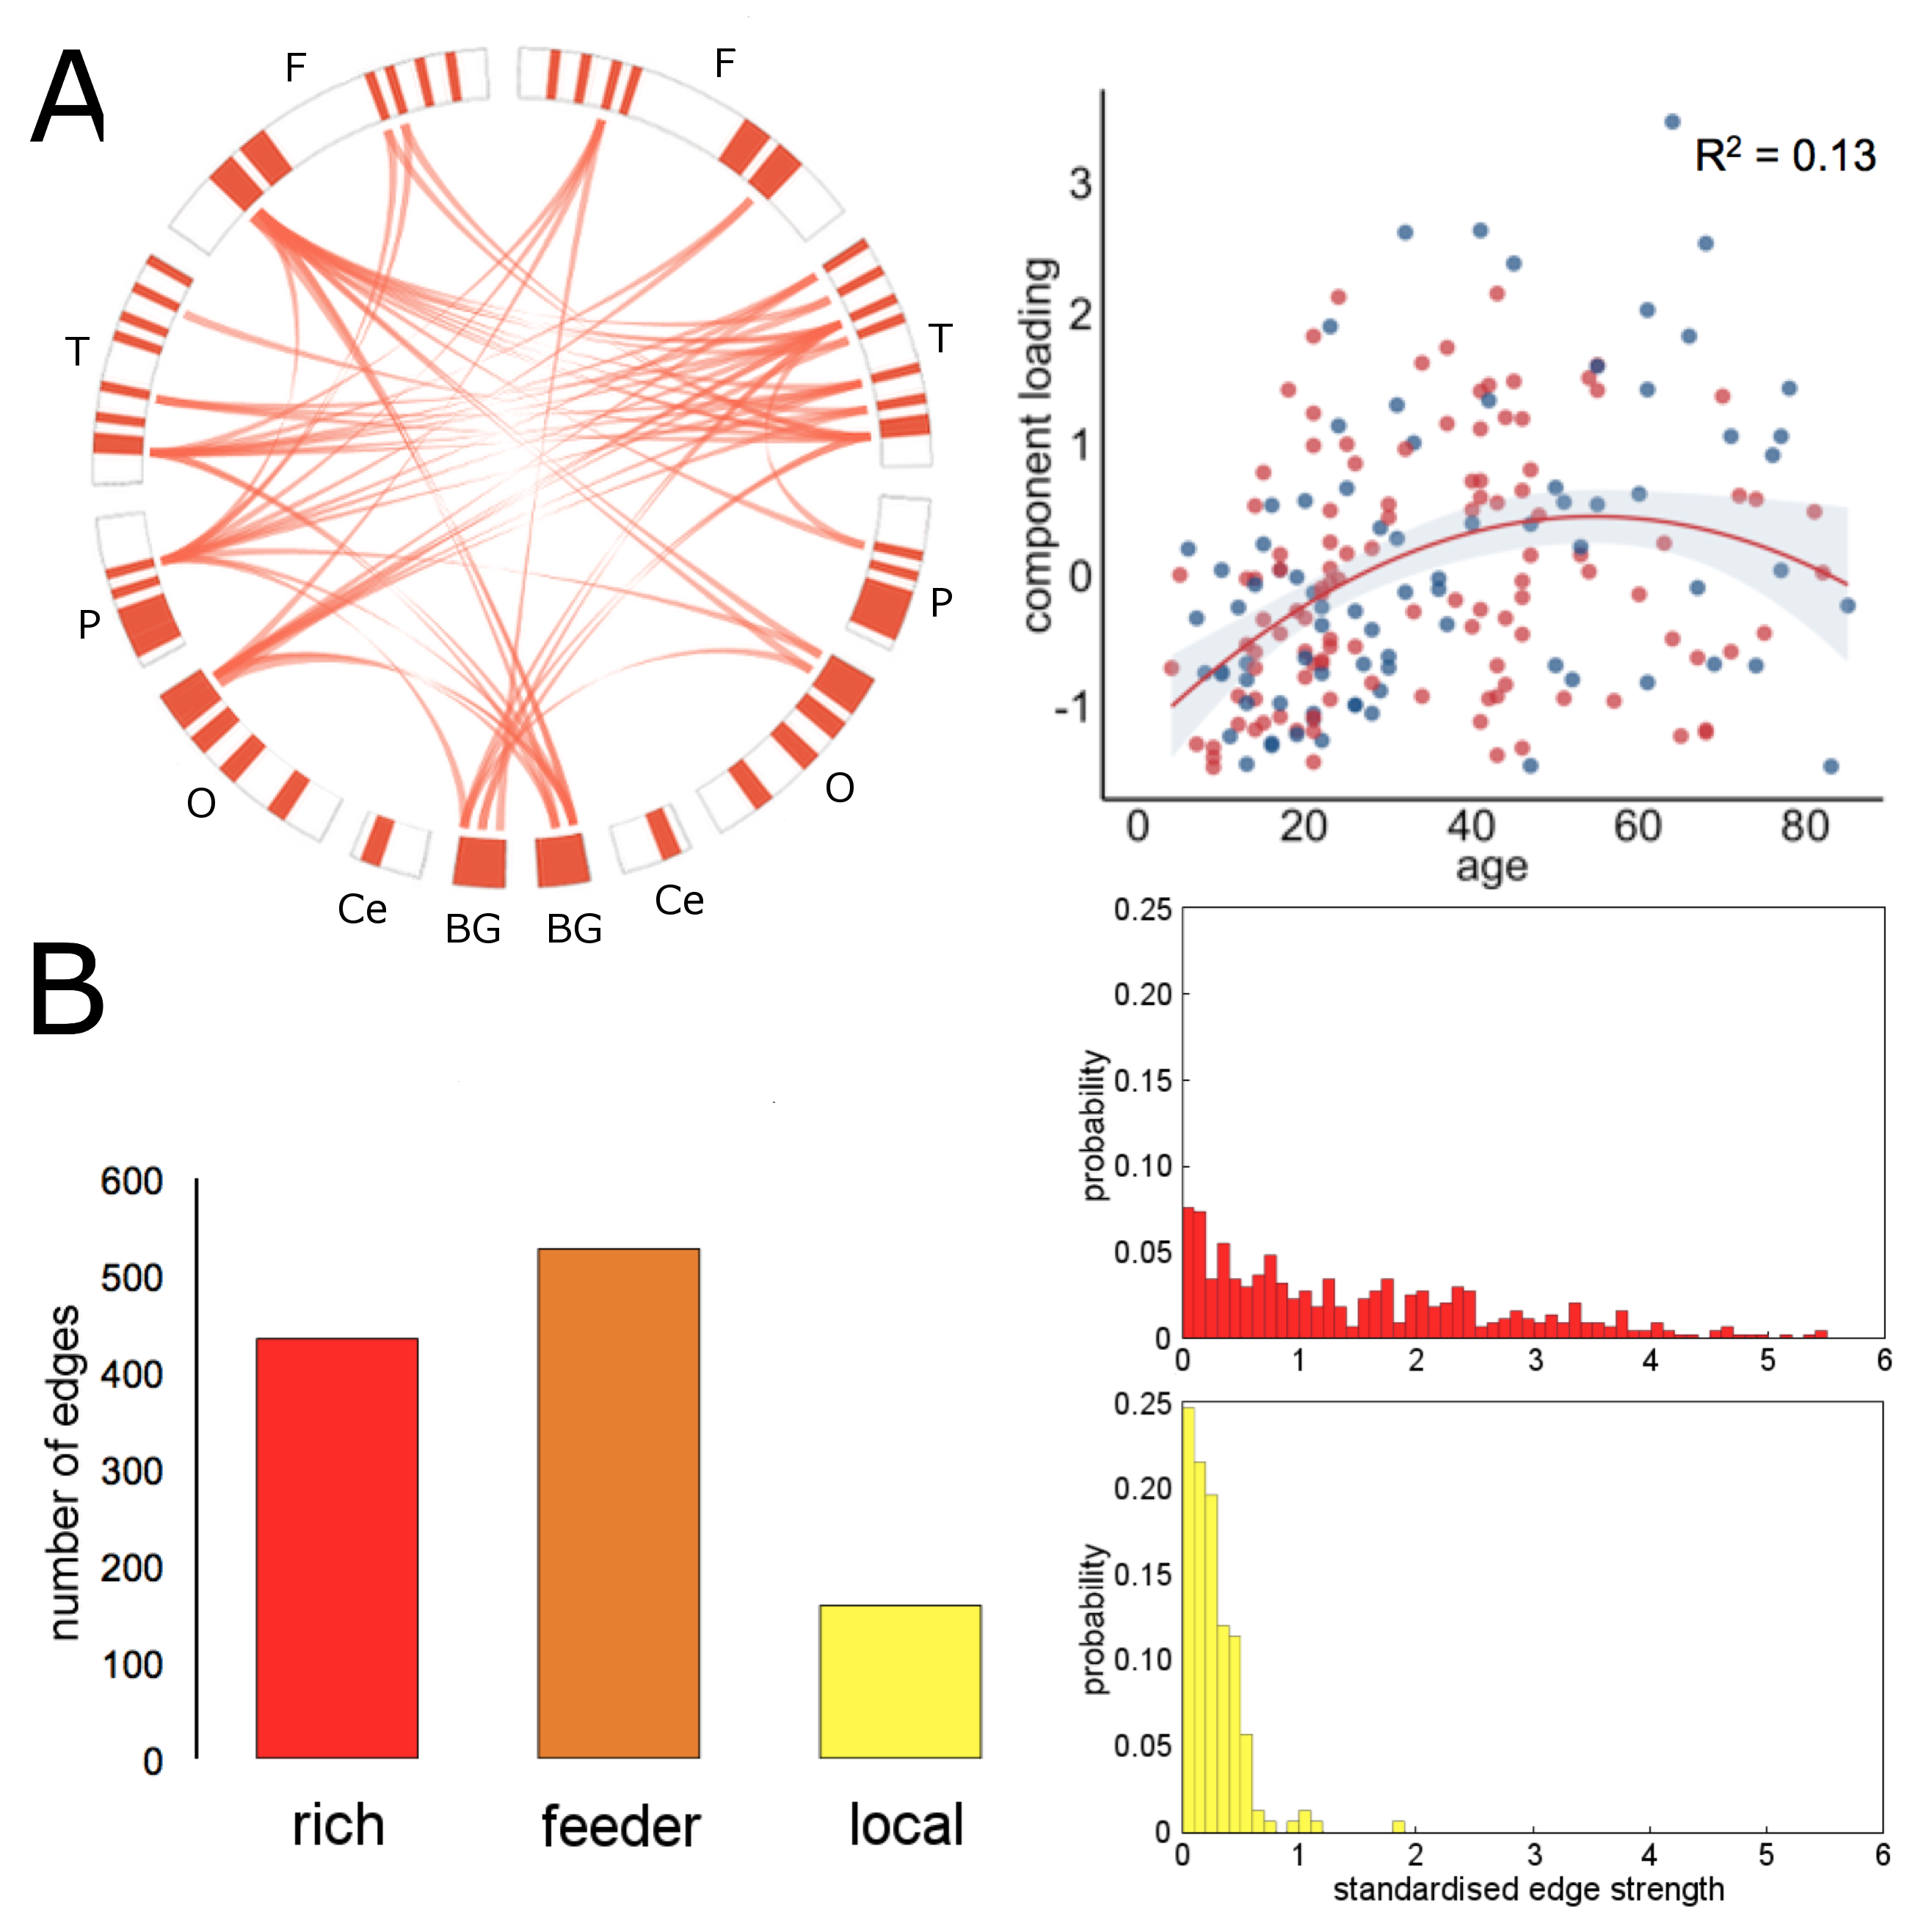
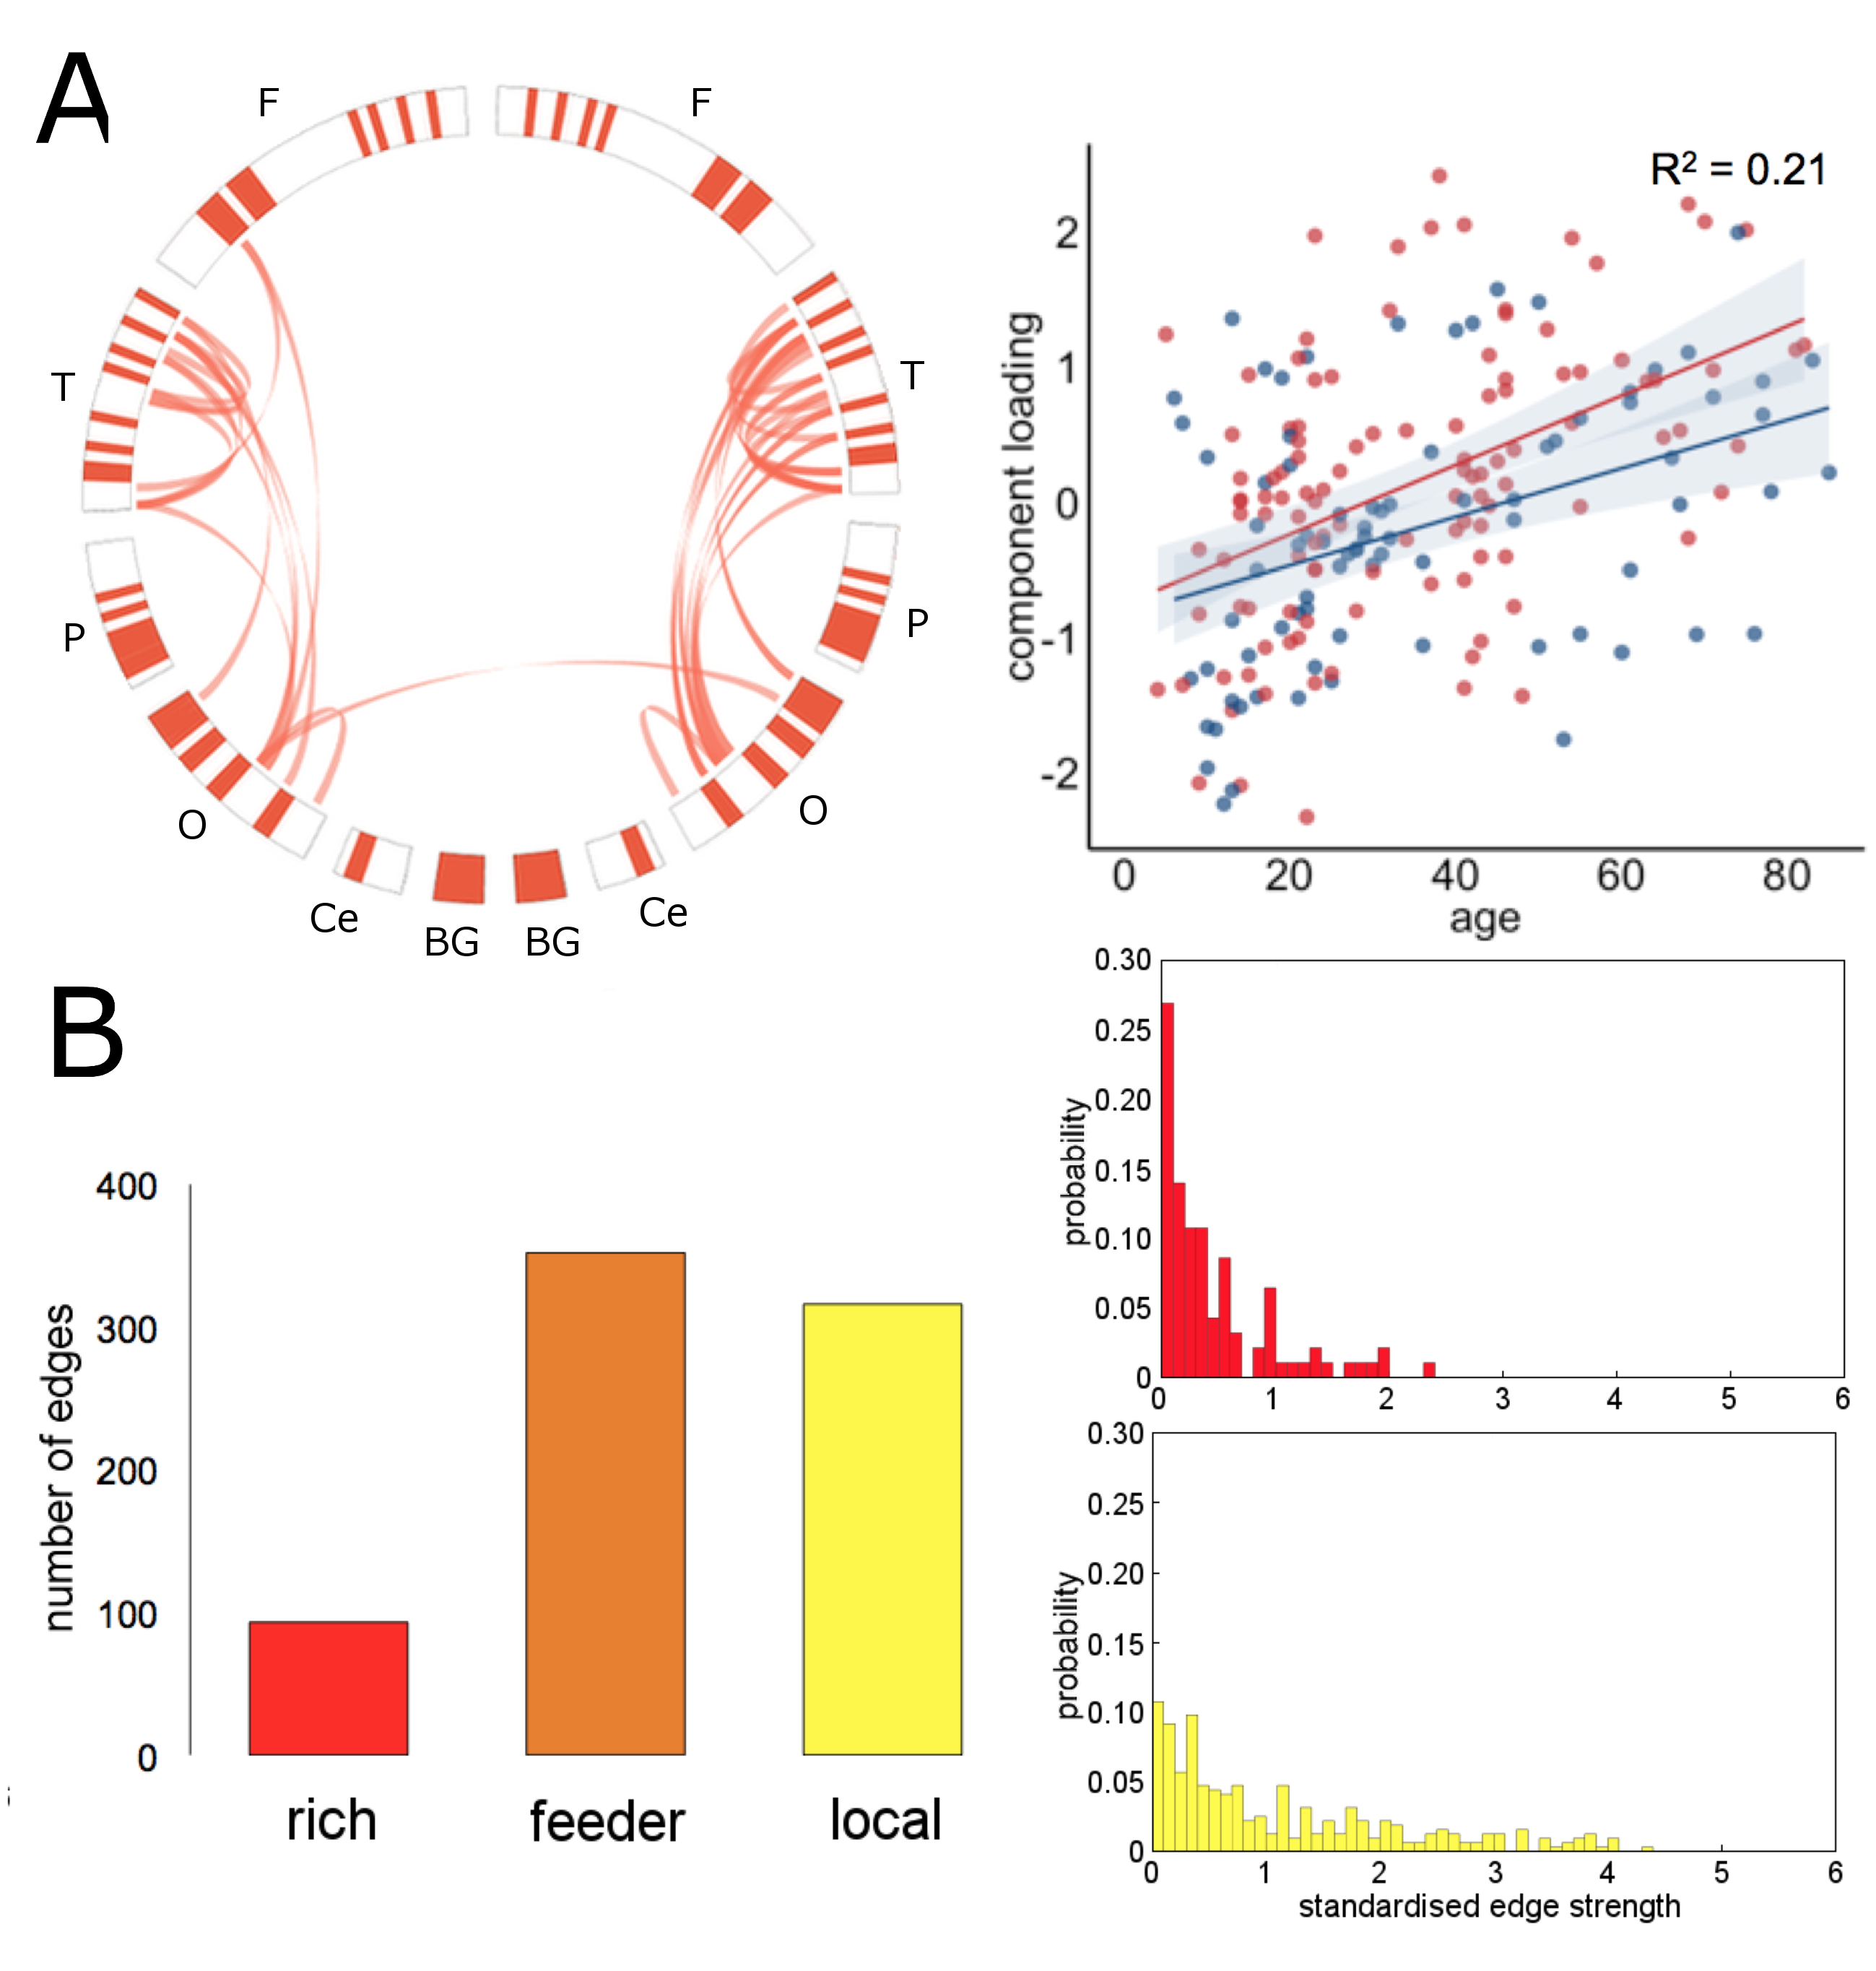
In the NKI-Rockland lifespan sample, we identified 22 network components (see examples in Fig 3, 4). A split-half reliability assessment showed that 15 of 22 could be reliably reproduced in independent subsamples of the original dataset (p<0.001, 1000 permutations). In general, components revealed a bilateral and symmetric organisation across hemispheres. 16 of 22 components showed significant age-related variation (all p<0.01). We classified edges in each component as linking connection-rich network hubs, or anatomically local cortical regions. Four components were found to comprise significantly more rich-club connections, and four significantly more local connections, compared to a set of equivalent random networks (1000 permutations, p<0.001). Rich components linked densely connected hub regions and followed an inverted U trajectory modelled by polynomial trend over time (Fig 3). In contrast, local component loadings connected anatomically neighbouring regions and increased in strength over time (Fig 4).
Conclusions
This study supports evidence for an increased reliance on local communication between neighbouring regions, rather than through heavily-connected network hubs in older age11,12. Projective NMF provides a low-rank approximation of complex structural networks as a set of co-varying network components, or subnetworks, that mitigates the multiple comparison problem associated with high-dimensional edge-based network analyses13. We propose that this form of network component analysis shows good potential for further exploration of the human structural connectome.Acknowledgements
This research was conducted within the Developmental Imaging research group, Murdoch Childrens Research Institute and the Children’s MRI Centre, Royal Children's Hospital, Melbourne, Victoria. It was supported by the Murdoch Childrens Research Institute, the Royal Children’s Hospital, Department of Paediatrics The University of Melbourne and the Victorian Government's Operational Infrastructure Support Program. The project was generously supported by RCH1000, a unique arm of The Royal Children’s Hospital Foundation devoted to raising funds for research at The Royal Children’s Hospital.References
1. Simon, H. A. The Architecture of Complexity. Proc. Am. Philos. Soc. 106, 467–482 (1962).
2. Meunier, D., Lambiotte, R. & Bullmore, E. T. Modular and hierarchically modular organization of brain networks. Front. Neurosci. 4, 200 (2010).
3. Bassett, D. S., Brown, J. A., Deshpande, V., Carlson, J. M. & Grafton, S. T. Conserved and variable architecture of human white matter connectivity. NeuroImage 54, 1262–1279 (2011).
4. Sporns, O., Tononi, G. & Kotter, R. The human connectome: A structural description of the human brain. PLoS Comput. Biol. 1, e42 (2005).
5. Bullmore, E. & Sporns, O. The economy of brain network organization. Nat. Rev. Neurosci. 13, 336–349 (2012).
6. van den Heuvel, M. P. & Sporns, O. Rich-club organization of the human connectome. J. Neurosci. Off. J. Soc. Neurosci. 31, 15775–15786 (2011).
7. Brown, J. A., Rudie, J. D., Bandrowski, A., Van Horn, J. D. & Bookheimer, S. Y. The UCLA multimodal connectivity database: a web-based platform for brain connectivity matrix sharing and analysis. Front. Neuroinformatics 6, (2012).
8. Nooner, K. B. et al. The NKI-Rockland Sample: A Model for Accelerating the Pace of Discovery Science in Psychiatry. Front. Neurosci. 6, (2012).
9. Lee, D. D. & Seung, H. S. Learning the parts of objects by non-negative matrix factorization. Nature 401, 788–791 (1999).
10. Yang, Z. & Oja, E. Linear and Nonlinear Projective Nonnegative Matrix Factorization. IEEE Trans. Neural Netw. 21, 734–749 (2010).
11. Perry, A. et al. The organisation of the elderly connectome. NeuroImage 114, 414–426 (2015).
12. Cao, M. et al. Topological organization of the human brain functional connectome across the lifespan. Dev. Cogn. Neurosci. 7, 76–93 (2014).
13. Zalesky, A., Fornito, A. & Bullmore, E. T. Network-based statistic: identifying differences in brain networks. NeuroImage 53, 1197–1207 (2010).
Figures