2288
Assessing white matter tract development in formula fed versus breastfed infants at 1 month and 3 months1Bioengineering, University of Illinois at Urbana-Champaign, Urbana, IL, United States, 2Beckman Institute, University of Illinois at Urbana-Champaign, Urbana, IL, United States, 3Boston Children’s Hospital, Boston, MA, United States, 4Beth Israel Deaconness, Boston, MA, United States
Synopsis
Diffusion Tensor Imaging and Tract-Based Spatial Statistic on FA, RD and AD were applied to investigate white matter development in formula fed infants and breast fed infants. Thirty-six infants (thirty breast fed and six formula fed) were scanned at 1 month and twenty-two (twelve breast fed and ten formula fed) at 3 months. Increased FA and decreased RD values were observed in breast fed infants at 1 month with differences becoming insignificant at 3 months.
Introduction
Previous studies [1]–[4] have shown correlations between breastfeeding during infancy and improved cognitive performance later in life. Nevertheless, few studies have looked at nutrition and brain development during the first few months of life. Belfort et al. [4] observed an increase in deep nuclear gray matter volume in preterm neonates, breast fed in the first month. Deoni et al. [5] investigated the relationship between breastfeeding and myelination using a multicomponent diffusion model. They demonstrated that white matter (WM) was more developed in late maturing frontal and associative brain regions in breastfed children. However, their study focused on children from four months to ten years.
Diffusion Tensor Imaging (DTI) along with tract-based spatial statistics (TBSS) have been used to look at WM tracts in infants. These techniques have been applied to characterize WM development in preterm neonates [6]–[8] or in relation with various diseases [9].
The aim of this work is to provide new insights on the development of WM tracts with nutrition during the first three months of life using DTI and TBSS.
Methods
DTI images were acquired on a 3 T Trio scanner (Siemens, Erlangen Germany) with a simultaneous multi-slice sequence and the following parameters: TE = 104 ms, TR = 3.4 s, flip angle 90°, and 2 mm isotropic resolution with multiband factor 2. Thirty directions were acquired at b = 1000 s/mm2.
Forty-three healthy volunteer infants were scanned with signed informed consent and in accordance with IRB guidelines. Thirty-six infants were scanned at month 1, M1, (mean age: 25 days; range: 11-43 days) and twenty at month 3, M3, (mean age: 78 days; range: 64-95 days). This includes thirteen infants who were scanned at both ages.
The infants were classified in two groups for each time point. Infants were considered breast fed or formula fed when breast fed or formula fed more than 70% of the time since birth. Thirty neonates were breast fed (BF) and six were formula fed (FF) at M1. At M3, there were twelve BF infants and eight FF infants.
The preprocessing steps (brain extraction, corrections for off-resonance and eddy currents) were performed with FSL [10]-[11]. FA, AD and RD maps were obtained using DTIFIT. Voxel-wise statistical analysis was performed on the FA, AD and RD maps using TBSS [12]. TBSS analyses were carried out separately for the two time points since the infant brains differ substantially between the two ages.
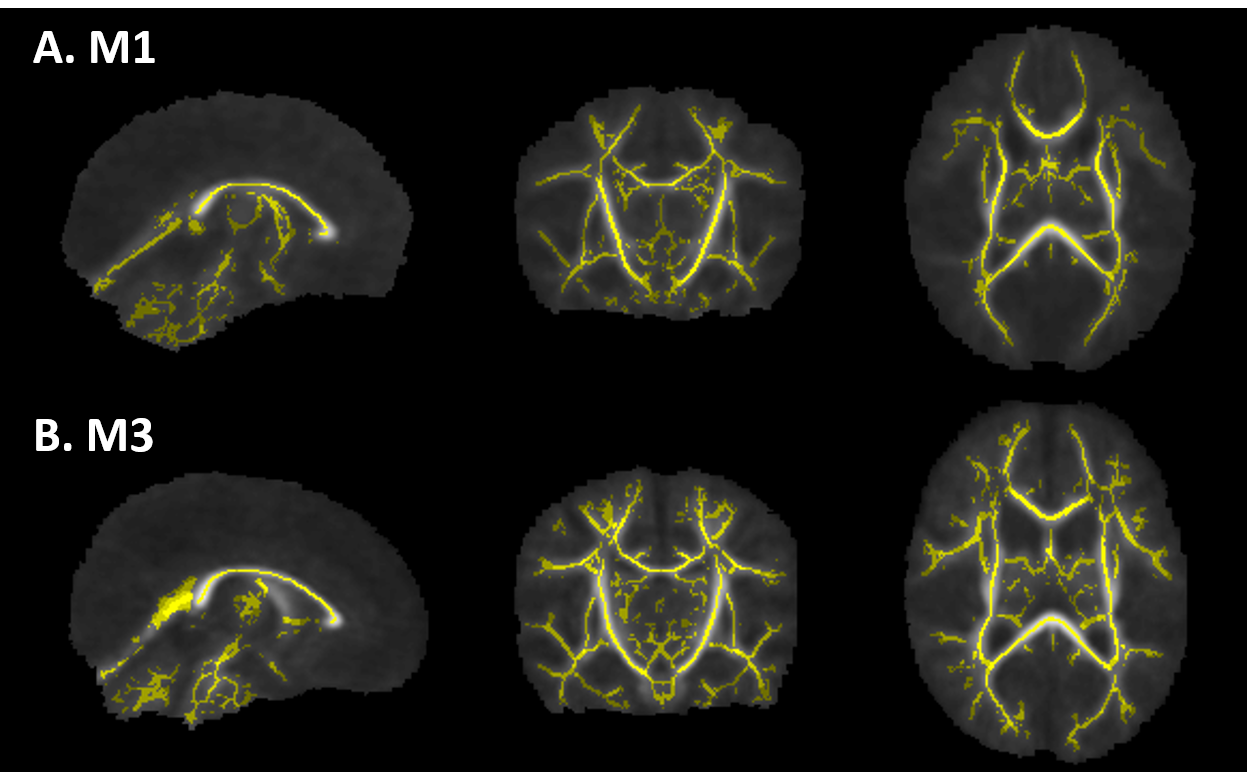
In the TBSS analyses, the target FA was defined as the one with the minimum mean warp displacement score. A FA threshold of 0.2 was chosen to capture the main stem WM tracts and avoid peripheral tracts where there is increased subject variability. The threshold was only used to define the tracts of interest from the mean FA, creating a skeleton mask. Voxel-wise statistics were applied to the skeletonized FA maps using FSL randomize [13] and TFCE [14]. The obtained p-values were corrected for multiple comparisons.
ROI analysis was performed using the neonate atlas provided by Oishi et al. [15]. Regions on the atlas were selected if significant differences between formula and breast fed infants were observed in the TBSS analysis at M1. Nonlinear registration was applied via acquired T1 weighted images to align the atlas in DTI space. T-tests were performed on mean FA, RD and MD in these ROI between breastfed and formula infants.
Results
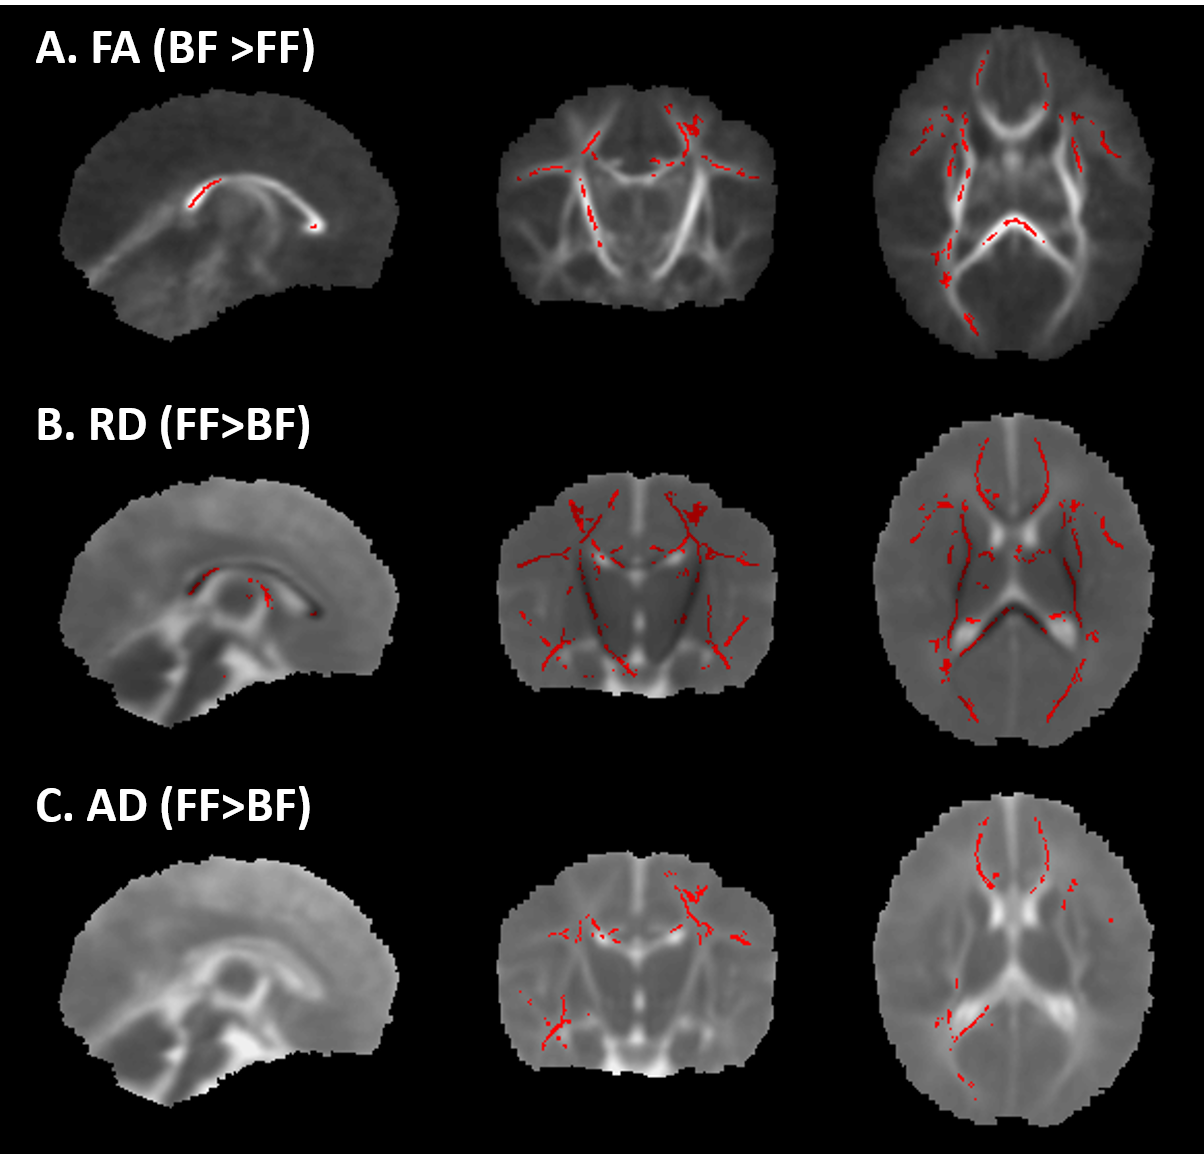
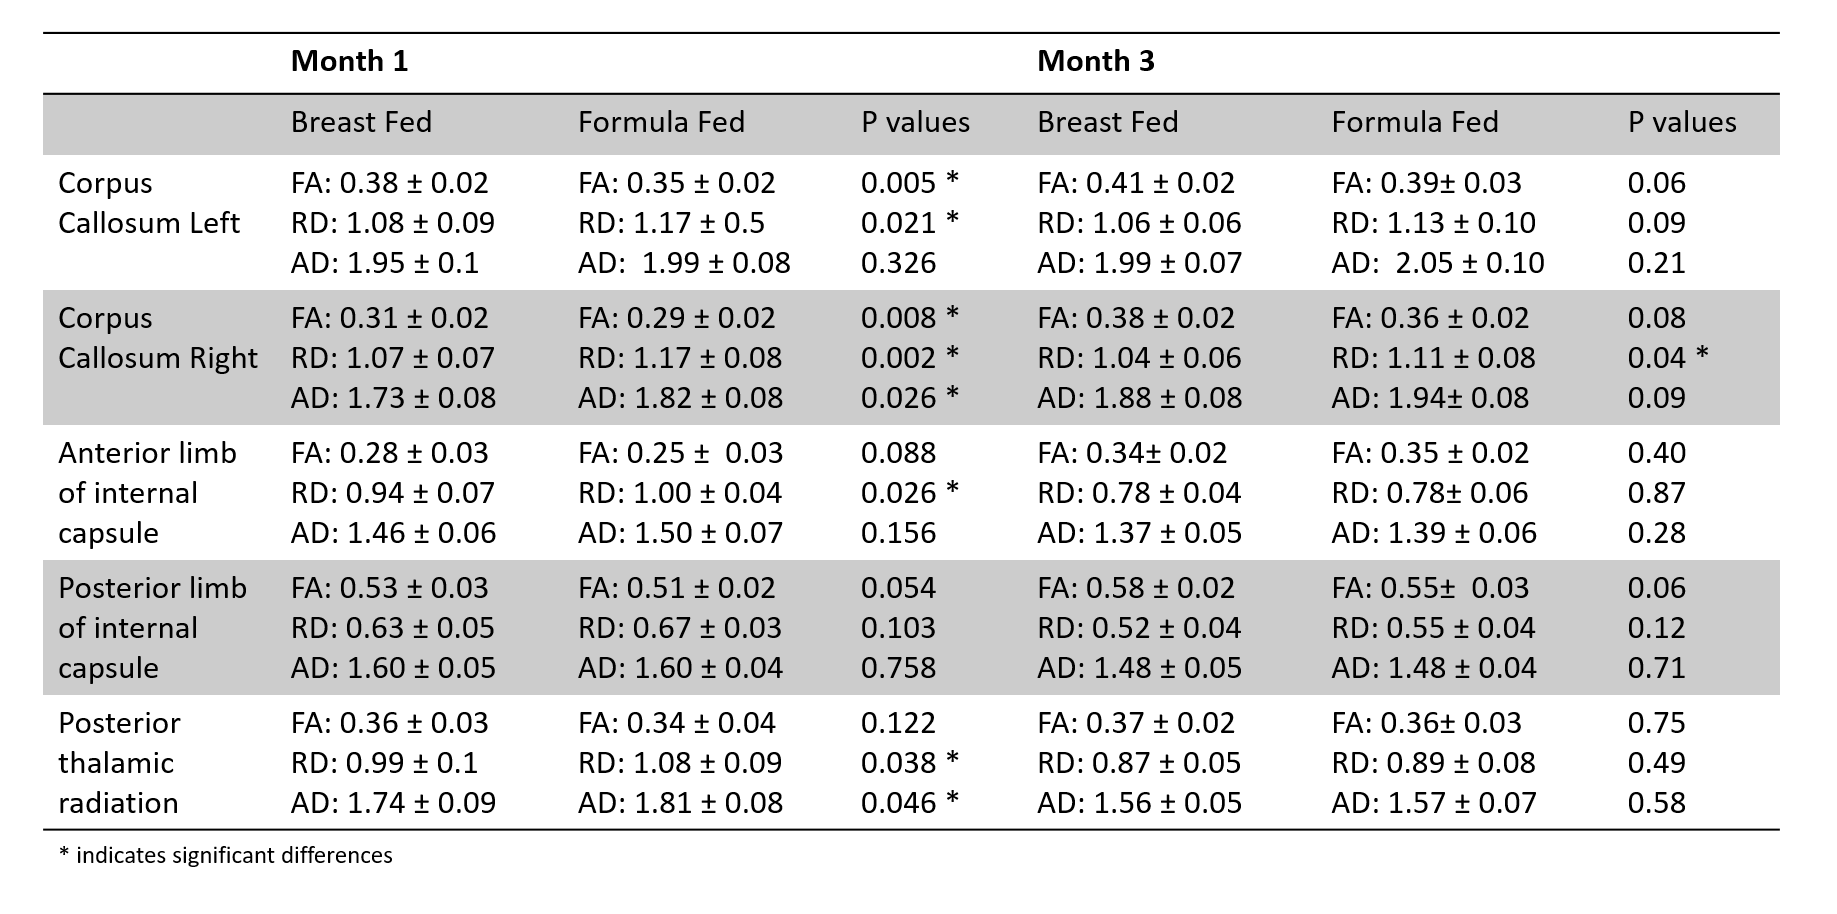
Figure 1 shows the FA skeleton masks overlaid on the mean FA. Figure 2 shows the TBSS results at M1. Red regions indicate significant differences (p<0.05) in FA for the test BF > FF and in RD and AD for the test FF>BF. At M3, TBSS analysis did not detect any significant differences. Five regions from the atlas were selected: corpus callosum left and right, anterior limb of the internal capsule, posterior limb of the internal capsule, posterior thalamic radiation. The table in Figure 3 shows the mean FA, RD and AD and corresponding p-values for both time points in these regions.Discussion and Conclusion
The obtained FA values in this work are within the values reported in previous literature [6], [15], [16]. Our preliminary results suggest neonates fed with breast milk may have regionally accelerated myelination. Although the current results are limited by the total number of infants, especially at M3, and the number formula fed, especially at M1, our results suggest that TBSS may be useful in monitoring differences in brain development associated with differences in nutrition. As the study progresses, more subjects will be included and further analyses will be done to confirm these preliminary results.Acknowledgements
This work was supported by a grant from Abbott Nutrition through the Center for Nutrition, Learning, and Memory at the University of Illinois.References
[1] M. B. Belfort, S. L. Rifas-Shiman, K. P. Kleinman, L. B. Guthrie, D. C. Bellinger, E. M. Taveras, M. W. Gillman, and E. Oken, Infant feeding and childhood cognition at ages 3 and 7 years: Effects of breastfeeding duration and exclusivity, JAMA Pediatr. 2013;167:836–844.
[2] B. L. Horta, C. Loret de Mola, and C. G. Victora, Breastfeeding and intelligence: a systematic review and meta-analysis, Acta Paediatr. 2015;104:14–19.
[3] J. L. Luby, A. C. Belden, D. Whalen, M. P. Harms, and D. M. Barch, Breastfeeding and Childhood IQ: The Mediating Role of Gray Matter Volume, J. Am. Acad. Child Adolesc. Psychiatry. 2015;55:367–375.
[4] M. B. Belfort, P. J. Anderson, V. A. Nowak, K. J. Lee, C. Molesworth, D. K. Thompson, L. W. Doyle, and T. E. Inder, Breast Milk Feeding, Brain Development, and Neurocognitive Outcomes: A 7-Year Longitudinal Study in Infants Born at Less Than 30 Weeks’ Gestation, J. Pediatr. 2016;177:133–139.e1.
[5] S. C. L. Deoni, D. C. Dean III, I. Piryatinsky, J. O’Muircheartaigh, N. Waskiewicz, K. Lehman, M. Han, and H. Dirks, Breastfeeding and early white matter development: A cross-sectional study, NeuroImage 2013;82:77–86.
[6] M. Anjari, L. Srinivasan, J. M. Allsop, J. V. Hajnal, M. A. Rutherford, A. D. Edwards, and S. J. Counsell, Diffusion tensor imaging with tract-based spatial statistics reveals local white matter abnormalities in preterm infants, NeuroImage 2007;35:1021–1027.
[7] B. J. M. van Kooij, L. S. de Vries, G. Ball, I. C. van Haastert, M. J. N. L. Benders, F. Groenendaal, and S. J. Counsell, Neonatal tract-based spatial statistics findings and outcome in preterm infants, AJNR Am. J. Neuroradiol. 2012;33:188–194.
[8] R. L. O’Gorman, H. U. Bucher, U. Held, B. M. Koller, P. S. Hüppi, C. F. Hagmann, and the S. E. N. T. Group, Tract-based spatial statistics to assess the neuroprotective effect of early erythropoietin on white matter development in preterm infants, Brain 2014;138:388-397
[9] E. J. Porter, S. J. Counsell, A. D. Edwards, J. Allsop, and D. Azzopardi, Tract-based spatial statistics of magnetic resonance images to assess disease and treatment effects in perinatal asphyxial encephalopathy, Pediatr. Res. 2010;68:205–209.
[10] S. M. Smith, Fast robust automated brain extraction, Hum. Brain Mapp. 2002;17:143–155.
[11] J. L. R. Andersson and S. N. Sotiropoulos, An integrated approach to correction for off-resonance effects and subject movement in diffusion MR imaging, NeuroImage 2016;1251063–1078, Jan. 2016.
[12] S. M. Smith, M. Jenkinson, H. Johansen-Berg, D. Rueckert, T. E. Nichols, C. E. Mackay, K. E. Watkins, O. Ciccarelli, M. Z. Cader, P. M. Matthews, and T. E. J. Behrens, Tract-based spatial statistics: voxelwise analysis of multi-subject diffusion data, NeuroImage 2006;31:1487–1505.
[13] A. M. Winkler, G. R. Ridgway, M. A. Webster, S. M. Smith, and T. E. Nichols, Permutation inference for the general linear model, NeuroImage 2014;92:381–397.
[14] S. M. Smith and T. E. Nichols, Threshold-free cluster enhancement: addressing problems of smoothing, threshold dependence and localisation in cluster inference, NeuroImage 2009;44:83–98.
[15] K. Oishi, S. Mori, P. K. Donohue, T. Ernst, L. Anderson, S. Buchthal, A. Faria, H. Jiang, X. Li, M. I. Miller, P. C. M. van Zijl, and L. Chang, Multi-contrast human neonatal brain atlas: Application to normal neonate development analysis, NeuroImage 2011;56:8–20.
[16] J. F. L. Schneider, K. A. Il’yasov, J. Hennig, and E. Martin, Fast quantitative diffusion-tensor imaging of cerebral white matter from the neonatal period to adolescence, Neuroradiology 2004;46:258–266.
Figures