2287
Lipid fractions as a marker for myelin maturation in the developing brain1Centre for the Developing Brain, Division of Imaging Sciences and Biomedical Engineering, King's College London, London, United Kingdom
Synopsis
Myelination is an important aspect of brain development, but current myelin mapping techniques require extensive acquisition times and are therefore difficult to use routinely in neonates. In this study, we present results from a large cohort of neonates born preterm spanning a wide age range (26 to 125 weeks’ post-menstrual age) obtained using a recently proposed method that relies on existing routine data. Our results show good agreement with the expected spatial and temporal pattern of myelin formation over the age range studied, and may form the basis for future studies assessing myelin in the developing brain.
Introduction
Myelin is essential for healthy brain function, providing electrical insulation and faster axonal signal conduction velocities. Current imaging techniques for myelin require extensive and complex acquisition methods, limiting its clinical use for infant and neonatal subjects1,2. In this study we use a recently proposed method, previously applied in an adult population, in a cohort of preterm neonates. This method estimates lipid fraction within the tissue as a simple surrogate marker of myelin maturation3.Methods
The myelin imaging method used here expresses the MR signal from T1-weighted, T2-weighted and proton density (PD)-weighted images as a linear sum of volume fractions for 3 segments: water bound in cell-dense tissue, lipid and cerebrospinal fluid (CSF).
The MR signal is then given as:
$$s = Hf$$
Where:
· s is the vector of signals for the 3 scans (T1w, T2w, PDw)
· f is the vector of estimated volume fractions
· H is the mixing matrix of expected signals for each compartment
Given signals s for each voxel, the volume fractions f can be estimated if H is known. Here, H is estimated by direct measurement of the respective T1w, T2w and PDw signals from each subject’s images, in regions assumed to consist of the pure tissue segment: the cortical ribbon, the subcutaneous fat, and the ventricles.
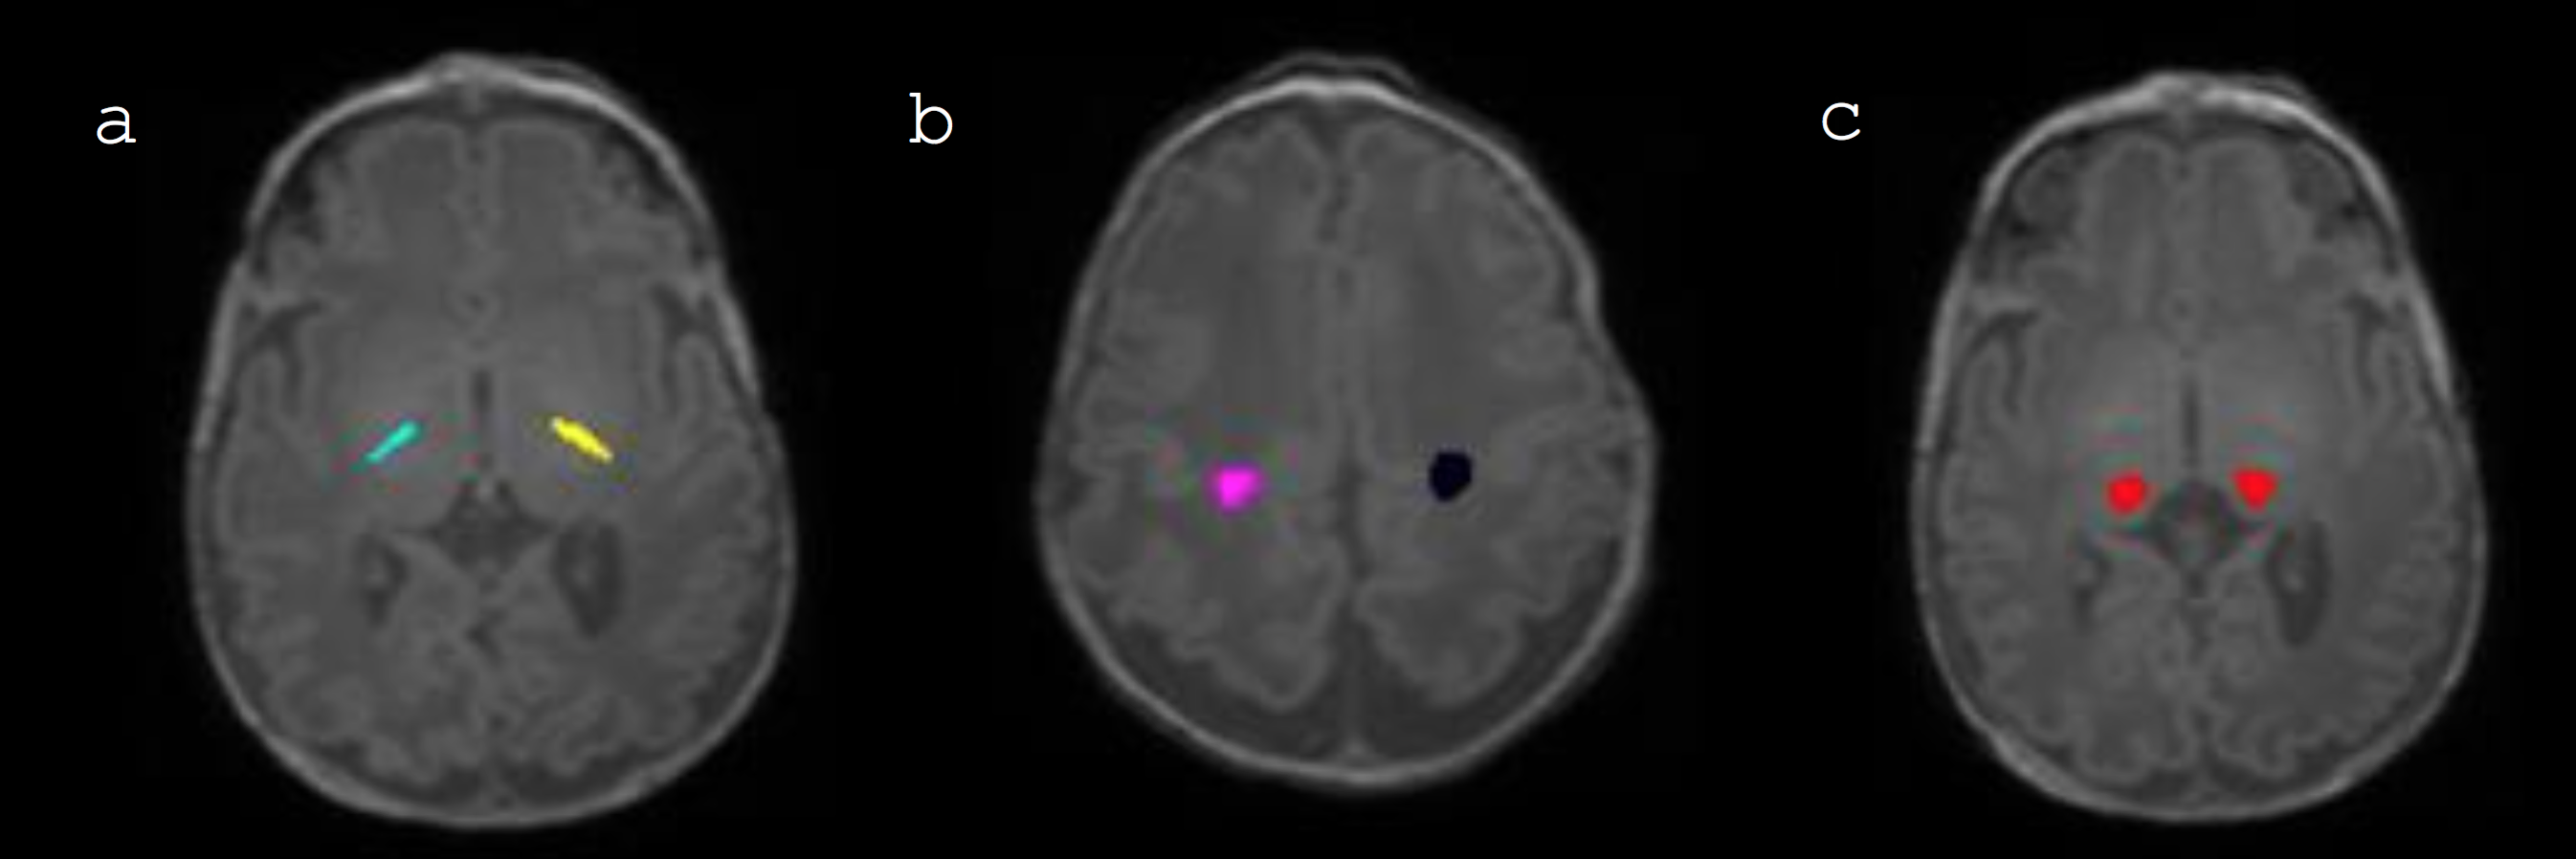
This method was applied in a cohort of n=90 preterm infants with a median gestational age of 29 weeks (range 23 - 35 weeks’) and post-menstrual age (PMA) of 40 weeks’ at scan (range 26 - 125 weeks’). The lipid-like fraction was measured in three regions of interest (ROI) differing in rate of myelination and quantity of myelin: the posterior limb of the internal capsule (PLIC), the corticospinal tracts at the level of the centrum semiovale (CTSO) and the pulvinar nuclei (PN) (Figure 1).
MRI was performed on a Philips 3-Tesla system (Philips Medical Systems, Netherlands) using an 8-channel phased array head coil. A 3D MPRAGE sequence for T1-w images (TR 17 msec, TE 4.6 msec, flip angle 13°, 0.82mm isotropic voxel size, 4:00 scan time) and a dual-echo 3D TSE sequence for PD-w and T2-w images (TR 10s, TE 12.8 & 160ms, reconstructed voxel size 0.86x0.86x1mm, 8:40 scan time) were used to acquire the images.
Results
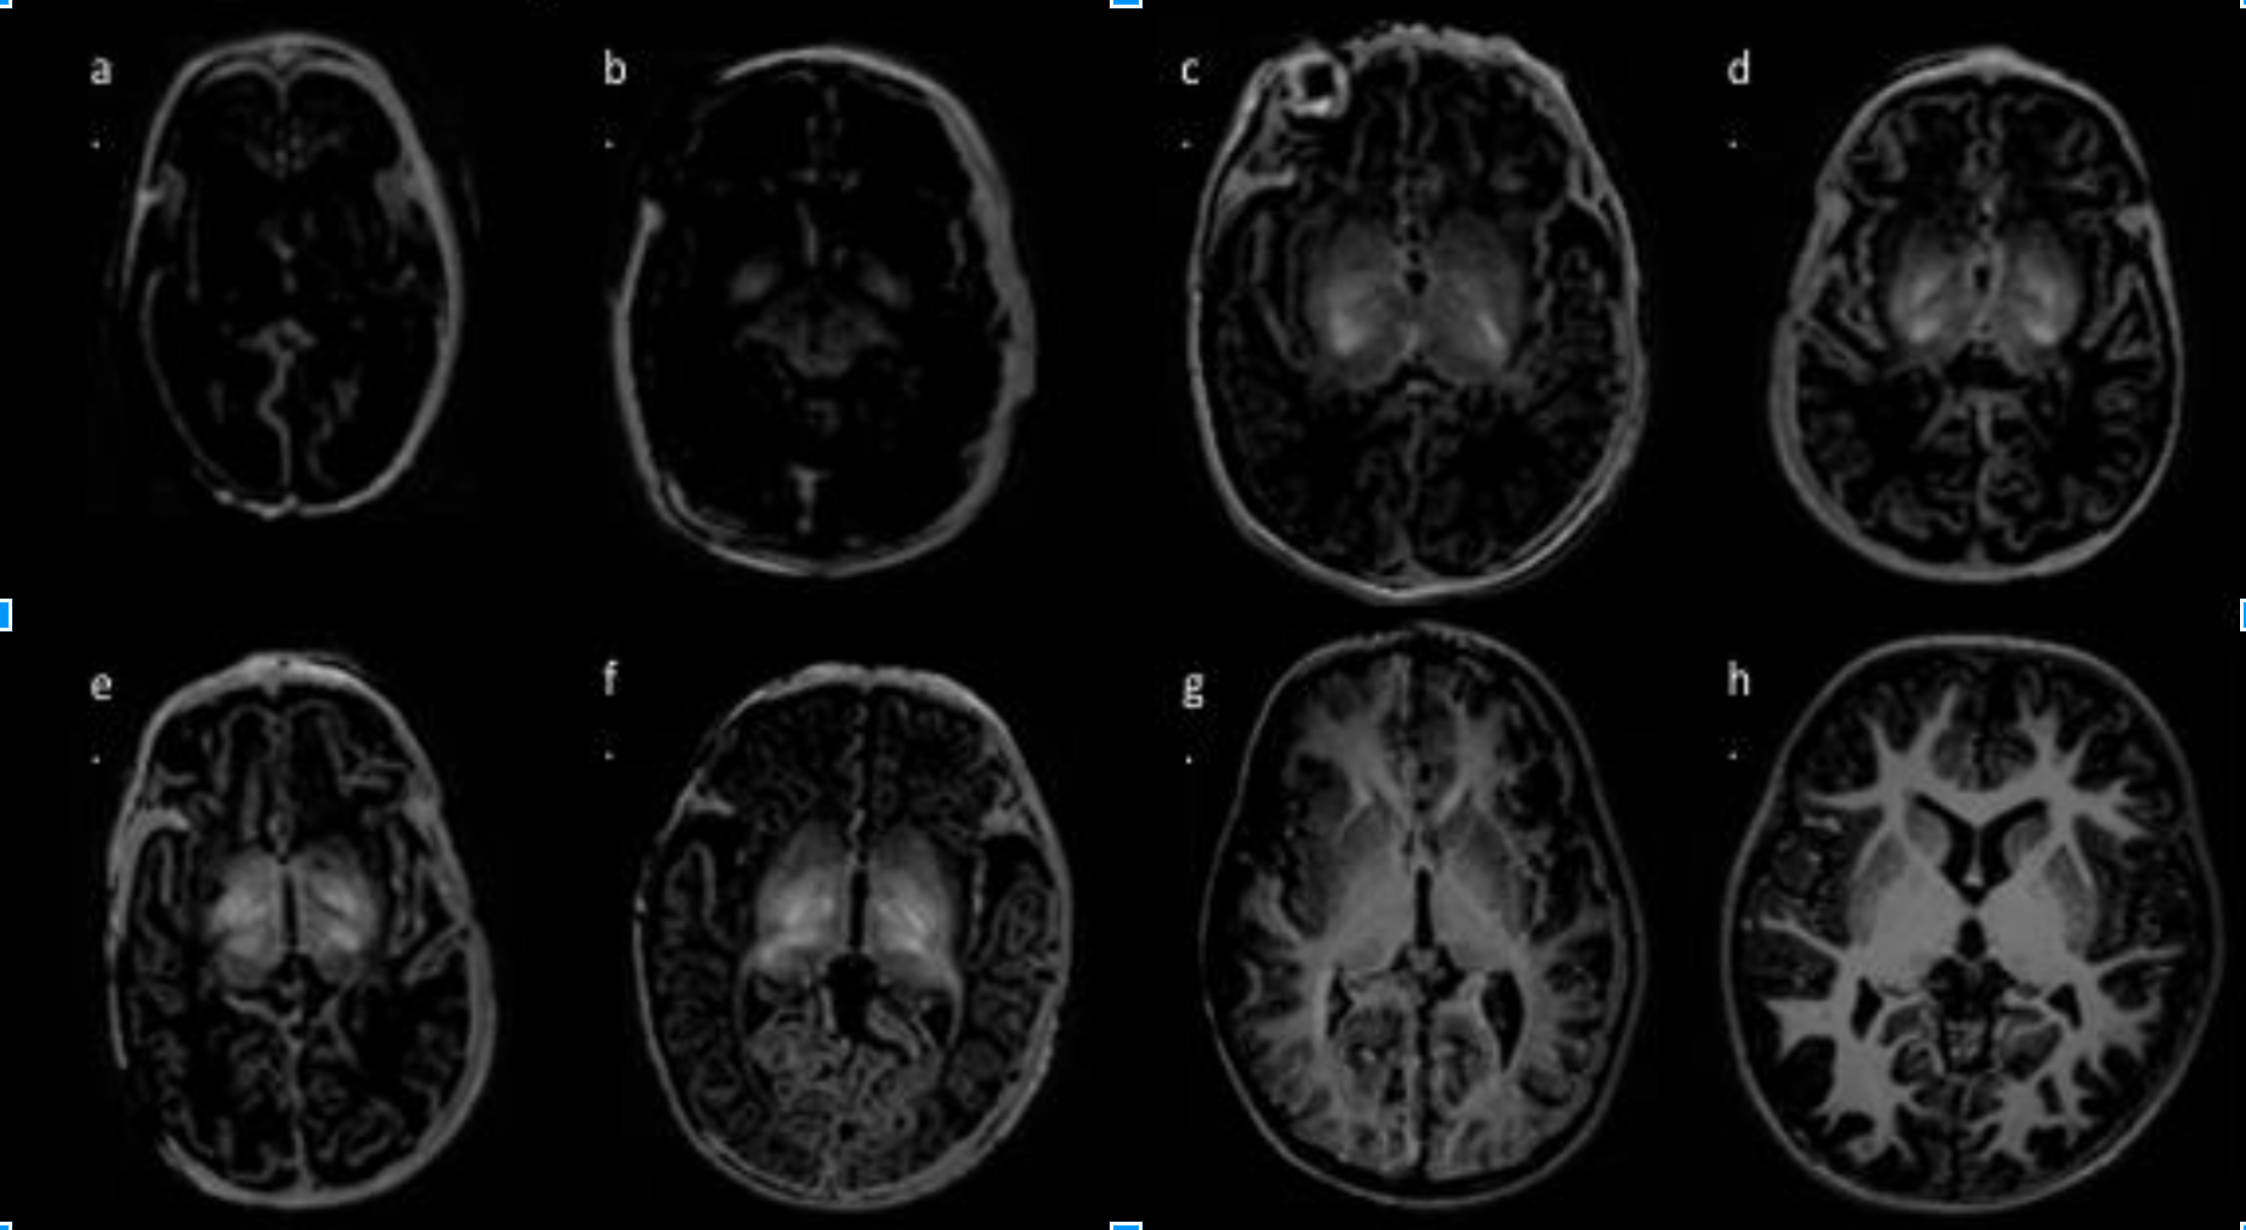
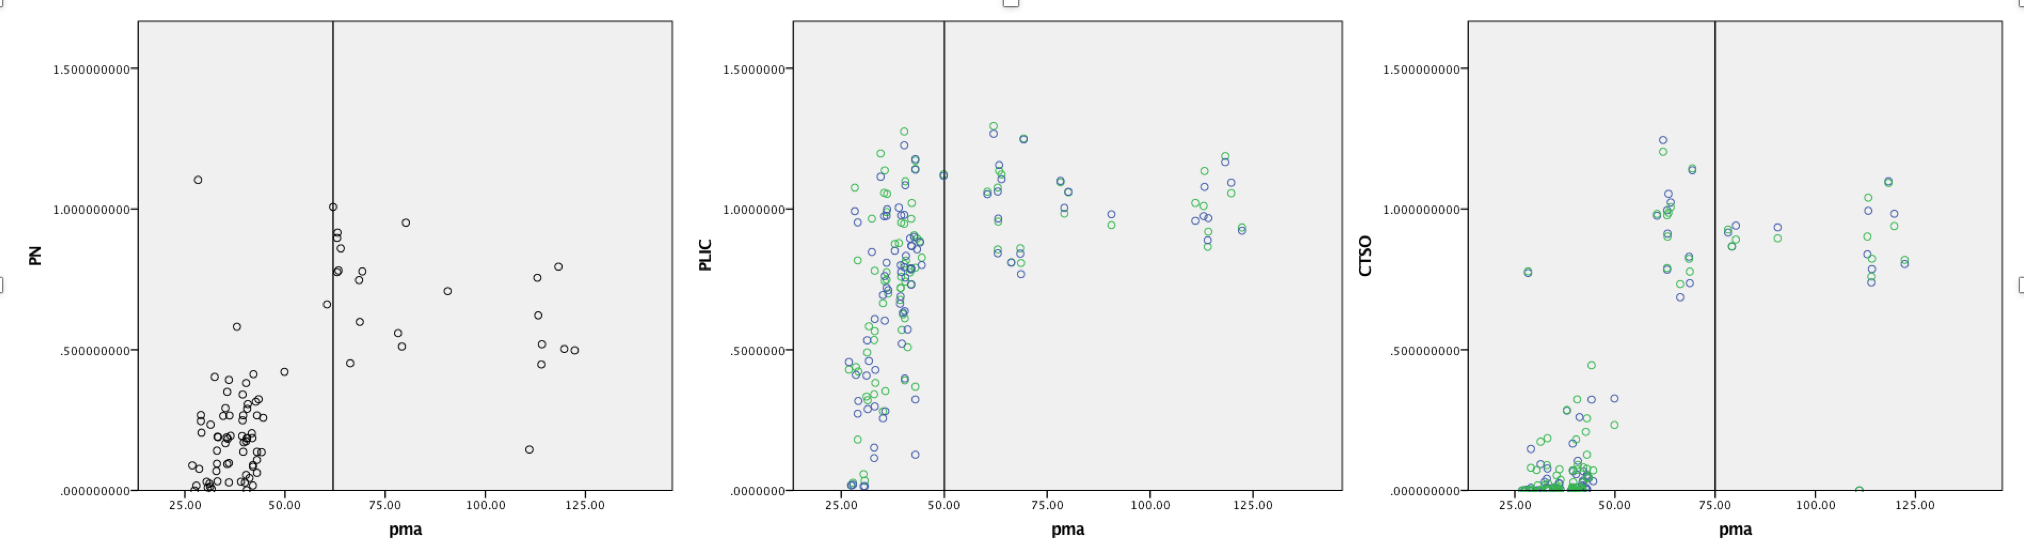
The lipid fractions show an increase with age (Figure 2). We found 2 clear phases in our results: an initial linear increase followed by a plateau phase (Figure 3). In the primary phase, linear regression analysis for each ROI strong significant positive correlation p<0.0005 for each ROI against PMA with a high degree of linearity between CTSO (adjusted R2 = 78.5%) and PN (adjusted R2 = 63.5%) (Figure 4). Each ROI regression model was confirmed to be statistically significant from the others (p<0.005).Discussion
In this study, we have demonstrated the use of a simple lipid mapping technique based on routinely acquired data to successfully investigate myelination in neonates. The method provides maps of the lipid-like signal that are in good agreement with the expected spatio-temporal pattern of myelination over this age range (Figure 2).
Of the 3 regions assessed, the PLIC appear to myelinate first, with a peak fraction reached from 50 weeks PMA. This is concordant with prior studies showing the PLIC as fully myelinated by the third post-natal months4,5.
The CTSO begin myelinating from 35 weeks and plateau from 75 weeks PMA. Kinney et al.5 described a similar period of myelination for the CTSO and PLIC. The apparent delay in measurements may be related to the presence of other fibres known to myelinate much later (commissural and association) in this region5.
The signal in the PN reaches a plateau at a lower intensity (0.58 units), with a later onset and slower rate of myelination than the PLIC and CTSO. In the PN, projections are seen to the visual, posterior parietal, premotor and prefrontal cortices. This region is also closely connected to the lateral and medial geniculate nuclei and together they are associated with visual attention and tracking 6. The full development of this region is established by 6 months postnatally 7. In our study, we show the PN region to be fully myelinated by 65 weeks PMA, concordant with this developmental milestone.
Conclusion
Our results suggest that the recently proposed myelin mapping method 3 can be used successfully to investigate white-matter maturation in a preterm born infant population. Future studies will investigate the applicability of this method for myelin mapping in more ROIs to characterise white matter maturation in more detail.Acknowledgements
References
[1] Alonso-Ortiz, E., Levesque, I.R., Pike, G.B., 2015. MRI-based myelin water imaging: A technical review. Magn Reson Med 73, 70–81. doi:10.1002/mrm.25198Welker,
[2] K. M. and A. Patton (2012). "Assessment of normal myelination with magnetic resonance imaging." Semin Neurol 32(1): 15-28.
[3] Tournier J-D, Teixeira R, Murgasova M, Edwards AD, Hajnal J, Counsell S. A Simple Method for Myelin Mapping Using T1-Weighted, T2-Weighted and PD-Weighted Images. Proceedings of the ISMRM, 24th annual meeting, Singapore, May 2016.
[4] Baumann, N. and D. Pham-Dinh (2001). "Biology of oligodendrocyte and myelin in the mammalian central nervous system." Physiol Rev 81(2): 871-927.
[5] Kinney, H. C., et al. (1988). "Sequence of Central Nervous System Myelination in Human Infancy." II. Patterns of Myelination in Autopsied Infants 47(3): 217-234.
[6] Reynolds, C. and E. Fletcher-Janzen (2009). Handbook of Clinical Child Neuropsychology, Springer US.
[7] Colombo, J. (2001). "The Development of Visual Attention in Infancy." Annual Review of Psychology 52(1): 337-367. .
Figures