2286
Spherical Wavelets based Study of Multi-scale Cortical Folding in Infants1Department of Radiology and BRIC, University of North Carolina at Chapel Hill, Chapel Hill, NC, United States, 2College of Biomedical Engineering & Instrument Science, Zhejiang University, Hangzhou, People's Republic of China, 3Department of Psychiatry, University of North Carolina at Chapel Hill, Chapel Hill, NC, United States
Synopsis
Examining cortical folding development at various scales may help better understand brain cognition and motor functions. We propose a curvature-based multi-scale method using spherical wavelets to study the longitudinal changes of cortical folding during infancy. We applied our method on 219 longitudinal MR images from 73 healthy infants at 0, 1, and 2 years of age. We reveal scale-specific and region-specific developmental patterns of infant cortical folding. Specifically, at coarser levels, many primary folds flatten out; while at finer levels, the majority of the minor folds become more convoluted, providing new insights into early brain development.
Introduction
The human cerebral cortex is a highly convoluted shape, which grows dramatically during infancy. Cortical folding is related to brain cognition and motor functions, and its abnormal development is associated with many neurodevelopmental disorders, such as autism and schizophrenia1. However, little is known about how the cortical folding develops during the first two postnatal years. For instance, cortical folding can be characterized at multiple spatial-frequency scales, but most existing methods, such as gyrification index2 based methods and curvature3 or sulcal depth based methods, typically only capture a limited single-scale information of the rich and complex geometry of the cortex. In this study, we propose a curvature-based multi-scale method using spherical wavelets to map the complicated longitudinal changes of cortical folding during infancy.Methods
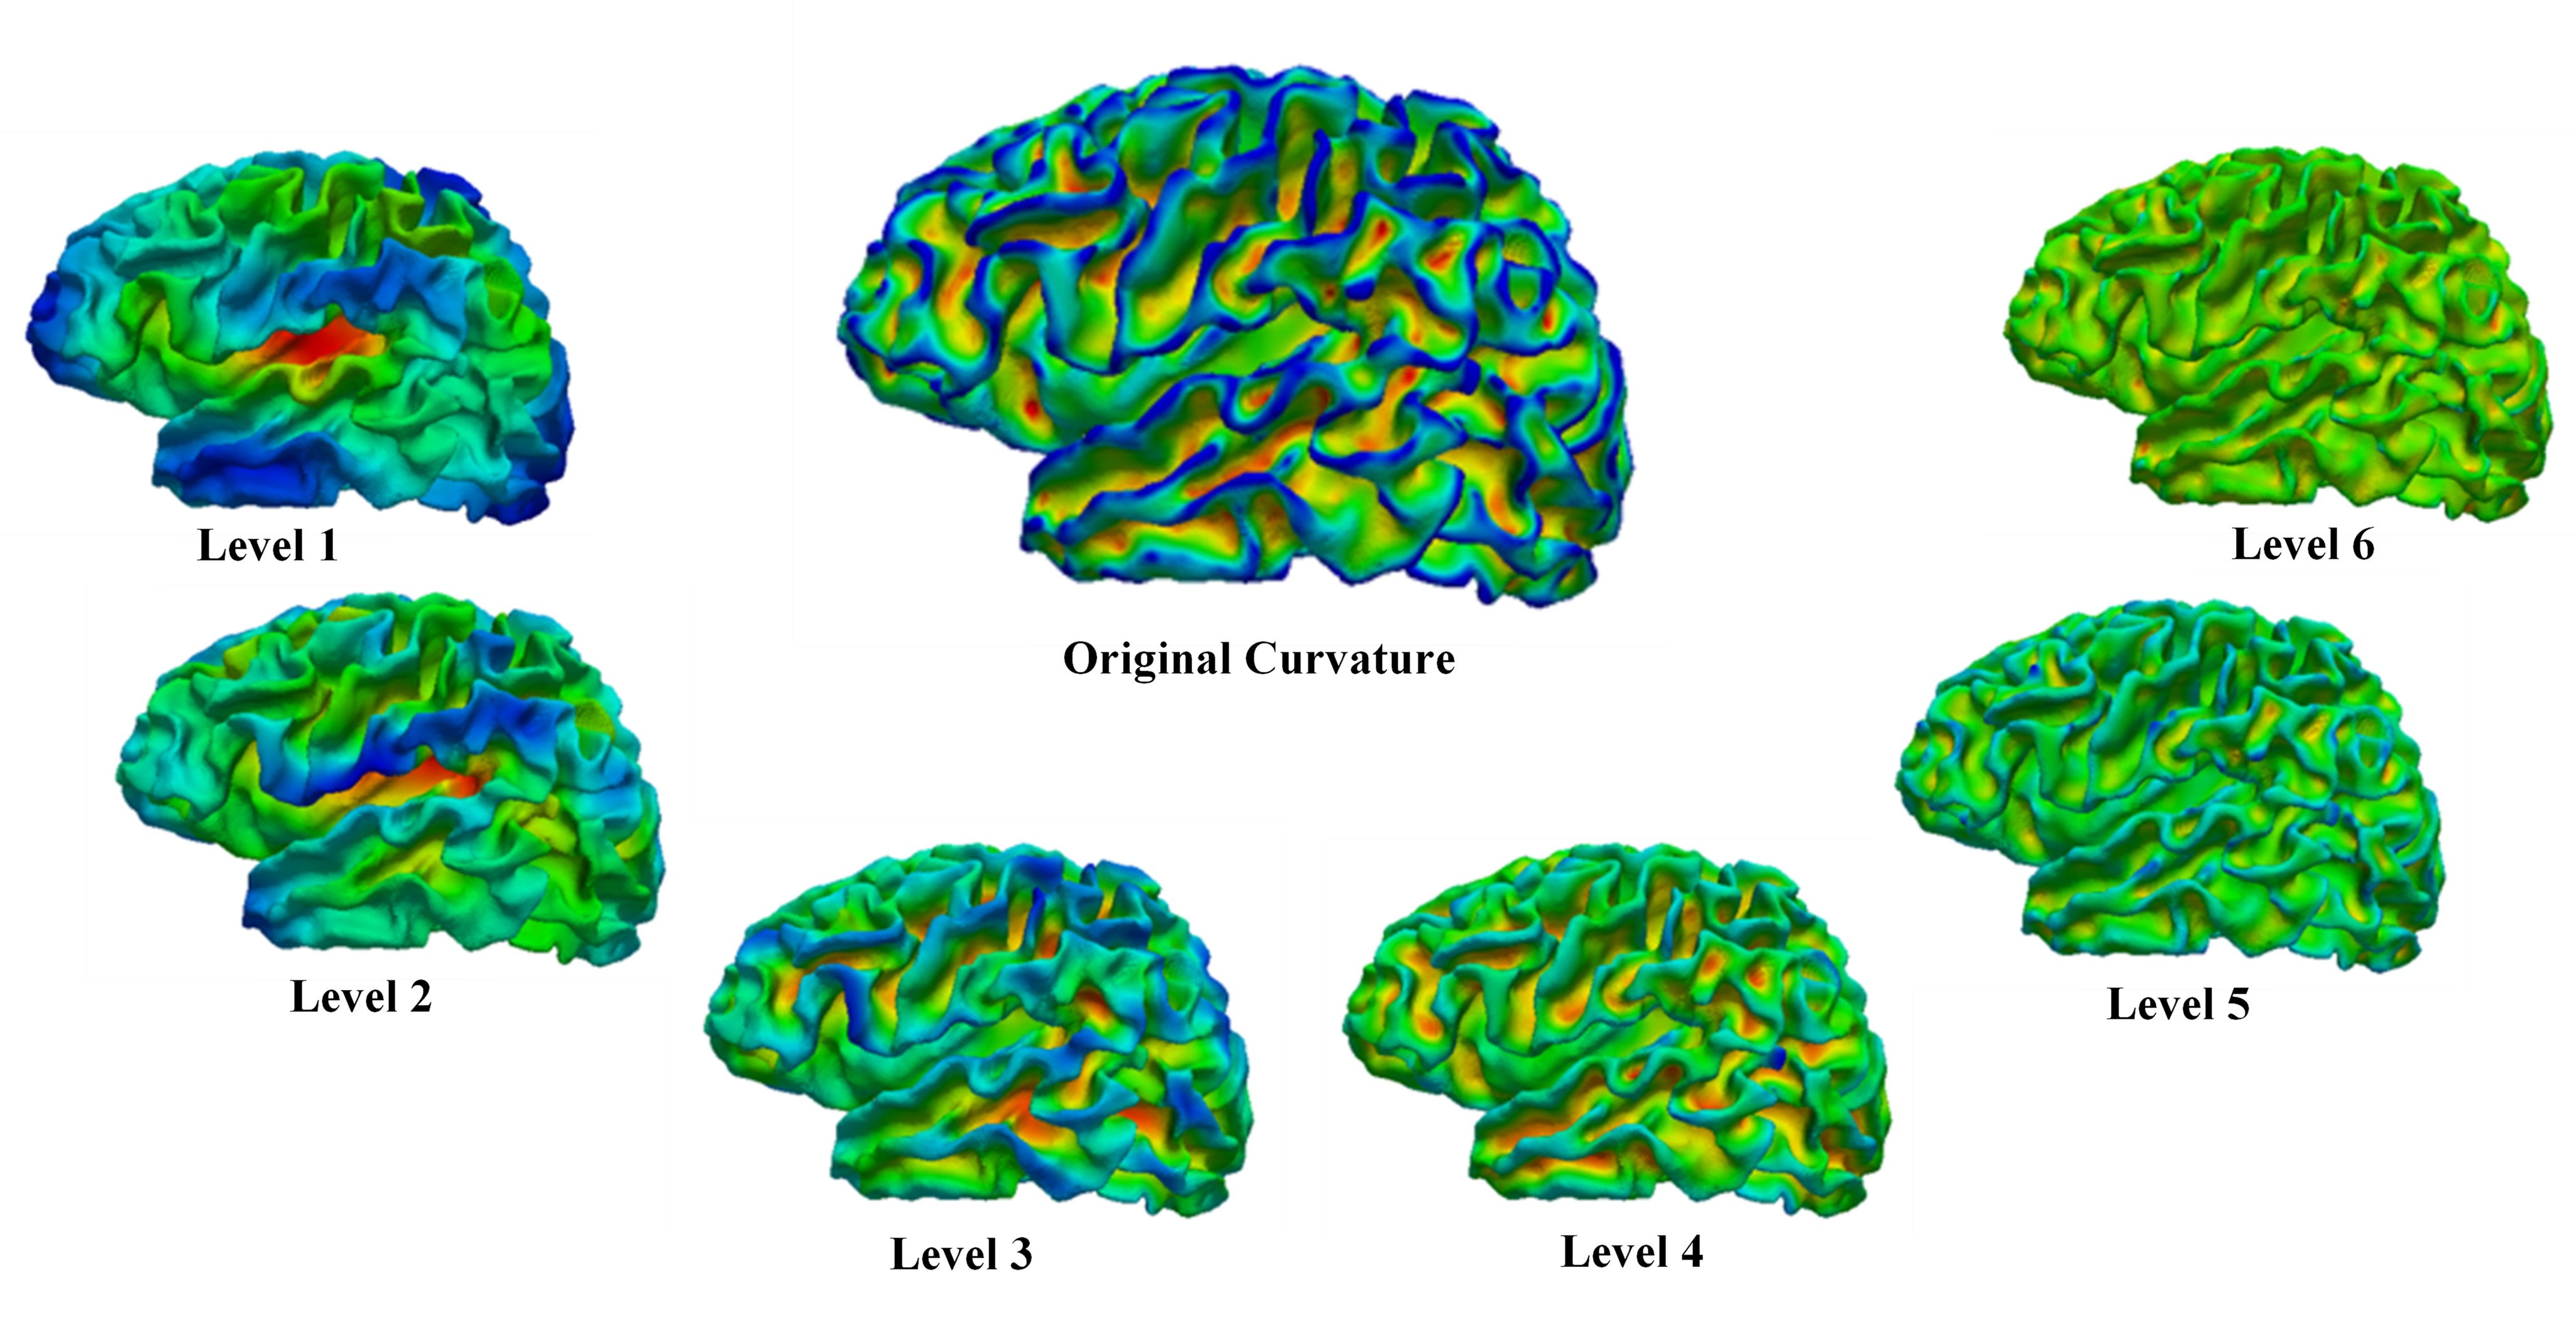
Totally 219 MR images from 73 healthy infants at 0, 1 and 2 years of age were acquired on a Siemens head-only 3T scanner. T1-weighted images were obtained with 3D magnetization-prepared rapid gradient echo sequence. T2-weighted images were acquired by using a turbo spin-echo sequence. All MR images were processed through an infant-dedicated computational pipeline4. After preprocessing, topologically-correct inner and outer cortical surfaces were reconstructed using a deformable surface method. The inner cortical surface was further smoothed, inflated, and mapped to a standard sphere. Both intra-subject and inter-subject vertex-to-vertex cortical correspondences were then established using Spherical Demons5. We calculated the mean curvature map on each inner cortical surface, and then performed the over-complete spherical wavelet transform6 to decompose the curvature map into 6 levels in spatial-frequency domains, as shown in Fig. 1. For cortical folding analysis, the wavelet power of each vertex at each scale was defined as the square of corresponding wavelet coefficient. For each cortical region, we compute the average wavelet power of all its vertices. We also computed the mean change rate of the average wavelet power in each cortical region across all subjects through age 0-1 and 1-2, separately. Finally, we performed a paired t-test to study the statistical significance of cortical folding changes during 0-1 year and 1-2 years, and performed multiple comparisons correction using the false discovery rate (FDR).Results
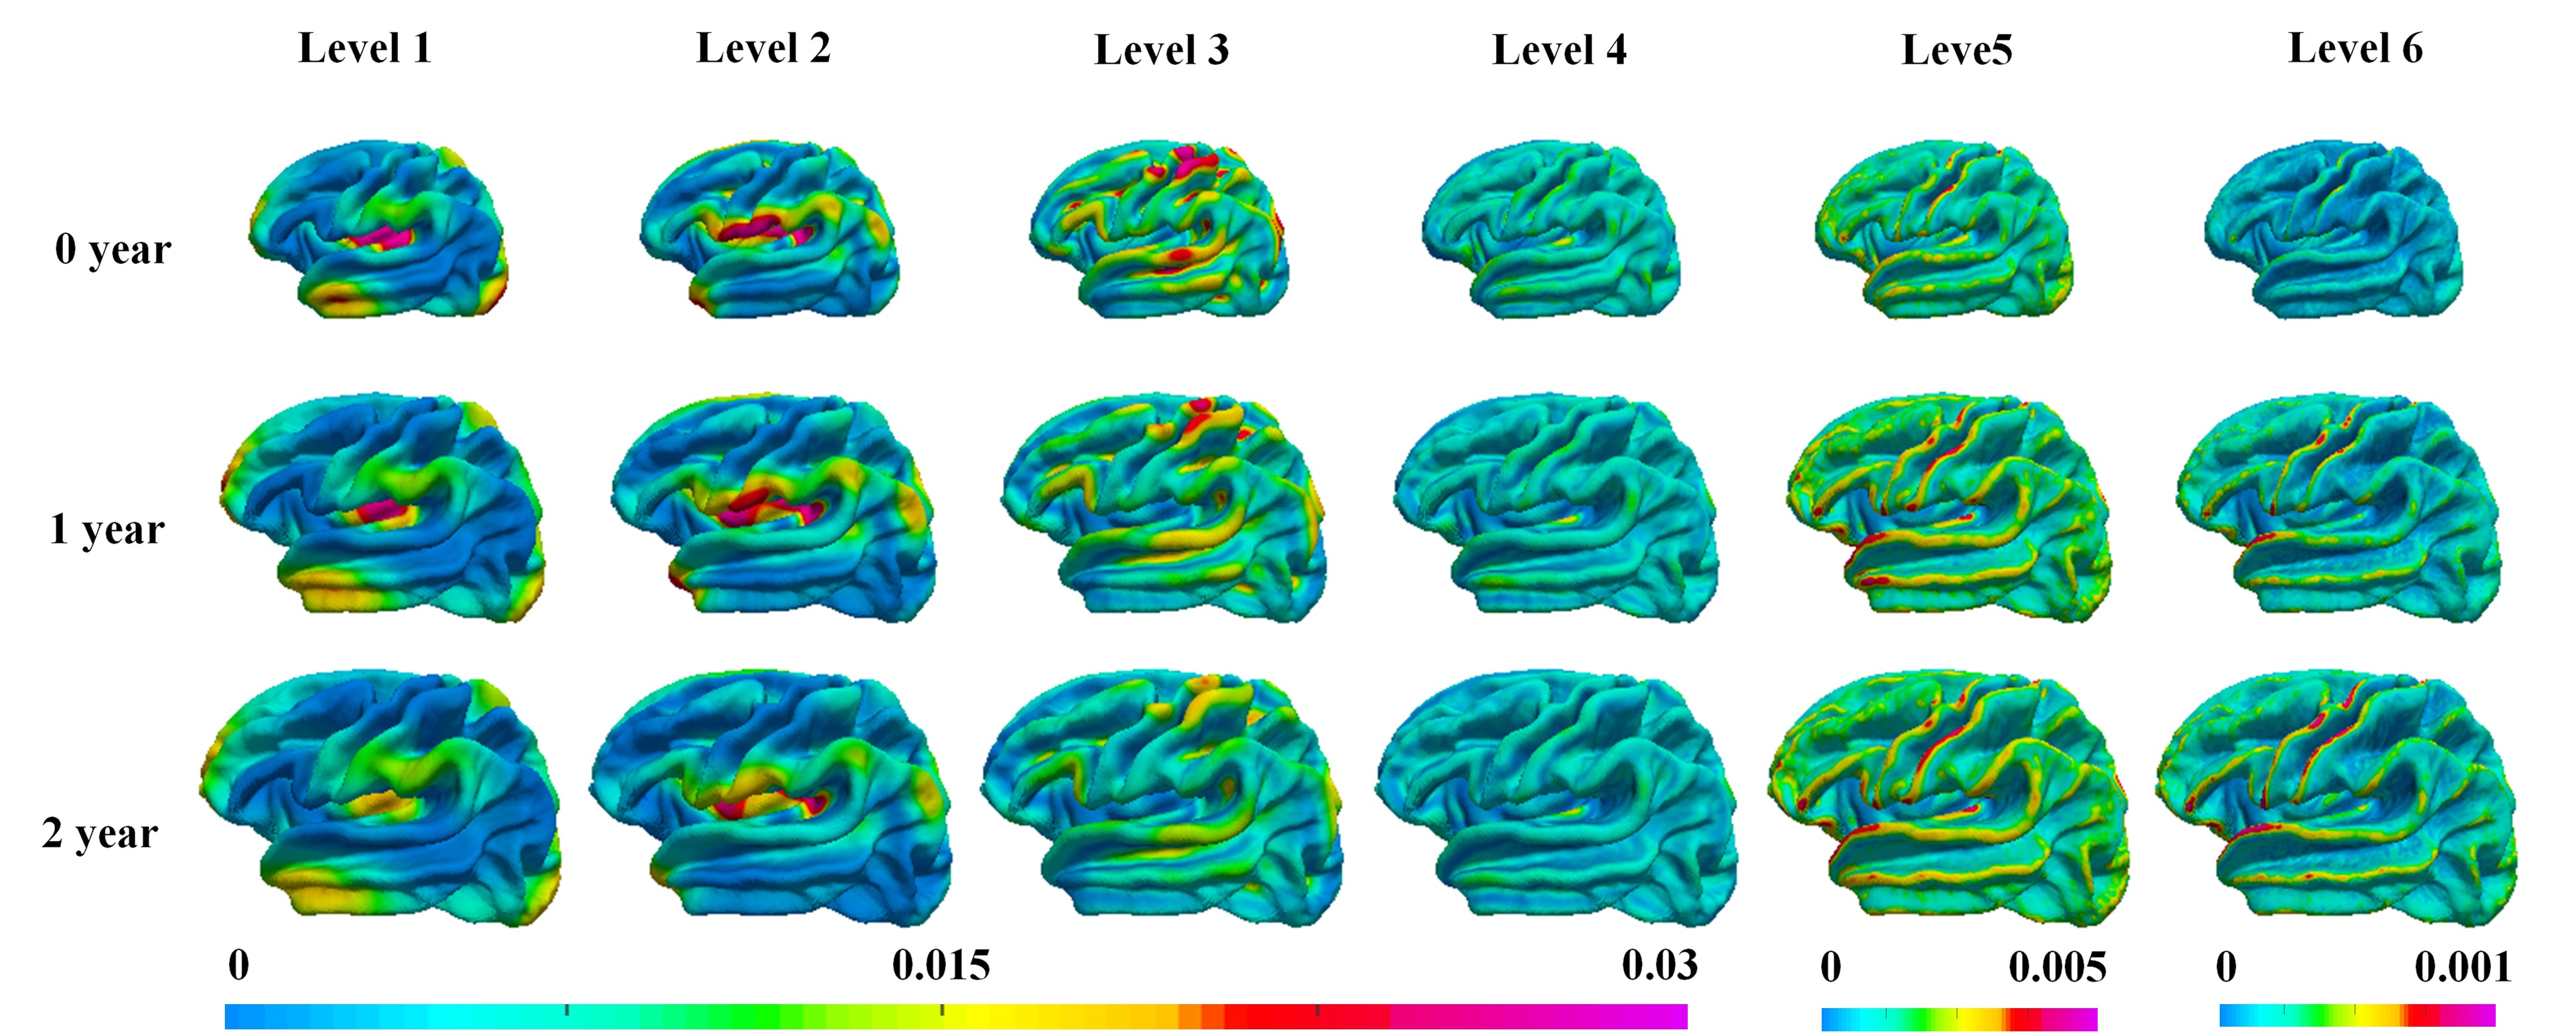
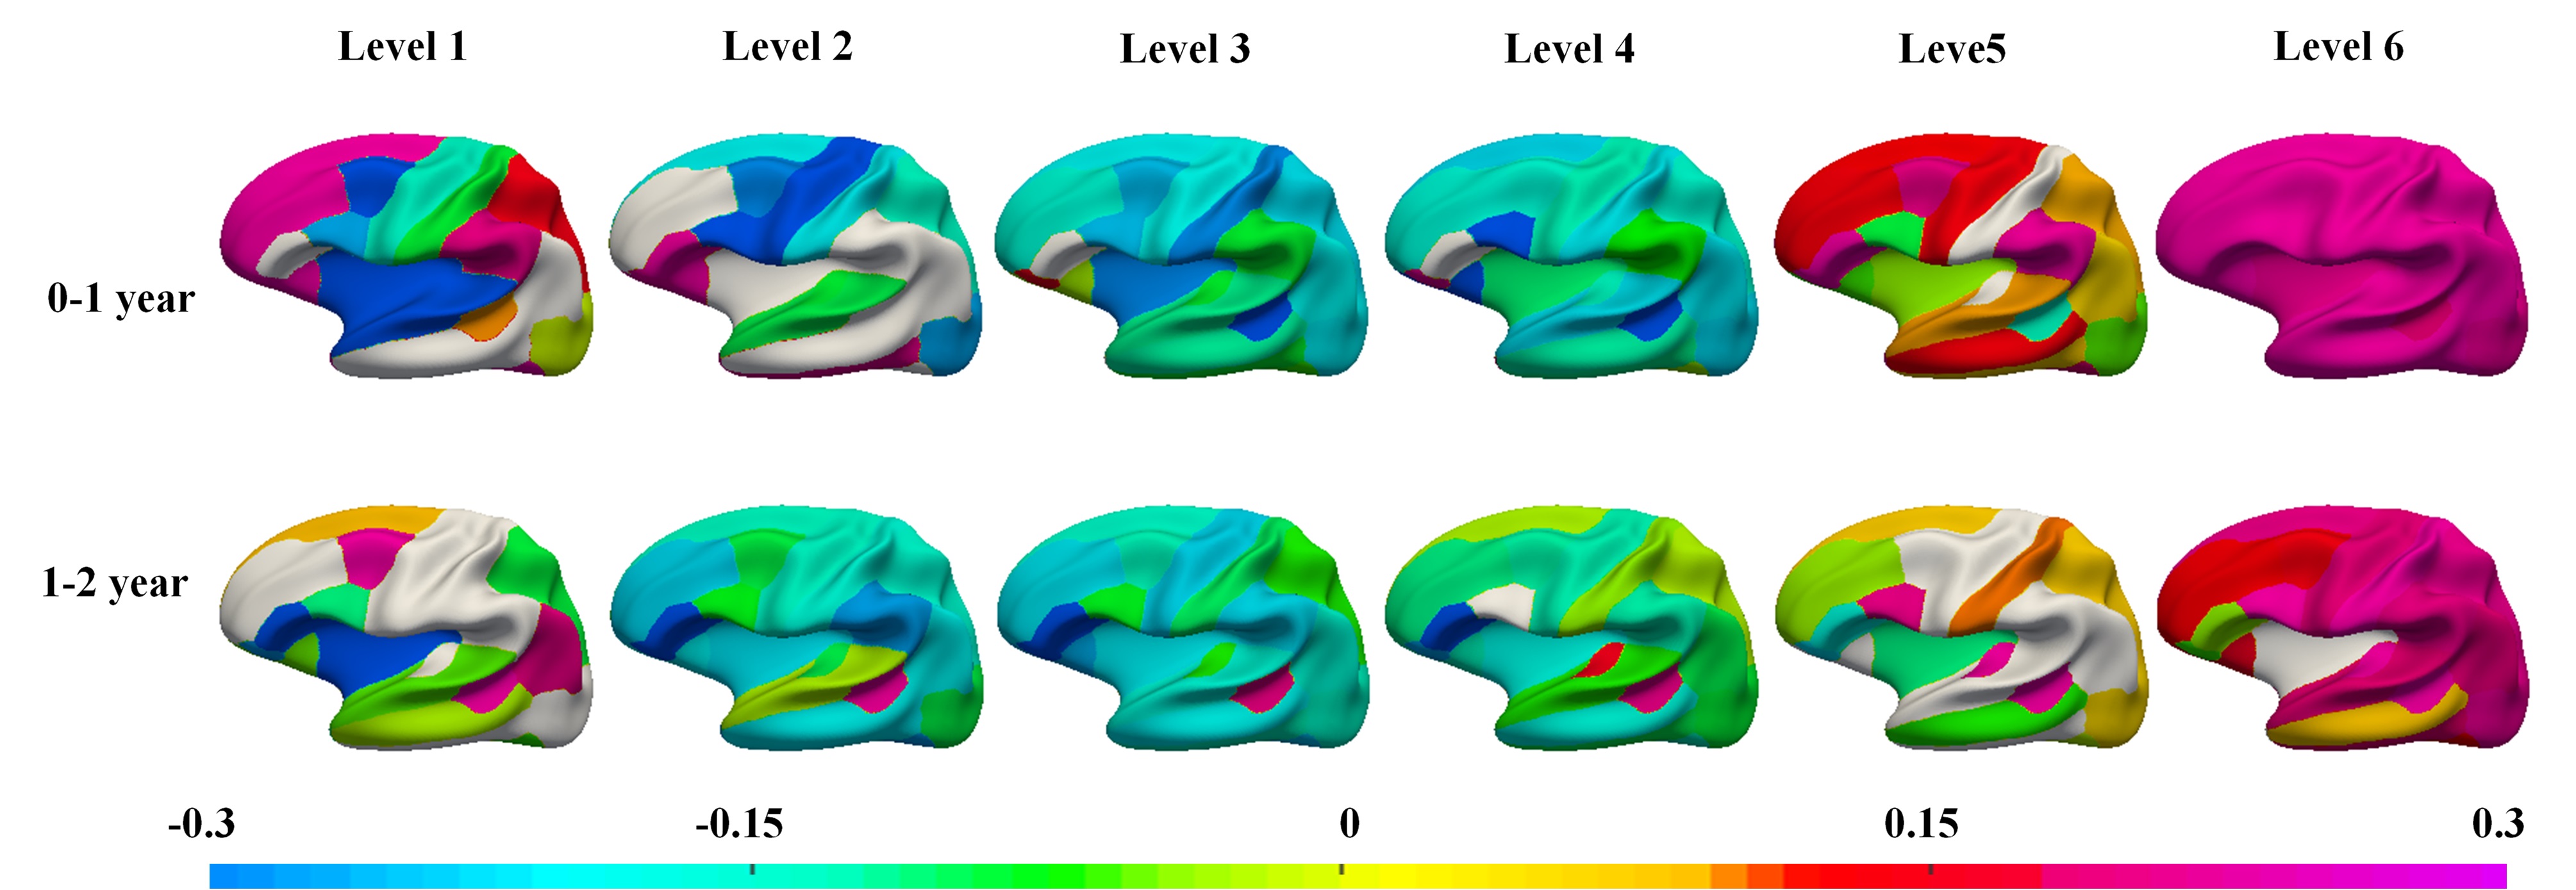
Fig. 2 depicts the vertex-wise mean wavelet power of the decomposed curvature maps. As we can see, the wavelet power is region-specific and scale-specific during first 2 years. At coarser levels 1 and 2, regions with higher wavelet power locate in primary folds, such as the frontal pole, temporal pole, occipital pole, insula cortex and superior parietal cortex, capturing large-scale folding information; at levels 3 and 4, they largely locate in the sulcal bottoms and their adjacent gyral crests of primary folds, such as the central sulcus and superior frontal sulcus; while in finer levels 5 and 6, they mainly locate on various gyral crests, reflecting fine-scale folding information. As for the magnitude patterns, Fig. 2 displays slight decrease at coarser levels 1-4, while slight increase at finer levels 5-6. Fig. 3 shows the change rate of the wavelet power in ROIs at various scales is region-specific and age-specific. During the first year, at level 1, the unimodal cortices (e.g., sensorimotor area, auditory cortex, and visual cortex) and Broca’s area decrease in wavelet power, whereas high-order association cortices (e.g., prefrontal cortex and parietal cortex) increase in wavelet power; at levels 2-4, most regions exhibit a decreasing trend; while at levels 5-6, most regions exhibit an increasing trend. During the second year, the overall change trends at different levels are somewhat similar to that in the first year. Together, these results may indicate that: as the brain grows, at very coarser spatial-frequency levels, primary folds of specific regions, such as the insula cortex and unimodal cortices, flatten out (i.e., negative change rate), especially in the first year; while at very finer spatial-frequency levels, small folds in most regions become more convoluted (i.e., positive change rate). Furthermore, we notice that most regions in the frontal cortex become more folded, especially in the first year, which is consistent with the published results7.Discussion and Conclusion
We proposed a new approach to analyze the longitudinal infant cortical folding, by leveraging spherical wavelets to decompose the cortical curvature maps into multi-scales, with each scale encoding the folding information at a different level. We revealed scale-specific and region-specific changes in cortical folding. Future work will include studying gender and cognitive functions in relation to cortical folding and the use of different features (e.g., sulcal depth) to further examine the development of cortical folding.Acknowledgements
This work was supported in part by NIH grants (MH108914 and MH107815).References
[1] Zilles K, Palomero-Gallagher N, Amunts K. Development of cortical folding during evolution and ontogeny. Trends Neurosci 36, 275-284 (2013).
[2] Mangin J F, Jouvent E, Cachia A. In-vivo measurement of cortical morphology: means and meanings. CurrOpinNeurol 23, 359-367 (2010).
[3] Luders E, Thompson P M, Narr K L, et al. A curvature-based approach to estimate local gyrification on the cortical surface. Neuroimage 29, 1224-1230 (2006).
[4] Li G, Wang L, Shi F, et al. Construction of 4D high-definition cortical surface atlases of infants: Methods and applications. Med Image Anal 25, 22-36 (2015).
[5] Yeo B T T, Sabuncu M R, Vercauteren T, et al. Spherical demons: fast diffeomorphic landmark-free surface registration. IEEE Trans Med Imaging 29, 650-668 (2010).
[6] Yeo B T T, Yu P, Grant P E, et al. Shape analysis with overcomplete spherical wavelets. in MICCAI, 468-476 (2008).
[7] Li G, Wang L, Shi F, et al. Mapping longitudinal development of local cortical gyrification in infants from birth to 2 years of age. J Neurosci 34, 4228-4238 (2014).
Figures