2285
Relationship between Surface Area, Cortical Thickness and Folding in Infants1Department of Radiology and BRIC, University of North Carolina at Chapel Hill, Chapel Hill, NC, United States, 2Department of Psychiatry, University of North Carolina at Chapel Hill, Chapel Hill, NC, United States
Synopsis
An intrinsic relationship between surface area, cortical thickness and folding
Introduction
Although the cerebral cortex varies greatly in size, folding degree and patterns across species in adult mammalian brains, an intrinsic relationship between surface area, cortical thickness and folding was found. Specifically, given At as the total surface area, T as the average cortical thickness, Ae as the exposed surface area, the mathematic description of AtT1/2=kAe1.305 was discovered 1, where k is a constant. This was further confirmed in recent MRI studies of older human children and adults 2, and was thought to closely relate to a mechanism of cortical folding that minimizes an effective free energy term 1,2 and predicts the relation of AtT1/2=kAe5/4. However, it remains unclear whether this relationship presents in human neonates, and how it evolves during the dynamic brain development in the first two years, with dramatic increase of surface area, cortical thickness and folding 3,4. To fill this knowledge gap, we jointly analyze surface area, cortical thickness, and folding at birth, 1, and 2 years of age, using 219 longitudinal MRI scans.Methods
Results
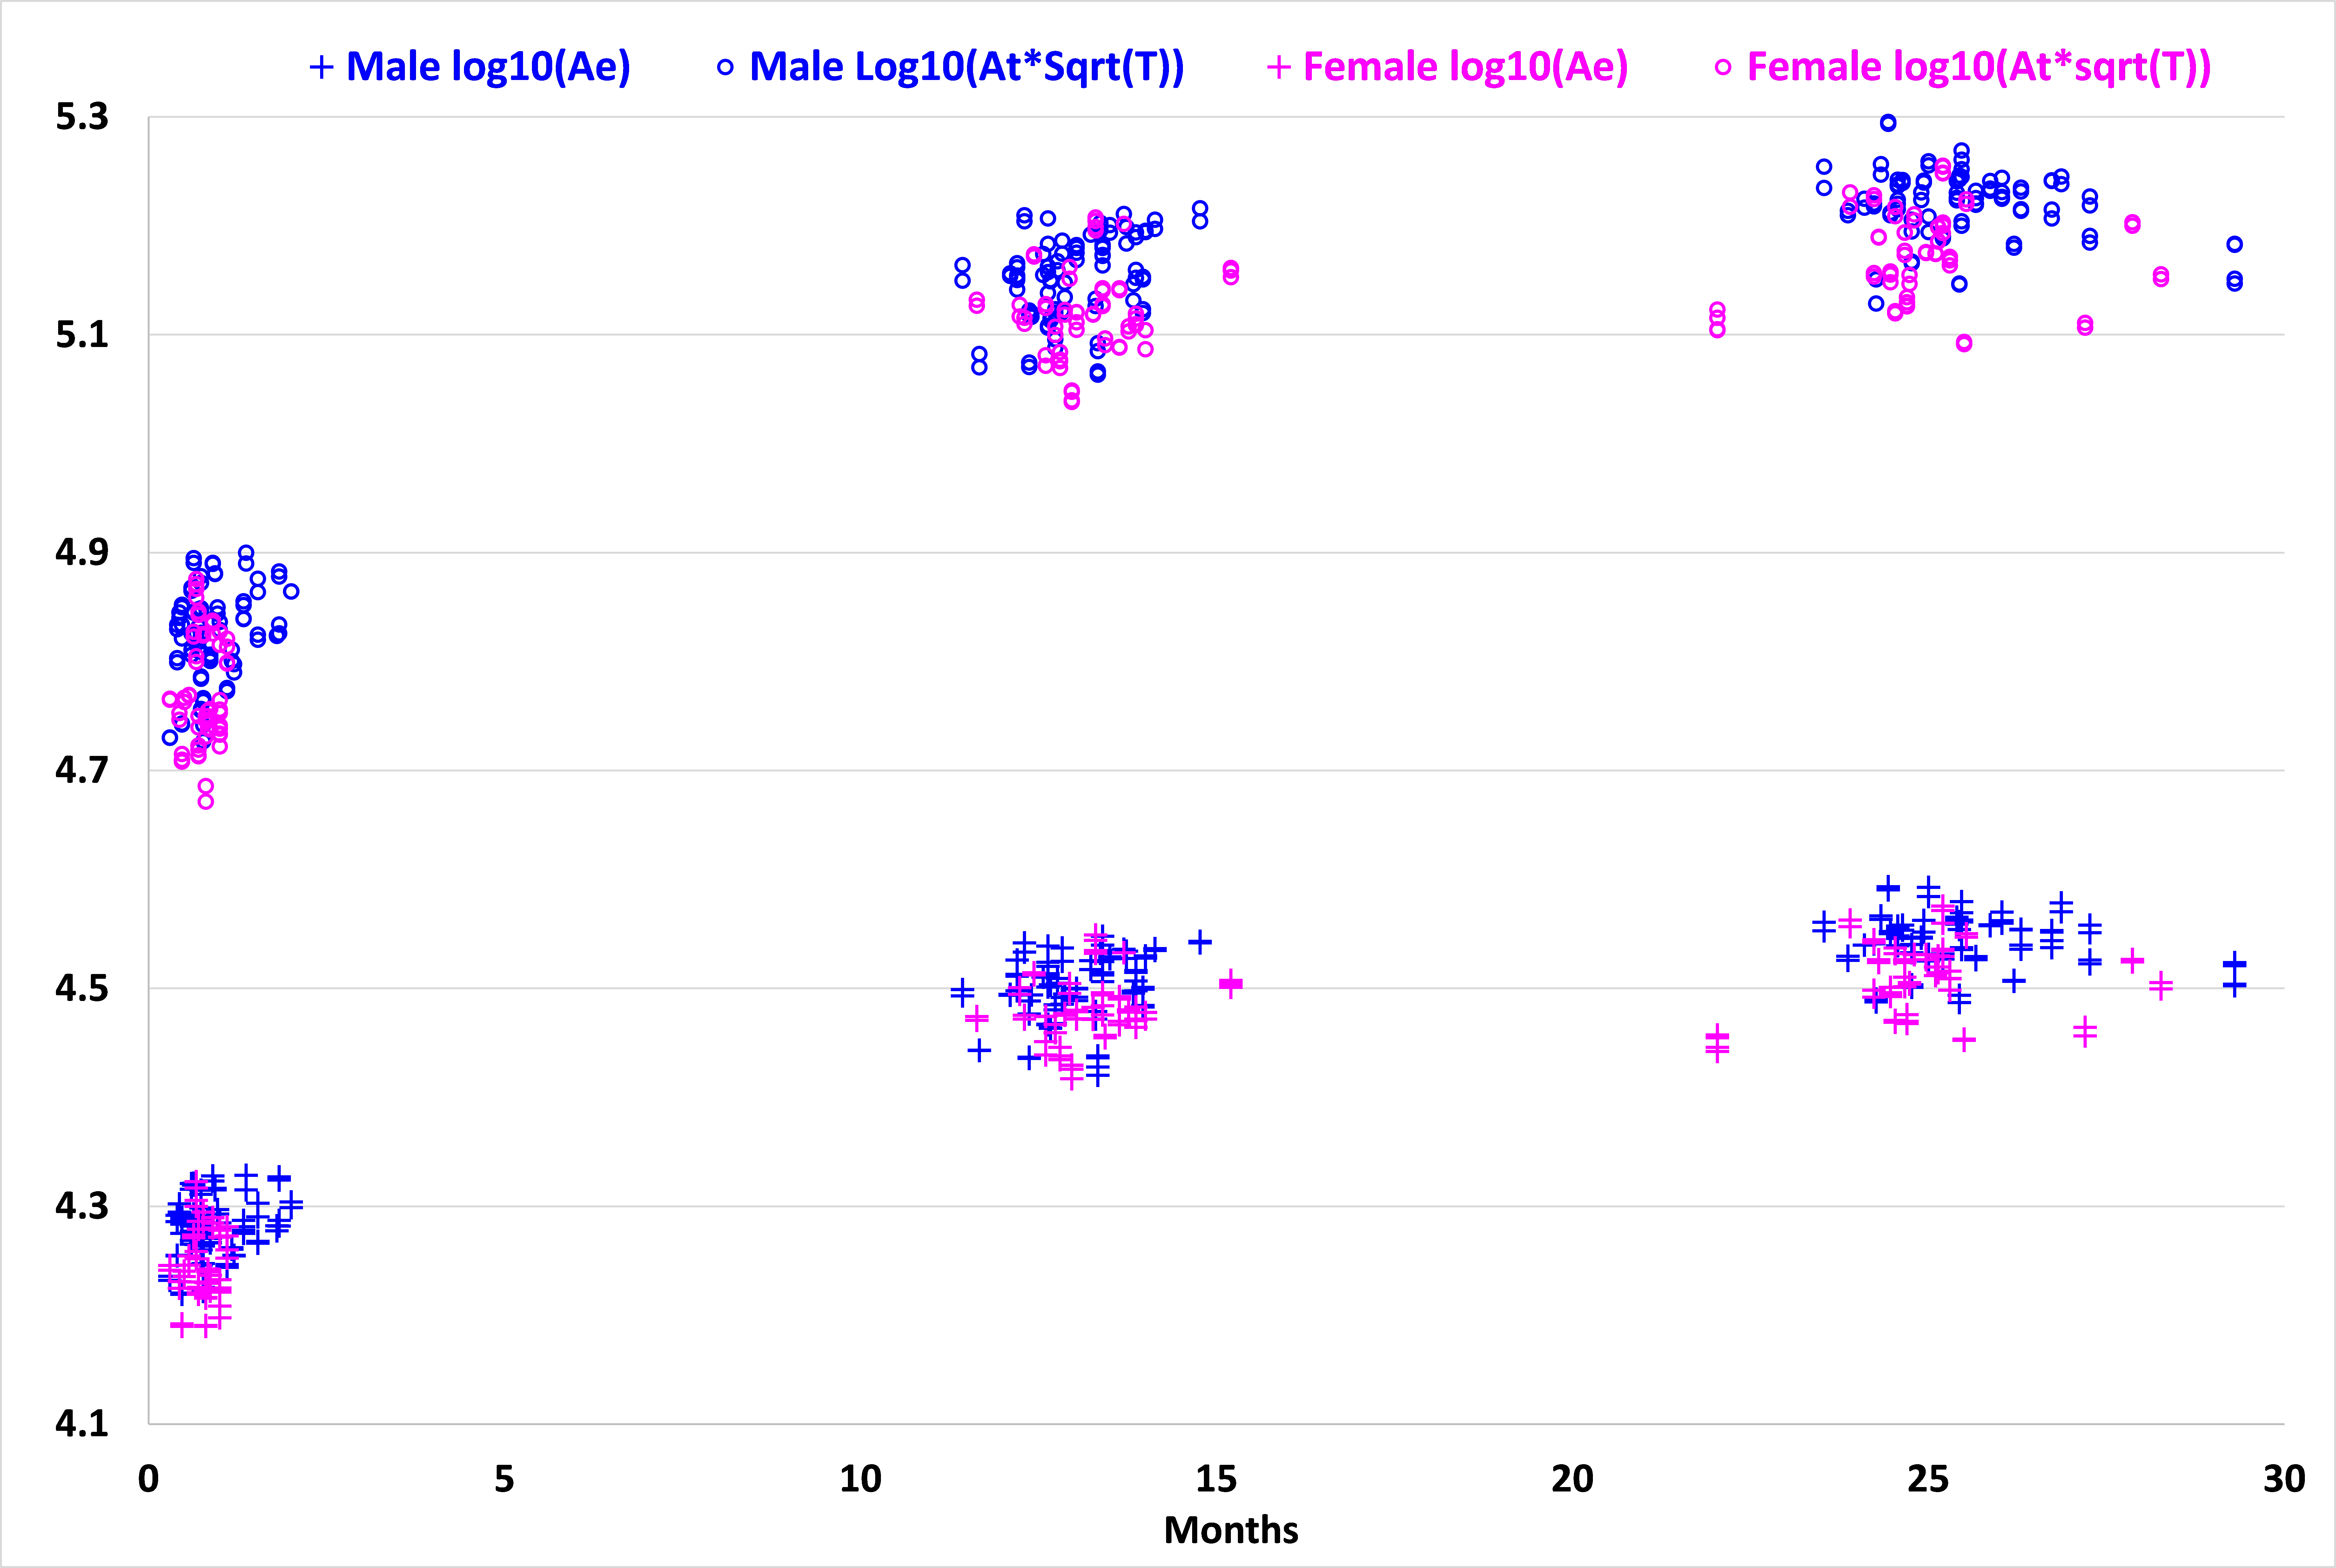
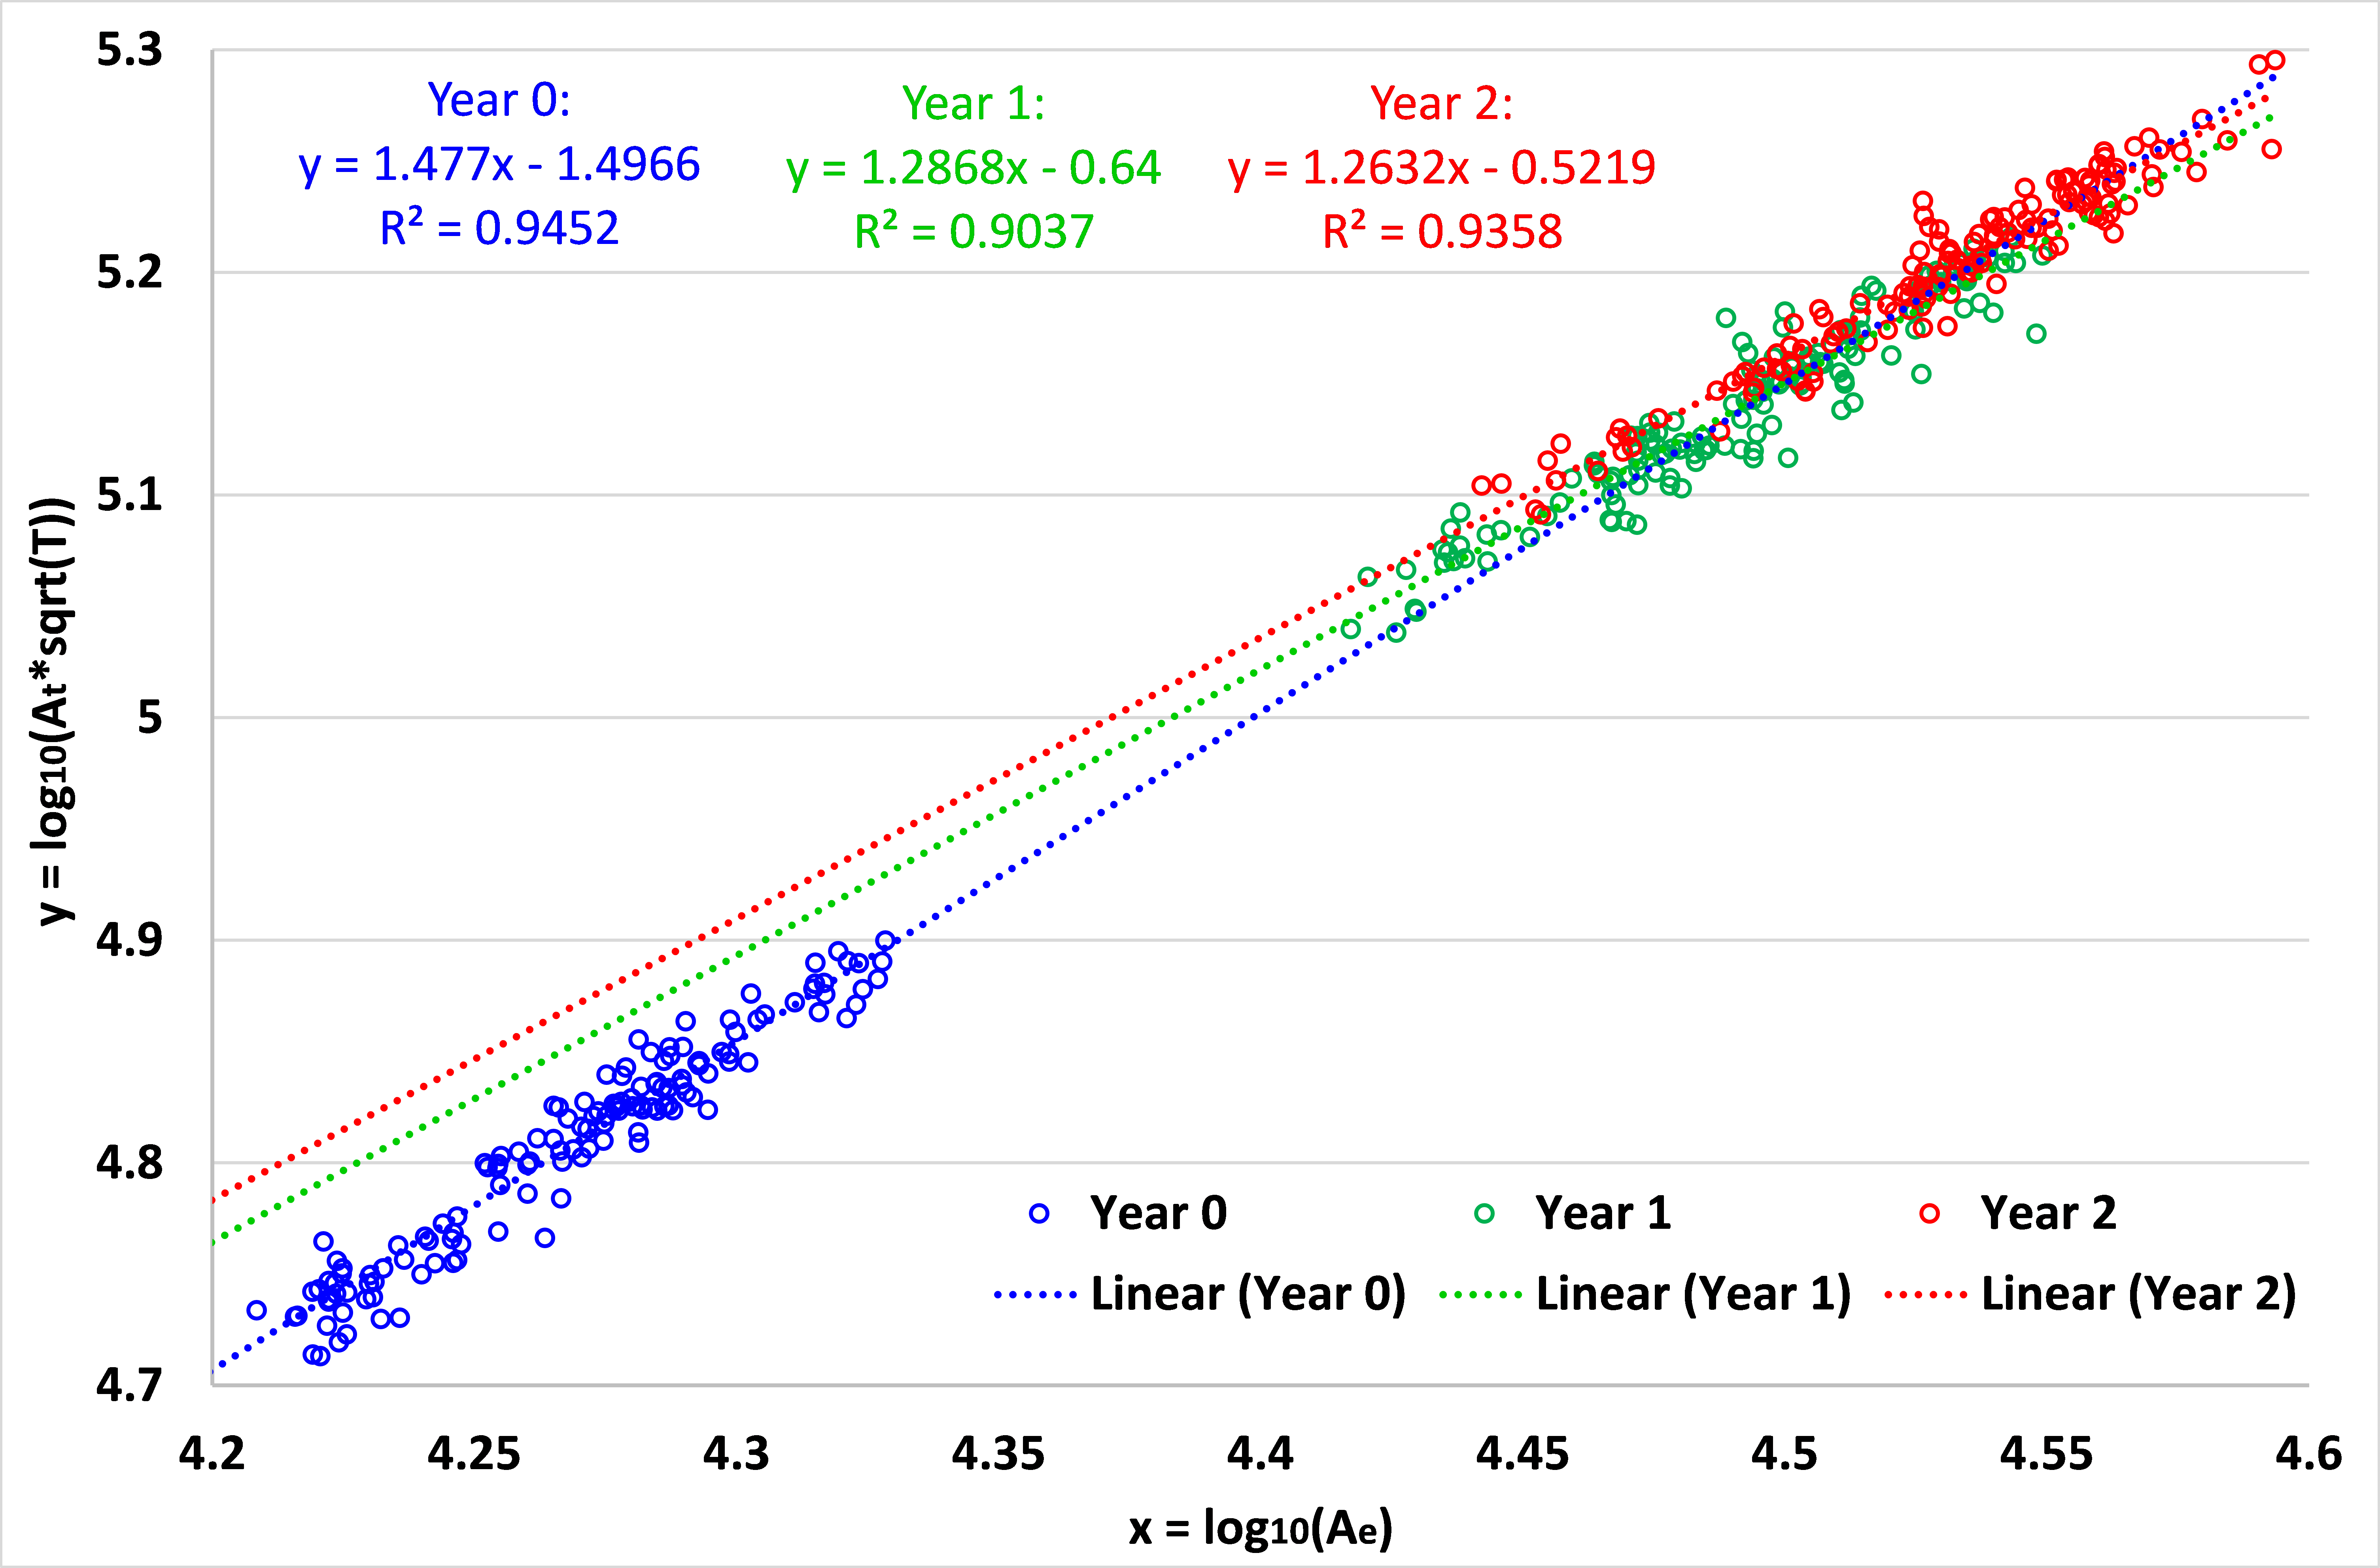
Fig. 1 displays the distributions of log10(Ae) and log10(At*T1/2) with the age for the 73 subjects. As we can see, both variables increase dynamically in the first year and then continue to increase in the second year. Meanwhile, both values are generally larger in males than in females at each age, consistent with the adult study 2. Fig. 2 shows the relationship between x=log10(Ae) and y=log10(At*T1/2) and their fitting models at 0, 1 and 2 years of age for all 73 subjects. At each age, although there is large inter-subject variability in x and y, there clearly exists a linear fitting model, with p < 0.00001. We carried out a multiple linear regression analysis with gender as a categorical variable, and found no significant gender effect at each age, agreeing with the adult MRI study 2. During the first year, the fitting model changes significantly in both slope and offset, from y = 1.477x - 1.4966 (R² = 0.9452) at year 0 to y = 1.2868x - 0.64 (R² = 0.9037) at year 1, which then changes only subtly to y = 1.2632x - 0.5219 (R² = 0.9358) at year 2. Of note, the slopes for year 1 and year 2 are close to the theoretically predicted slope 1 of 1.25.Discussion and Conclusion
We systematically investigated the relationship between surface area, cortical thickness, and folding in infants. We unprecedentedly revealed that this relationship is gender-independent, but age-specific, with a significant change in the first year, likely related to the differential biological mechanisms and developmental trajectories of surface area, cortical thickness and folding 3,4. In future, we will further investigate the age-specific relationship using more densely sampled data points during the first year and also study how neurodevelopmental disorders change this relationship.
Acknowledgements
This work was supported in part by NIH grants (MH100217, MH108914 and MH107815).References
1. Mota B, Herculano-Houzel S. Cortical folding scales universally with surface area and thickness, not number of neurons. Science. 2015;349(6243):74-7.
2. Wang Y, Necus J, Kaiser M, Mota B. Universality in human cortical folding in health and disease. Proc Natl Acad Sci USA. 2016; pii: 201610175.
3. Li G, Wang L, Shi F, et al. Mapping longitudinal development of local cortical gyrification in infants from birth to 2 years of age. J Neurosci. 2014;34(12):4228-38.
4. Li G, Lin W, Gilmore JH, Shen D. Spatial patterns, longitudinal development, and hemispheric asymmetries of cortical thickness in infants from birth to 2 years of age. J Neurosci. 2015;35(24):9150-62.
Figures