2284
Heterogeneous increases of cortical mean kurtosis across brain regions during infancy1Department of Radiology, Beijing Children’s Hospital, Capital Medical University, Beijing, People's Republic of China, 2Department of Radiology, Children’s Hospital of Philadelphia, Philadelphia, PA, United States, 3Department of Radiology, Perelman School of Medicine, University of Pennsylvania, Philadelphia, PA, United States
Synopsis
Brain development in the first few years of life is dramatic. The microstructural changes of infant grey matter measured by mean kurtosis, a non-Gaussian diffusion metric more sensitive to cortical microstructure than traditional diffusion metric, is not known. This study recruited 16 typical developing 3-32-months-old infants to investigate microstructural changes of the cerebral cortex by using Diffusion Kurtosis Imaging (DKI). Our results showed positive correlation between the mean kurtosis (MK) value and age. Differentiated age-dependent MK increases among different cortical regions suggest spatiotemporally heterogeneous pattern in cortical development.
Purpose
Human brain development is a nonlinear process and changes dramatically during the first few years of life. Microstructural changes of the white matter (WM) regions have been well documented in the previous investigations using the DTI method and are characterized by the increases in fractional anisotropy (FA) as myelination progresses 1. For the cortex regions, previous studies showed decreased FA suggesting neurite outgrowth and disruption of cortical glial scaffold 2-4 in fetal or preterm brains before normal time of birth. With cortical FA as low as in the noise level during infancy, diffusion kurtosis imaging (DKI) quantifying the degree of non-Gaussian water diffusion in complex media may better delineate the cortical microstructural development 5. We hypothesized that mean kurtosis(MK), derived from DKI, may offer unique and complementary information on cortical microstructural changes in infants. In this study, we aimed to gain more comprehensive insights into regional microstructural changes of the infants’ brain using DKI.Methods
Infant subjects and data acquisition:16 normal infant (7 males and 9 females, age range from 3 to 32 month) were recruited. For each subject, no evidence of bleeding or intracranial abnormality by routine MR imaging was found. Diffusion weighted images (DWIs) were performed using the Philips Achieva3T scanner using a single-shot, echo-planar imaging (EPI) sequence with Sensitivity Encoding parallel imaging scheme. The image size was 128 × 128 with a field of view (FOV) of 256 ×256 mm2. Axial slices of 2 mm thickness covered the entire brain without a slice gap. The repetition time (TR) and echo time (TE) were 9.3 seconds and 100 milliseconds. Diffusion weighting was encoded along 30 independent directions and the b-values were 1000 and 2500s/mm2.
Kurtosis and tensor fitting: the tensor fitting was conducted after motion and distortion correction. Kurtosis was fitted using a Diffusional Kurtosis Estimator (www.nitrc.org/projects/dke, Center for Biomedical Imaging, Medical University of South Carolina, USA) to generate the MK.
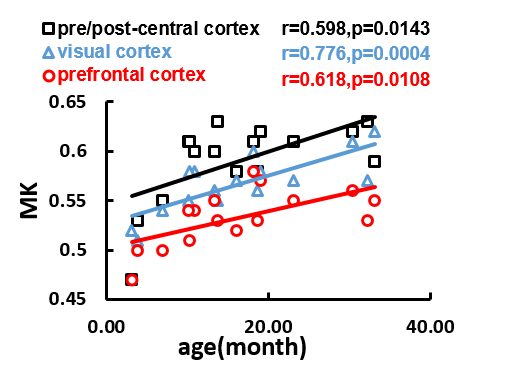
Regions of interests (ROIs) were drawn on MK map by a neuroradiologist on 3 different anatomic cortical regions, including the prefrontal cortex, visual cortex and pre/post-central cortex. The mean MK values were calculated for each ROI.
Results and discussion
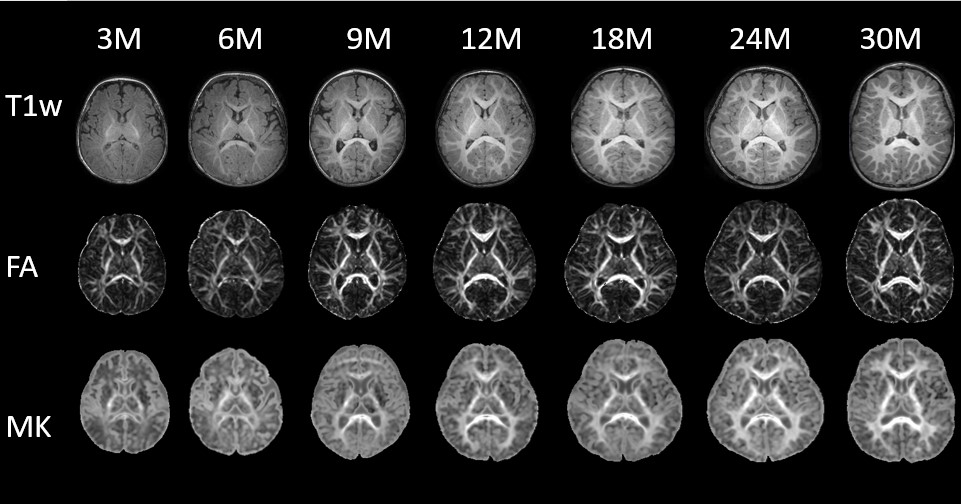
As shown in the Figure 1, the infant brains changed dramatically from 3 to 32 months. The size of the brain enlarged and the signal of T1, FA, and MK map showed the myelination of WM. As shown in Figure 2, the age -dependent MK demonstrated significant positive correlation with ages in all ROIs. The increased MK value may be related to the proliferation of cell membranes and organelles, the transition of radial glial cells to astrocytic neuropil, the addition of basal dendrites and cell packing 6-8, occurring in the developing cortex. Among the three ROIs, the MK value in pre/post-central cortex, representing primary sensorimotor area, was the highest followed by the visual cortex. The MK value in the prefrontal cortex was the lowest. It indicated that GM maturation progressed in a region- specific manner, and coincided with the previous study on the volume changes of cortical regions, which showed that the motor, sensory and visual cortex reached maturation earlier than prefrontal cortex 9.Conclusion
We demonstrated usage of DKI method to investigate the development of cortical regions of infant brain, which was more sensitive to the microstructure changes of the cellular processes in the cerebral cortex. These results revealed the pattern of cortical development and the development order of different cortical areas. Future studies include MK measurements of all cortical regions of infant brains with an automated approach.Acknowledgements
No acknowledgement found.References
[1] Yoshida S et al. (2013) Pediatr Radiol 43:15–27 [2] McKinstry R C et al. (2002). Cerebral Cortex, 1237-1243.[3] Huang H, et al.(2013) Cerebral cortex, 2620-2631.[4] Ball G, et al.(2013) Proceedings of the National Academy of Sciences, 9541-9546.[5] Jensen J H, et al.(2005) Magnetic Resonance in Medicine, 1432-1440.[6] Cheung MM, et al.(2009)Neuroimage 386–92 [7] Mukherjee P, et al.(2002) AJNR Am J Neuroradiol 1445–56[8] Hu¨ppi PS, Dubois J. (2006)Semin Fetal Neonatal Med 489–97[9] Tzarouchi L C, et al.(2009) Neuroimage, 1148-1153.Figures